Recently, I was involved in some work to assist the VMware Tanzu Observability team to assist them in updating their deliverables for OpenShift. Now it’s generally available, I found some time to test it out in my lab.
For this blog post, I am going to pull in metrics from my VMware Cloud on AWS environment and the Red Hat OpenShift Cluster which is deployed upon it.
What is Tanzu Observability?
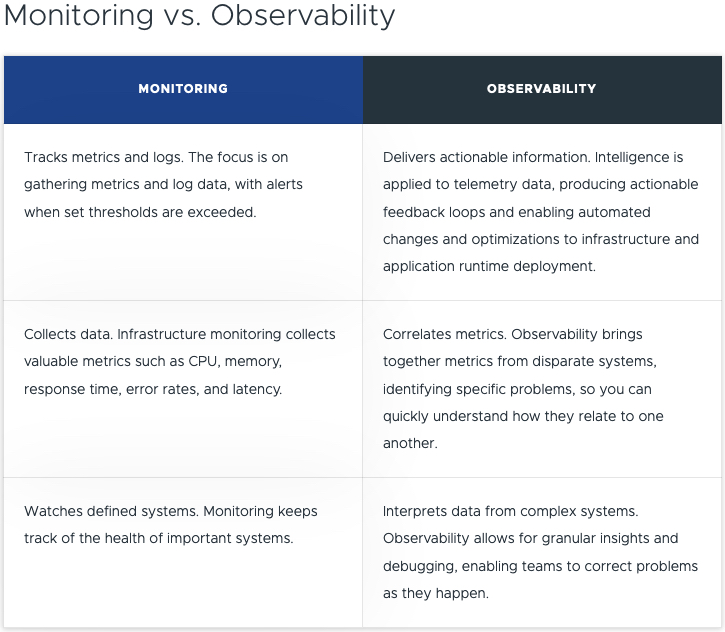
We should probably start with what is Observability, I could re-create the wheel, but instead VMware has you covered with this helpful page.
Below is the shortened table comparison.
As a developer you want to focus on developing the application, but you also do need to understand the rest of the stack to a point. In the middle, you have a Site Reliability Engineer (SRE), who covers the platform itself, and availability to ensure the app runs as best it can. And finally, we have the platform owner, where the applications and other services are located.
Somewhere in the middle, when it comes to tooling, you need to cover an example of the areas listed below:
- Application Observability & Root Cause Analysis
- App-aware Troubleshooting & Root Cause Analysis
- Distributed Tracing
- CI/CD Monitoring
- Analytics with Query Language and high reliability, granularity, cardinality, and retention
- Full-Stack Apps & Infra Telemetry as a Service
- Infra Monitoring
- Performance Optimization
- Capacity and Cost Optimization
- Configuration and Compliance
So now you are thinking, OK, but VMware has vRealize Operations that gives me a lot of data, so why is there a new product for this?
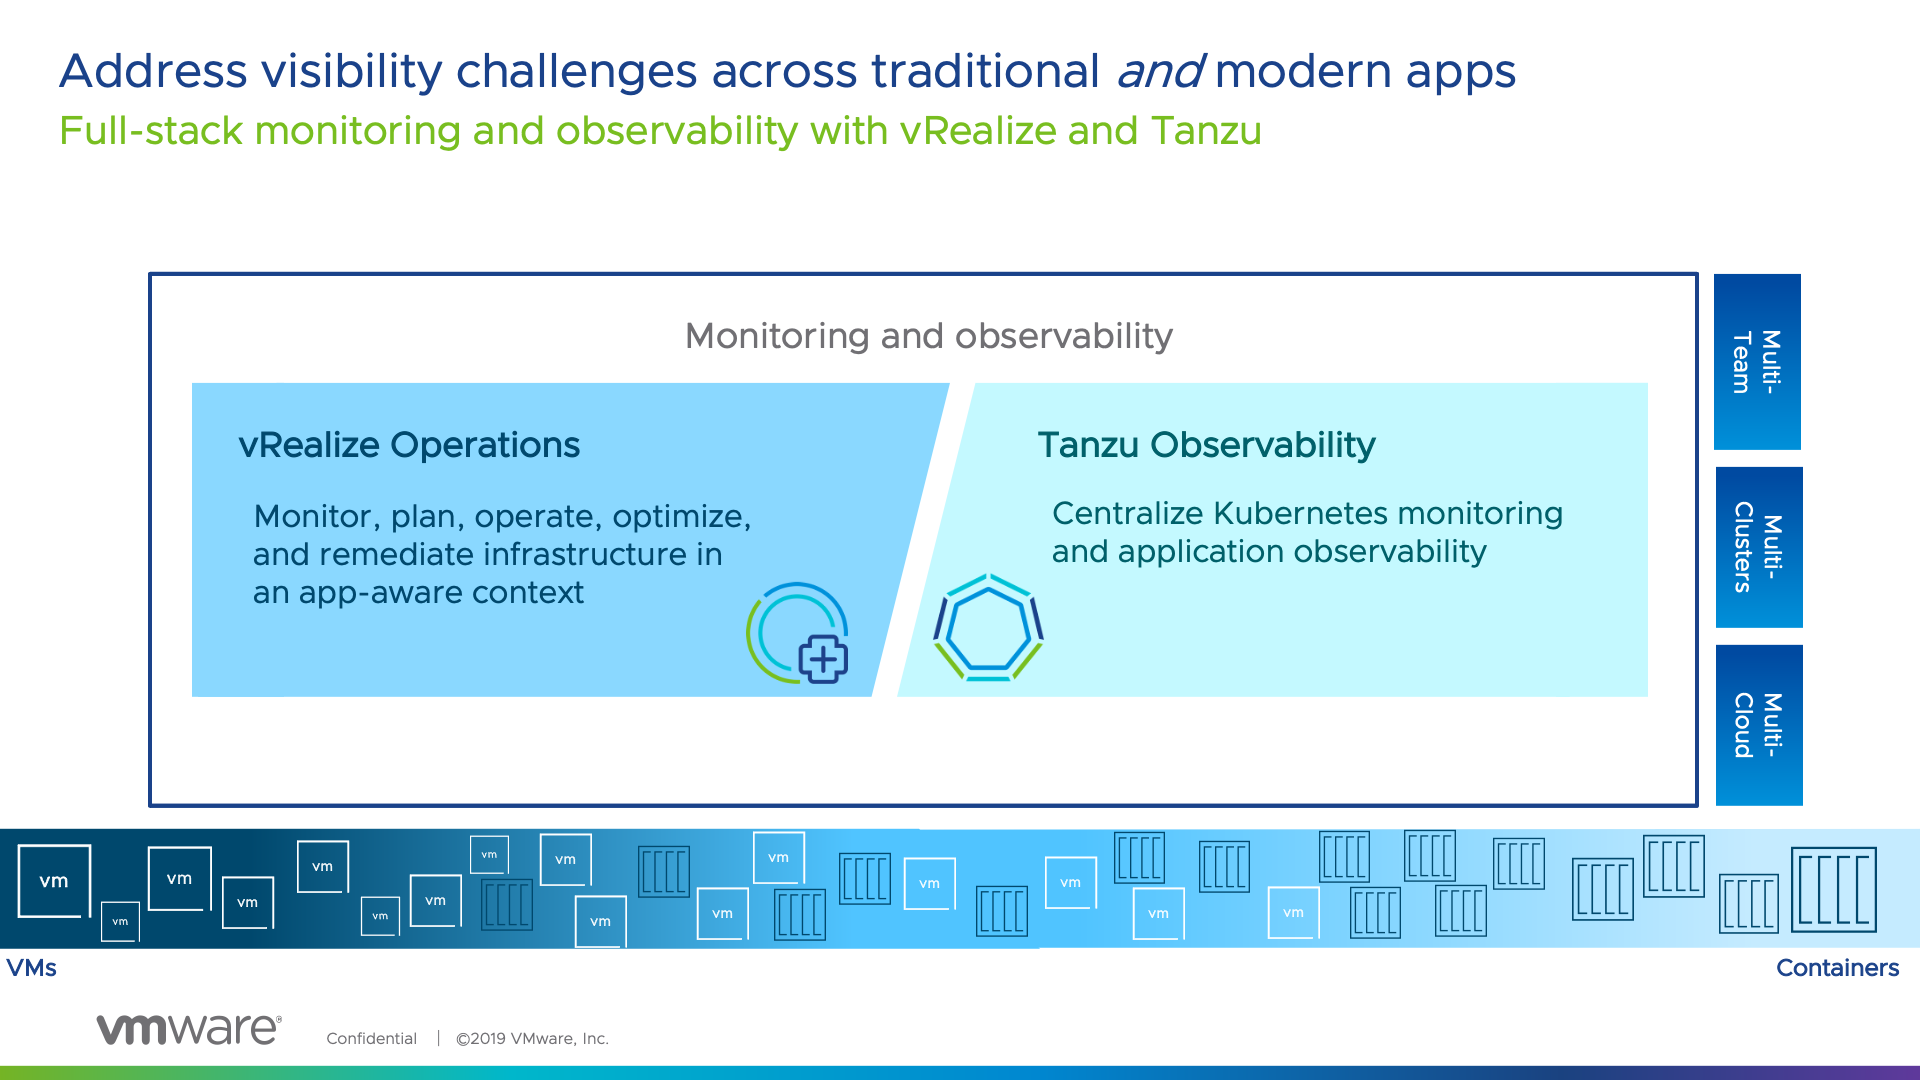
vRealize Operations and Tanzu Observability come together – delivering full stack monitoring and observability from both the infra-up and app-down perspective, equipping both teams in the org to meet common goals.
It is about the right tool for the right team and bringing together harmony between them. Which is why at VMware, the focus has been on covering the needs of team across the two products.
vRealize Operations is going to give you SLA metrics for your infrastructure and even application awareness. However Tanzu Observability brings more application focused features to allow you as a business, report on Application Experience of your end users/customers, at an SLA/SLO/KPI approach with extensibility to provide an Experience Level Agreement (XLA) type capability.
VMware Tanzu Observability by Wavefront delivers enterprise-grade observability and analytics at scale. Monitor everything from full-stack applications to cloud infrastructures with metrics, traces, event logs, and analytics.
High level features include:
- Accurate, Actionable Alerts with Analytics/AI
- Full-Stack Troubleshooting with Analytics/AI
- Optimize Performance
- Dashboards powered by Analytics for full visibility
- Advanced Analytics in Real-Time
- Comprehensive API
- Microservices Observability With Distributed Tracing
- Ingest and Visualize All Your Telemetry Quickly with our Massive Integrations Library
To follow this blog, you can also easily get yourself access to Tanzu Observability.
- Sign up for a trial here!
Configuring data ingestion into Tanzu Observability using the native integrations
Configuring the OpenShift (Kubernetes) Integration using Helm
First, we need to create an API Key that we can use to connect our locally deployed wavefront services to the SaaS service to send data.
- Note down your Tanzu Observability URL address when you are logged in it will be something like:
- https://{name}.wavefront.com
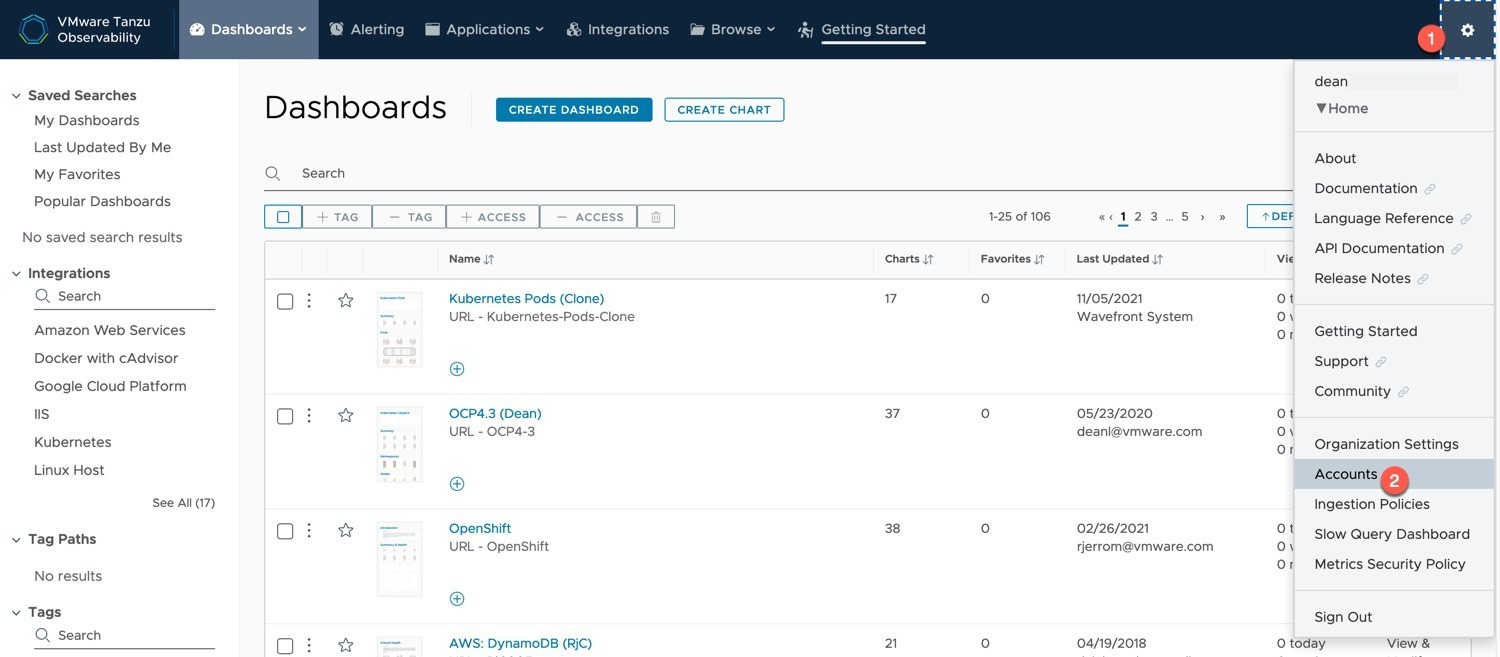
- Click on the Settings cog on the right hand top corner
- Select “Accounts” from the drop-down menu
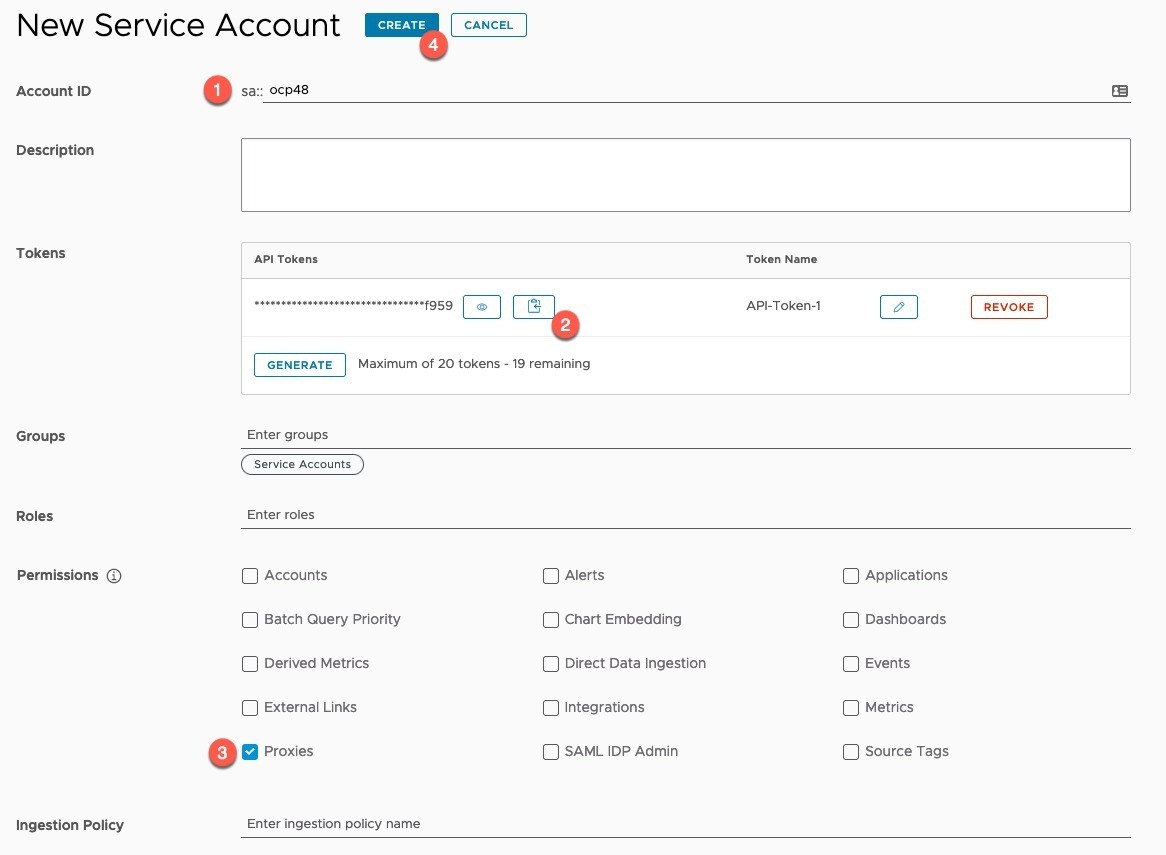
- Click on the “Service Accounts” Tab
- Click “Create new account” button
- Provide a name
- Copy your token
- You can create up to 20 tokens per account, each proxy to send data to Wavefront will use a single token.
- Select the “Proxies” permission
- Click Create
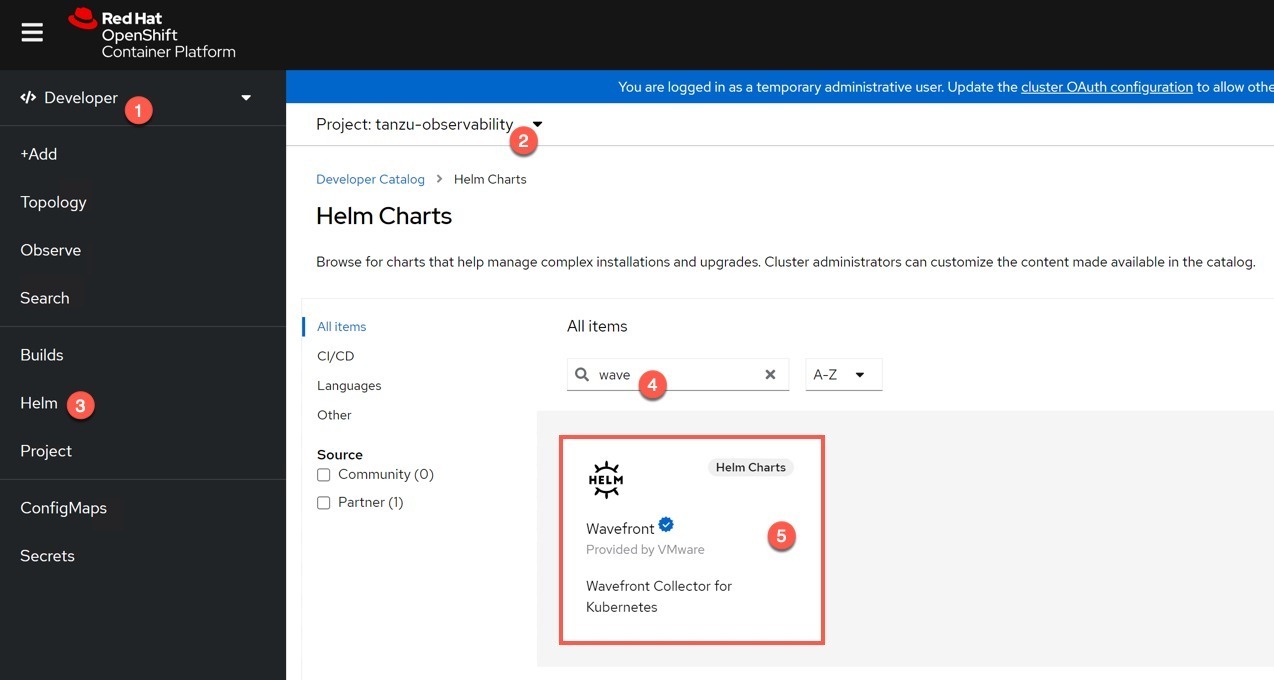
Log into your OpenShift Cluster.
- Change to the Developer view
- Ensure you have created and selected an appropriate project/namespace, I called mine “Tanzu Observability”
- Select Helm from the left-hand navigation pane
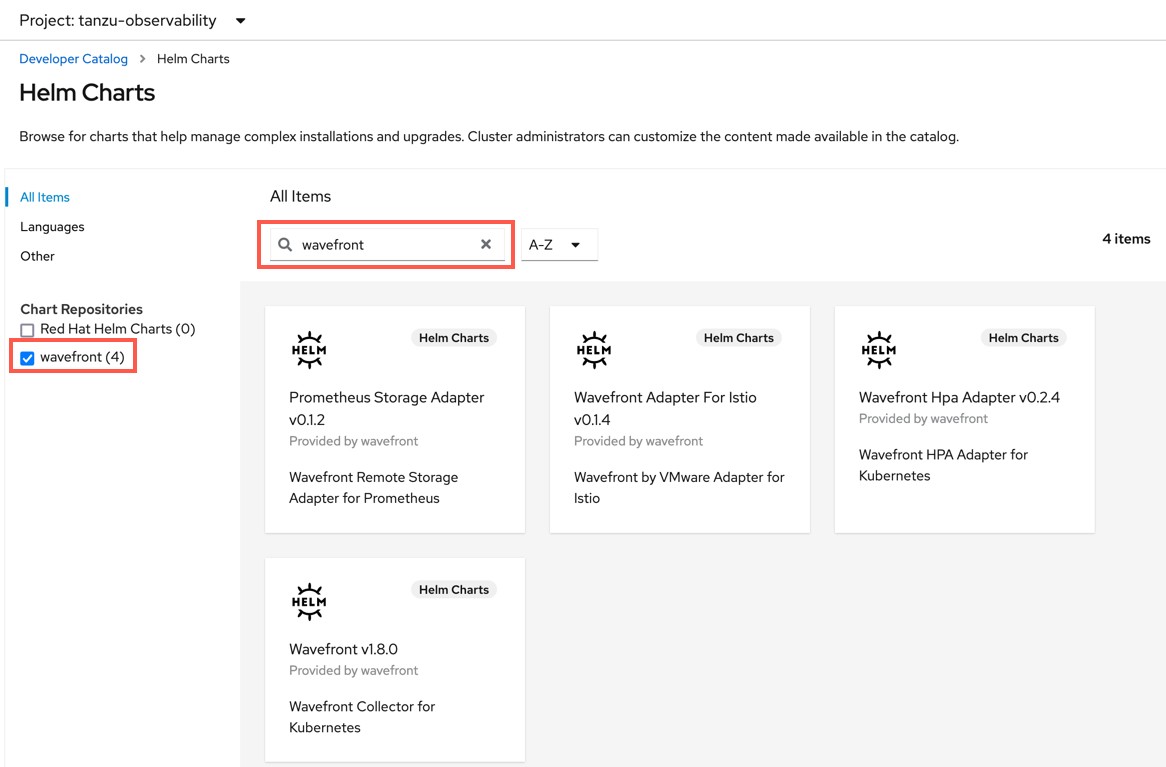
- Search for “wavefront”
- Select the Wavefront chart
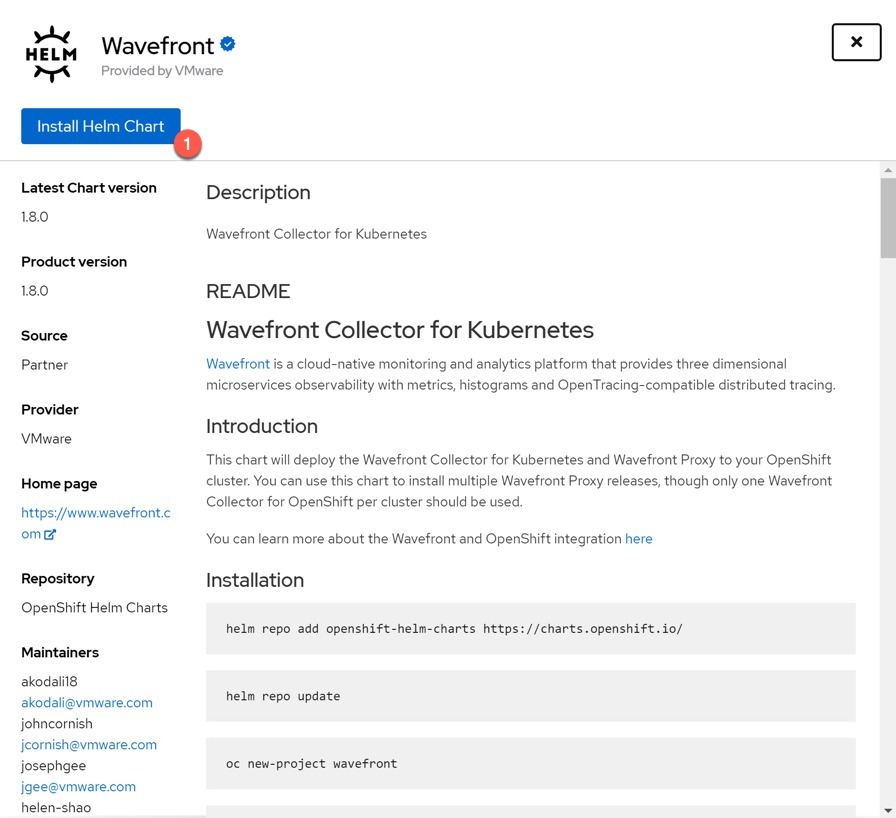
- Select to install the Helm Chart
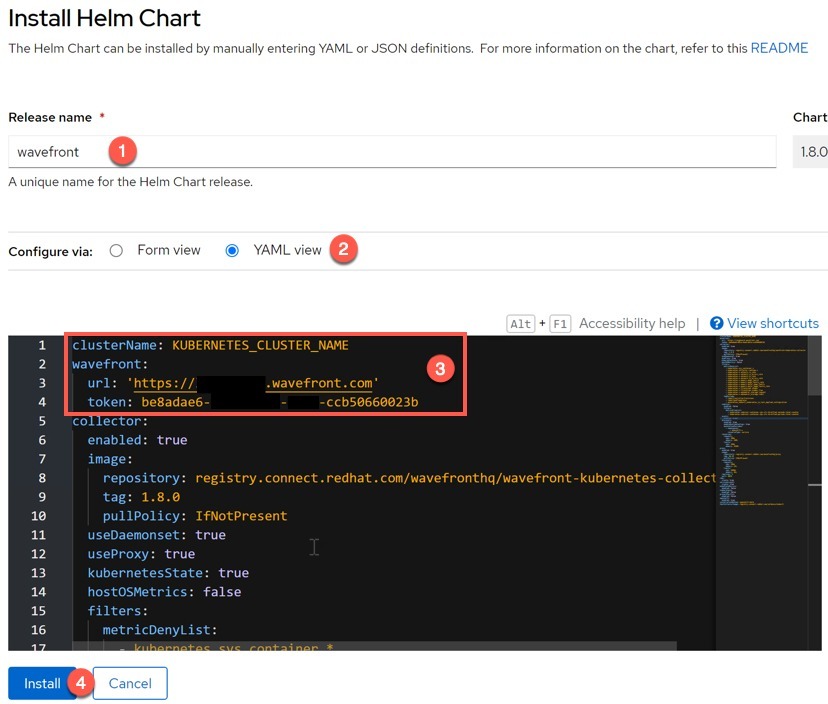
- Provide a name for the helm release install (default: wavefront)
- Select the YAML View to provide your necessary information
- Input your Cluster Name as you want it to appear in Tanzu Observability interface
- Provide the URL of your Tanzu Observability service
- Provide the API Key you created earlier.
- Click the “Install” button
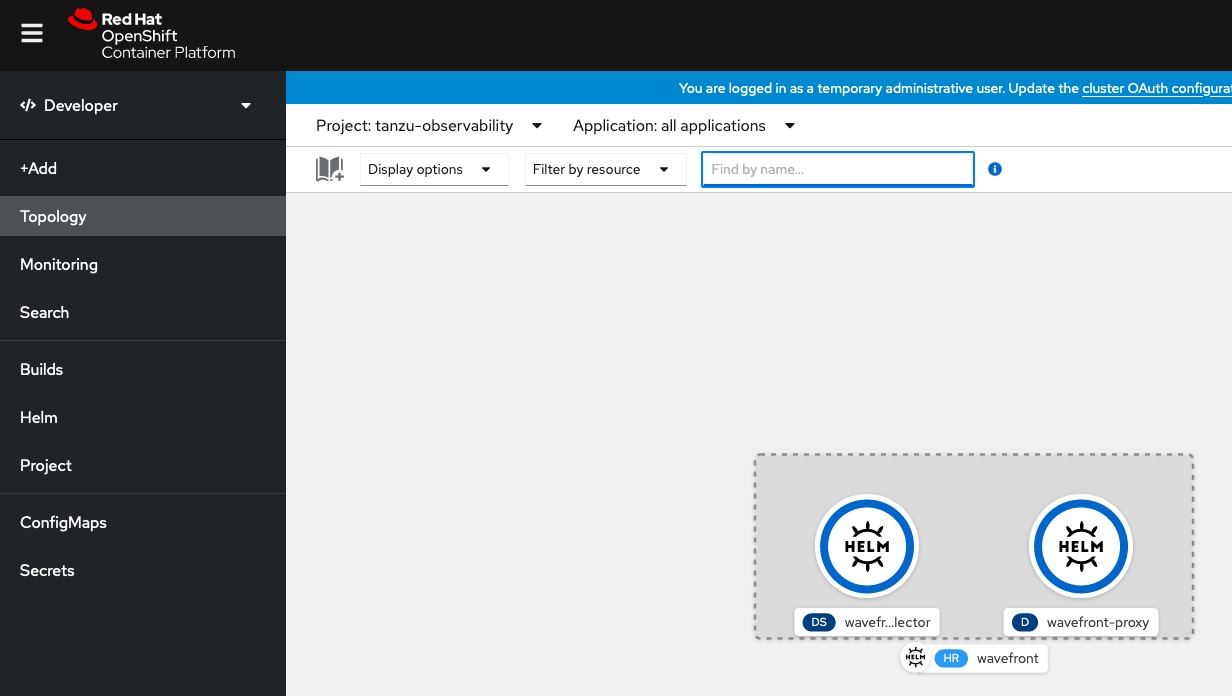
You will be taken to the Topology view of the project, and we can see our Deployment and DaemonSets as part of the helm chart.
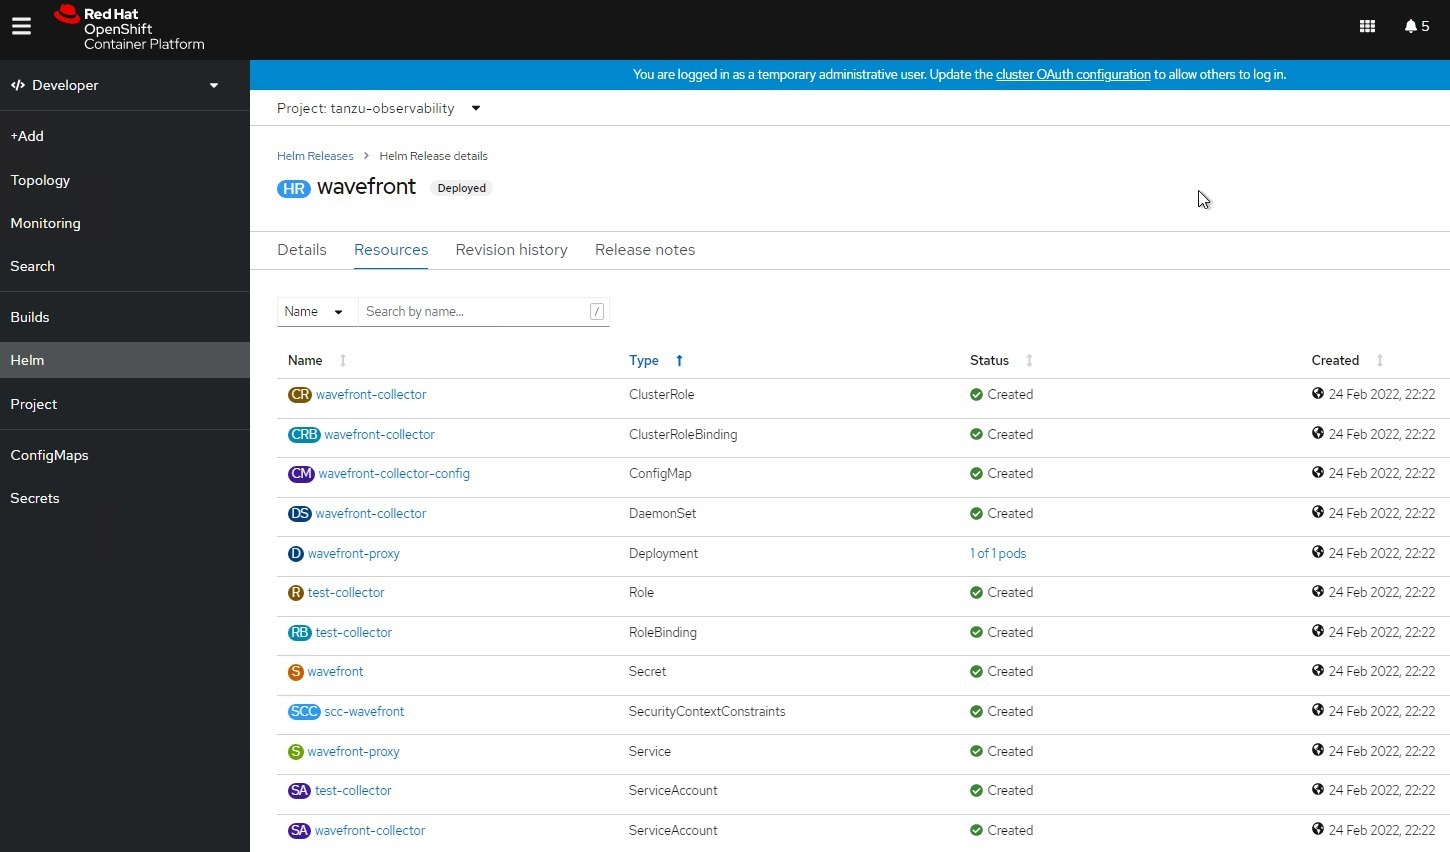
Going back into the Helm Chart deployment itself, we can see all the resources deployed.
Before I show you the data in Tanzu Observability, I’m going to move onto how to setup the VMware Cloud on AWS connectivity first. Then you will see how we can chart out VM level and Kubernetes level metrics for the same Kubernetes object.
Configuring Wavefront Helm on OpenShift 4.7 or lower
Older versions of OpenShift use older Red Hat repositories for the 3rd party vendor Helm Charts as part of the marketplace experience.
You can add the Wavefront Helm repository as a custom Chart Repository by creating the following CRD in your environment.
apiVersion: helm.openshift.io/v1beta1
kind: HelmChartRepository
metadata:
  name: wavefront
spec:
  connectionConfig:
    url: https://wavefronthq.github.io/helm/
  name: wavefront
Once you have applied this configuration, in the Helm view of the OpenShift UI, you will see the Wavefront Chart Repo listed on the left, and the charts now showing as tiles.
Configuring the integration with VMware Cloud on AWS (VMware vSphere)
For this setup, you will need to deploy Wavefront proxy to send data from your VMC environment, and associated collector service which is provided by Telegraf. There are several ways to do this, either within a VM or as a container running in Kubernetes.
In my environment, I chose to use an existing Ubuntu VM to run both the Proxy and Telegraf Collector.
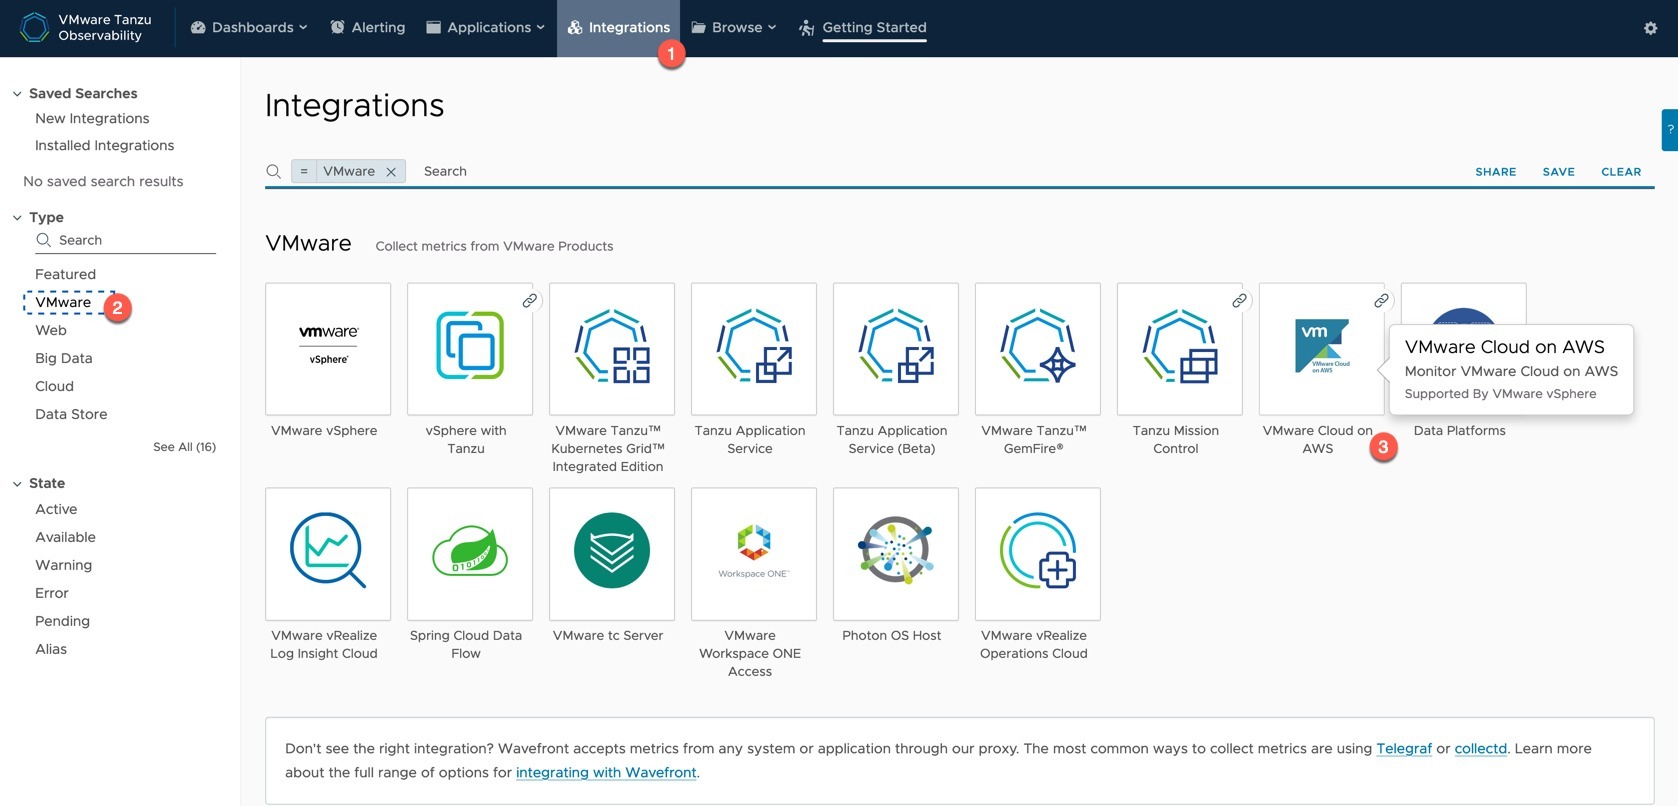
- Click the main integrations Tab
- You can filter by Integration Type “VMware”
- Click on the VMware Cloud on AWS Tile
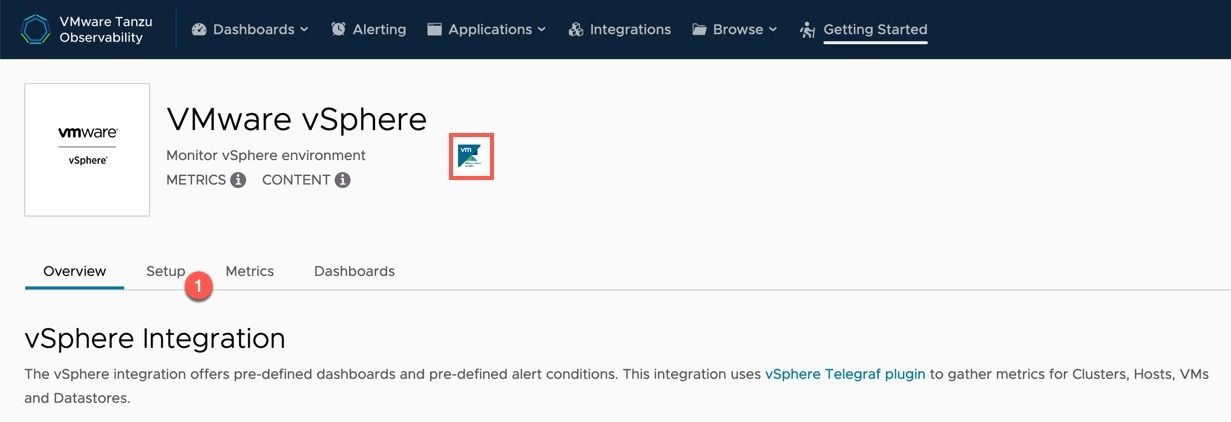
This will take you to the VMware vSphere integration page, as it’s essentially the same. However, the little tile I put a red box around, if you hover over it, will tell you the VMC integration is backed by the vSphere integration.
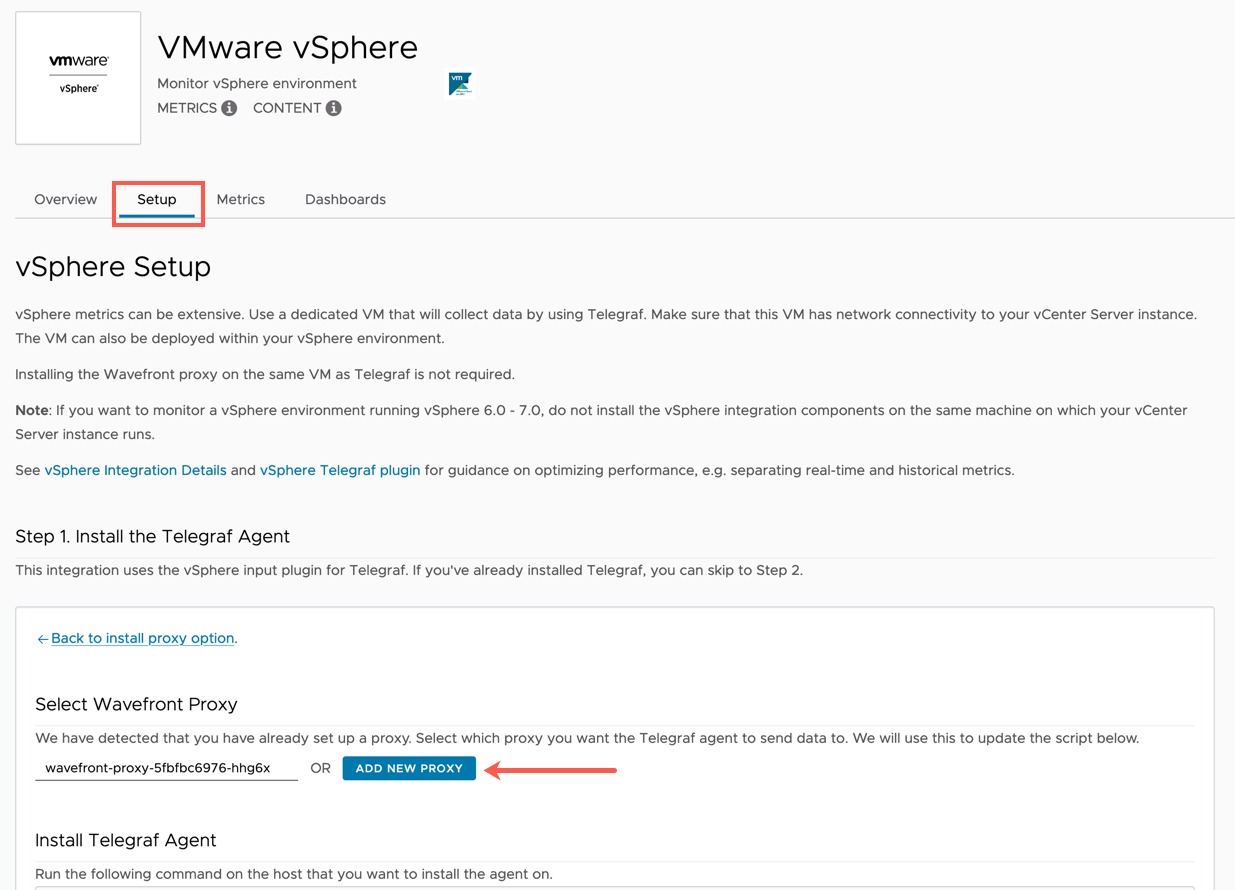
- Click the Setup Tab
Within the Setup Tab, we first need to setup our Proxy, which takes us off on a bit of a side quest.
- Click the new proxy button – This will take you to a new page
- You can see the name of the proxy that is running in my OpenShift environment already, but we won’t be using that for this example. (But you could if you wanted).
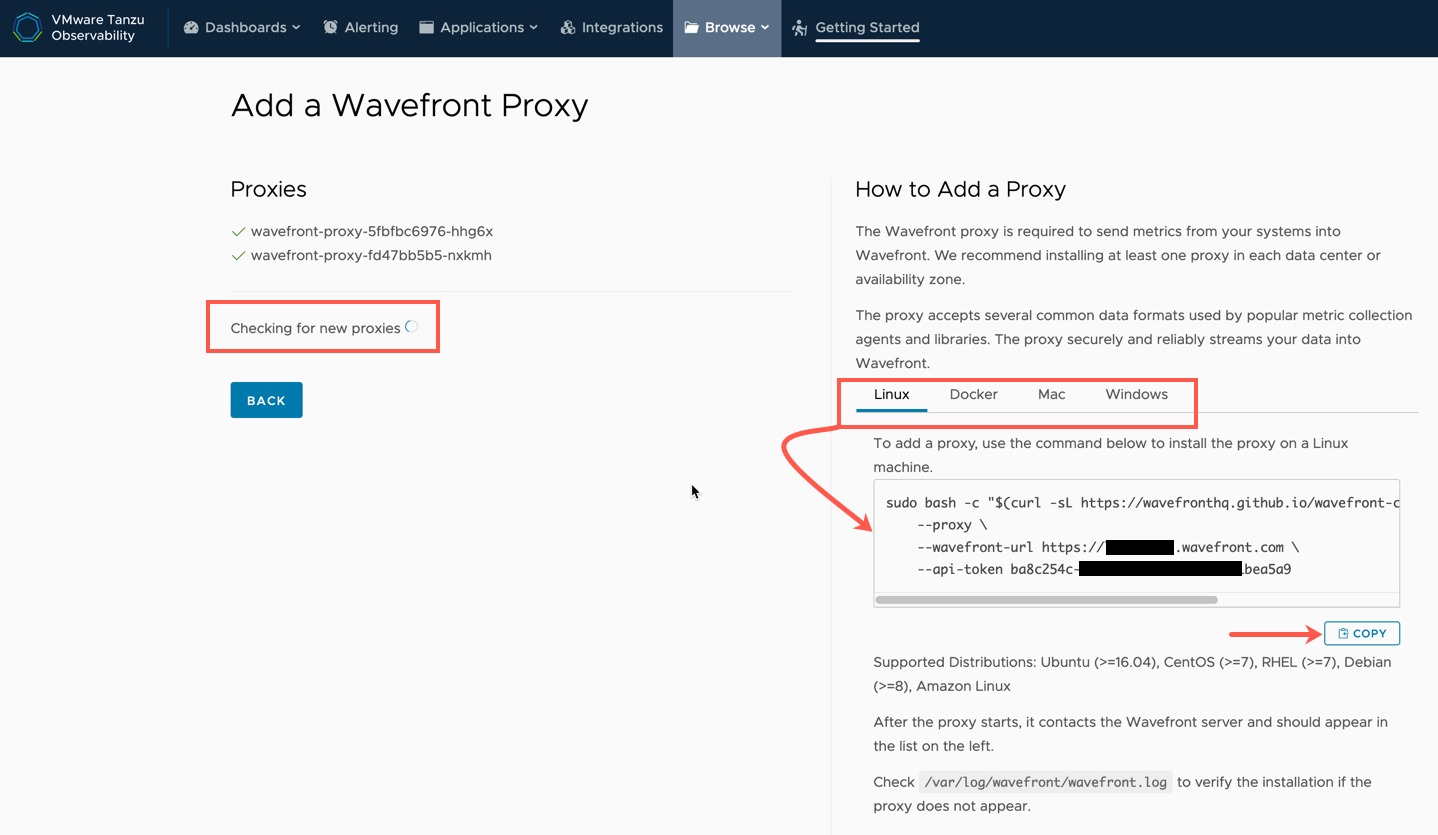
Once you click the “Add new proxy” button from above, you will be taken to the “Add a Wavefront Proxy page”.
On the left-hand side you will see the page it constantly searching for any newly connected proxies.
On the right-hand side, you have your various installation options for the proxy. This page will give you, for example, an install command with the associated API Token it self-generates for you.
I’ve copied the Linux script.
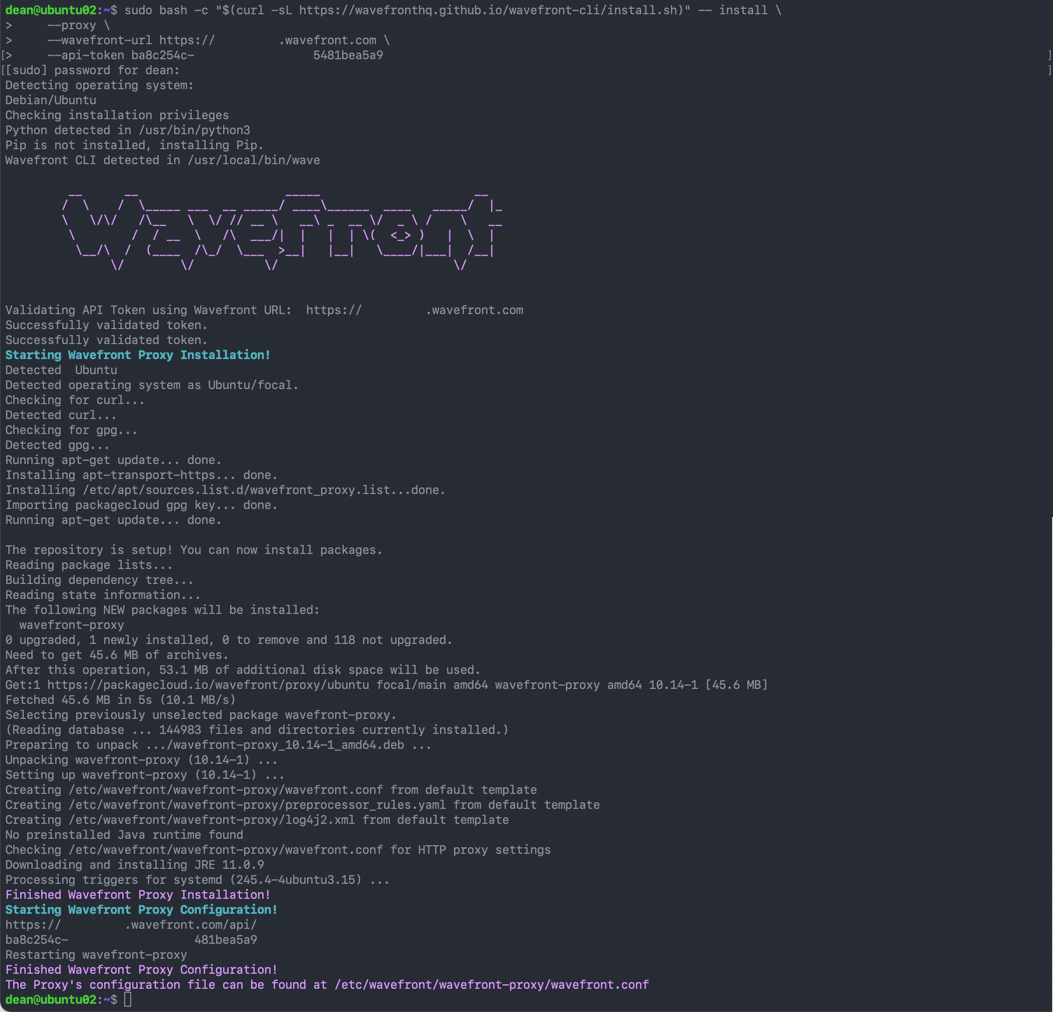
Below is my full output for the installation on my Ubuntu VM for reference.
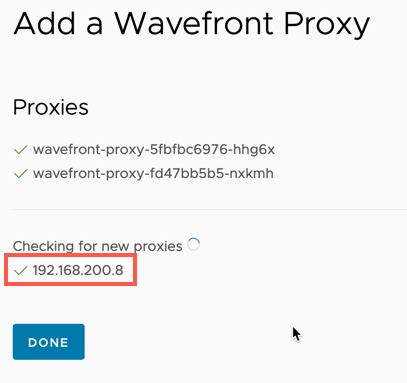
Now back on the Tanzu Observability website, you can see my proxy has appeared in the list.
Clicking “Done” will take you back to the VMware vSphere Integration Page.
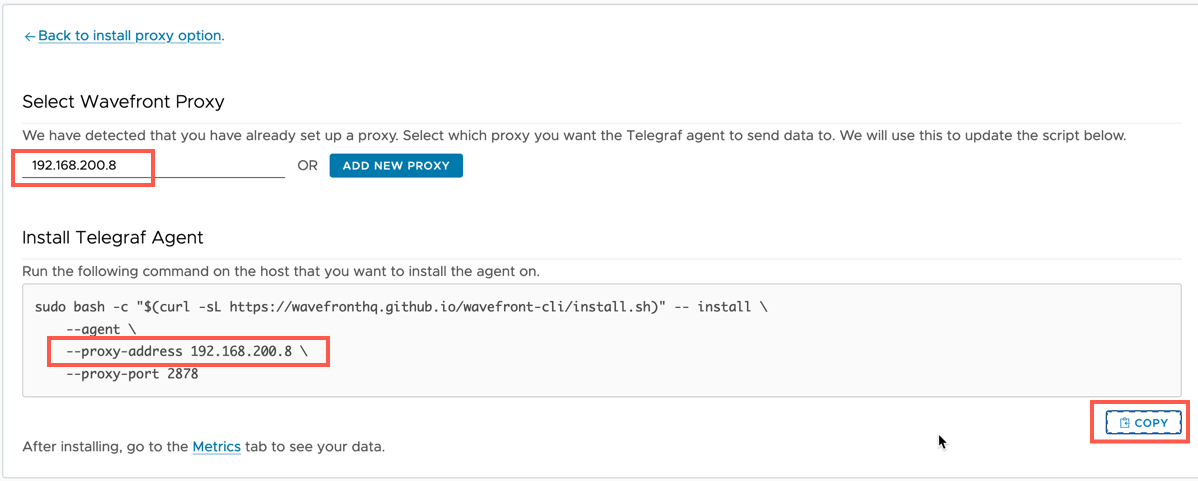
Back on the VMware vSphere Integration page, we can now select my new proxy, which updates the installation script for the Telegraf agent.
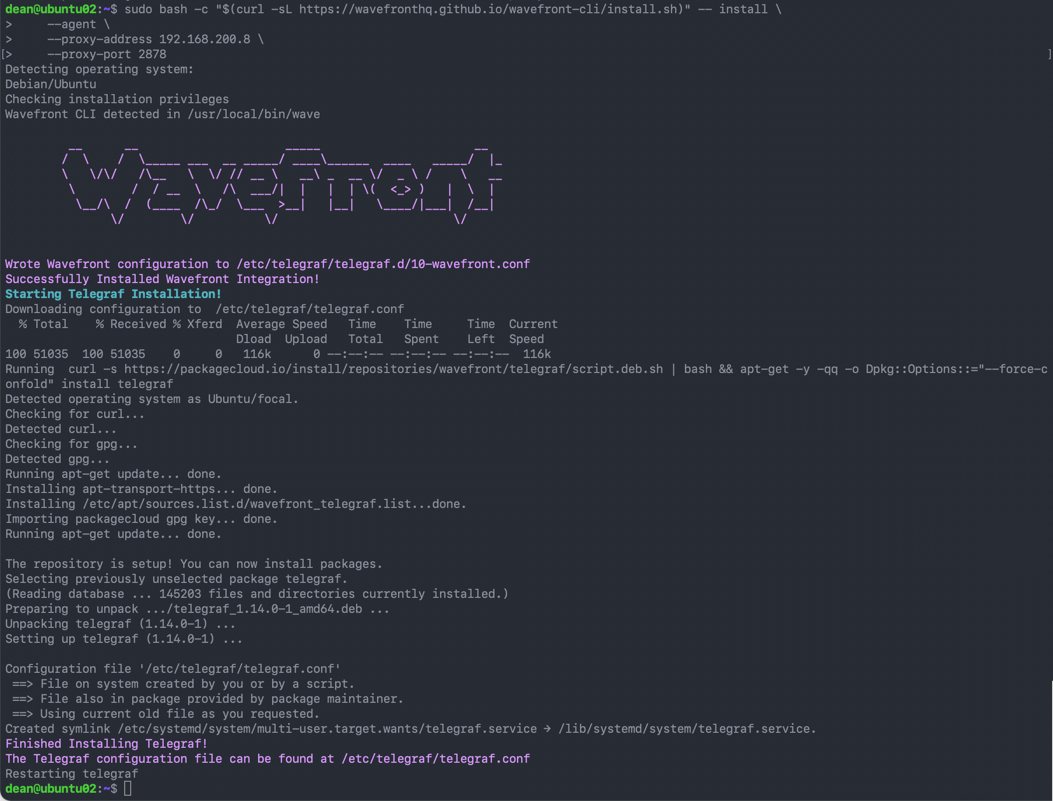
Below is the out of the installation of the Telgraf Agent on the same Ubuntu VM from earlier.
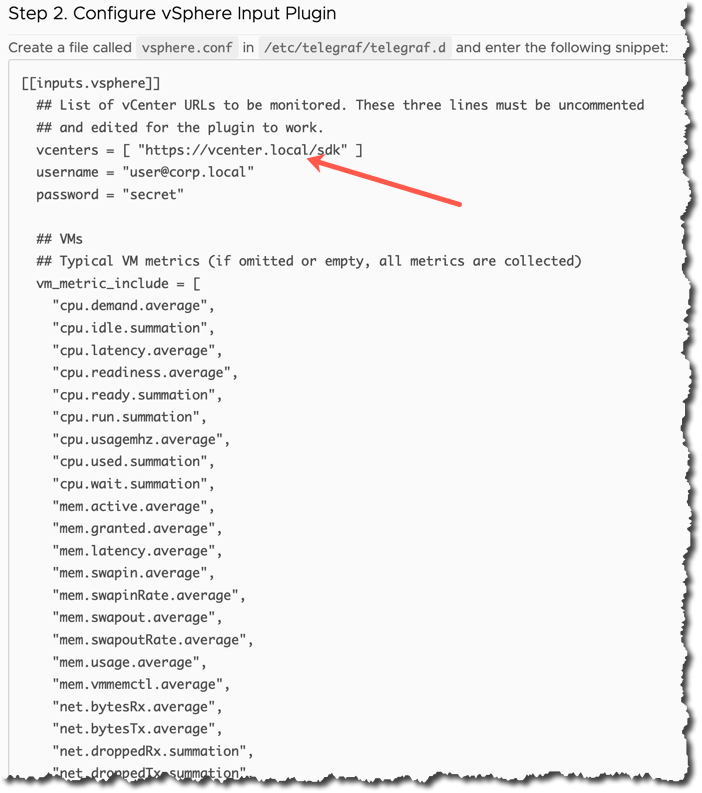
Now for the next step we need to take the provided configuration for the vSphere.conf file that is used to tell telegraf what data to collect.
- Copy this output to a file and edit to include
- vCenter
- Username
- Password
Create a new file called “vSphere.conf” in the directory “/etc/telegraf/telegraf.d/vsphere.conf” and paste in your content and save.
Restart the telegraf service.
sudo vi /etc/telegraf/telegraf.d/vsphere.conf
sudo service telegraf restart
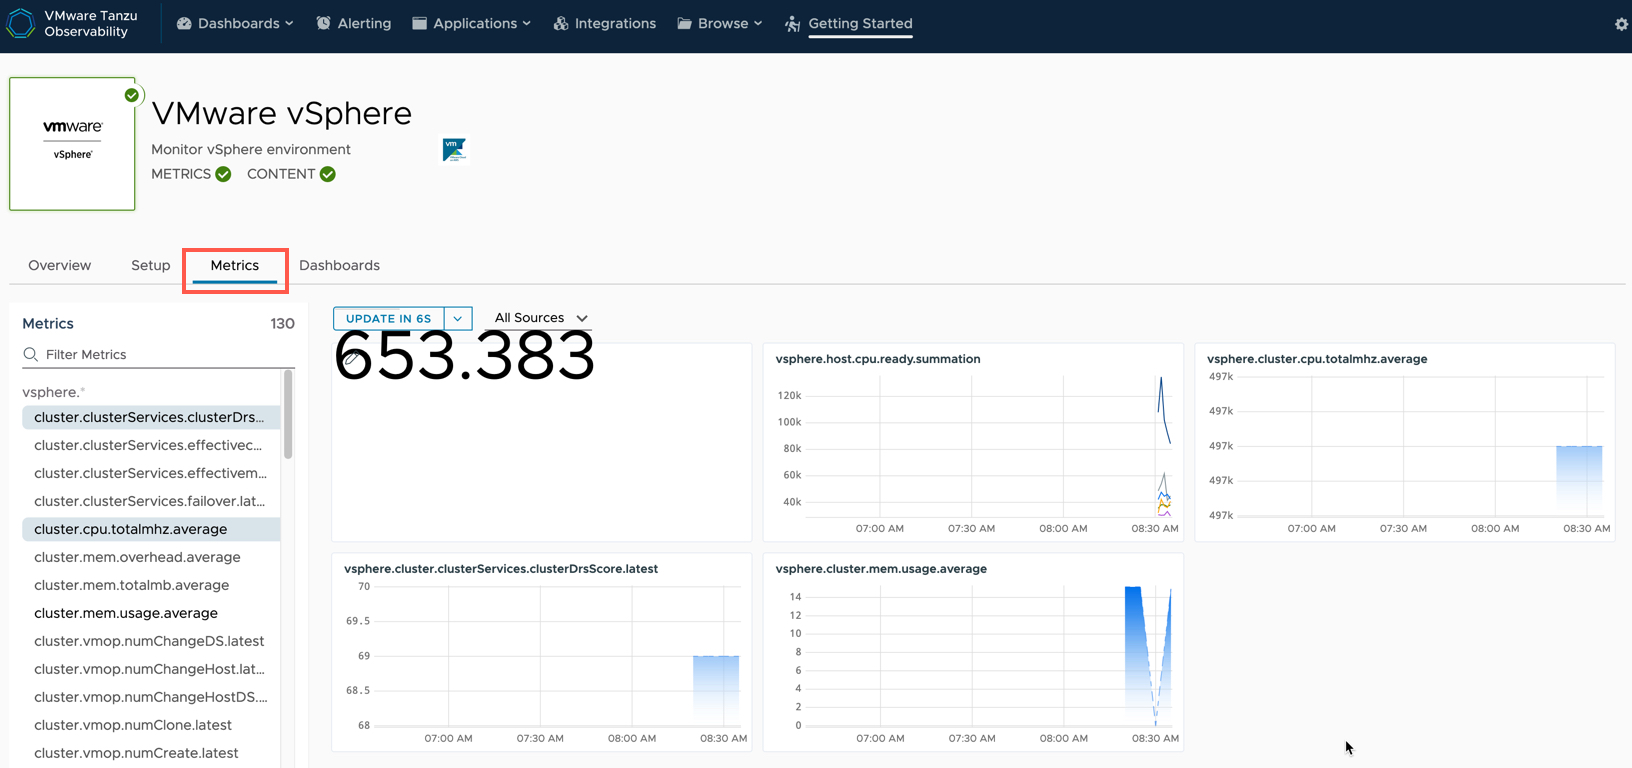
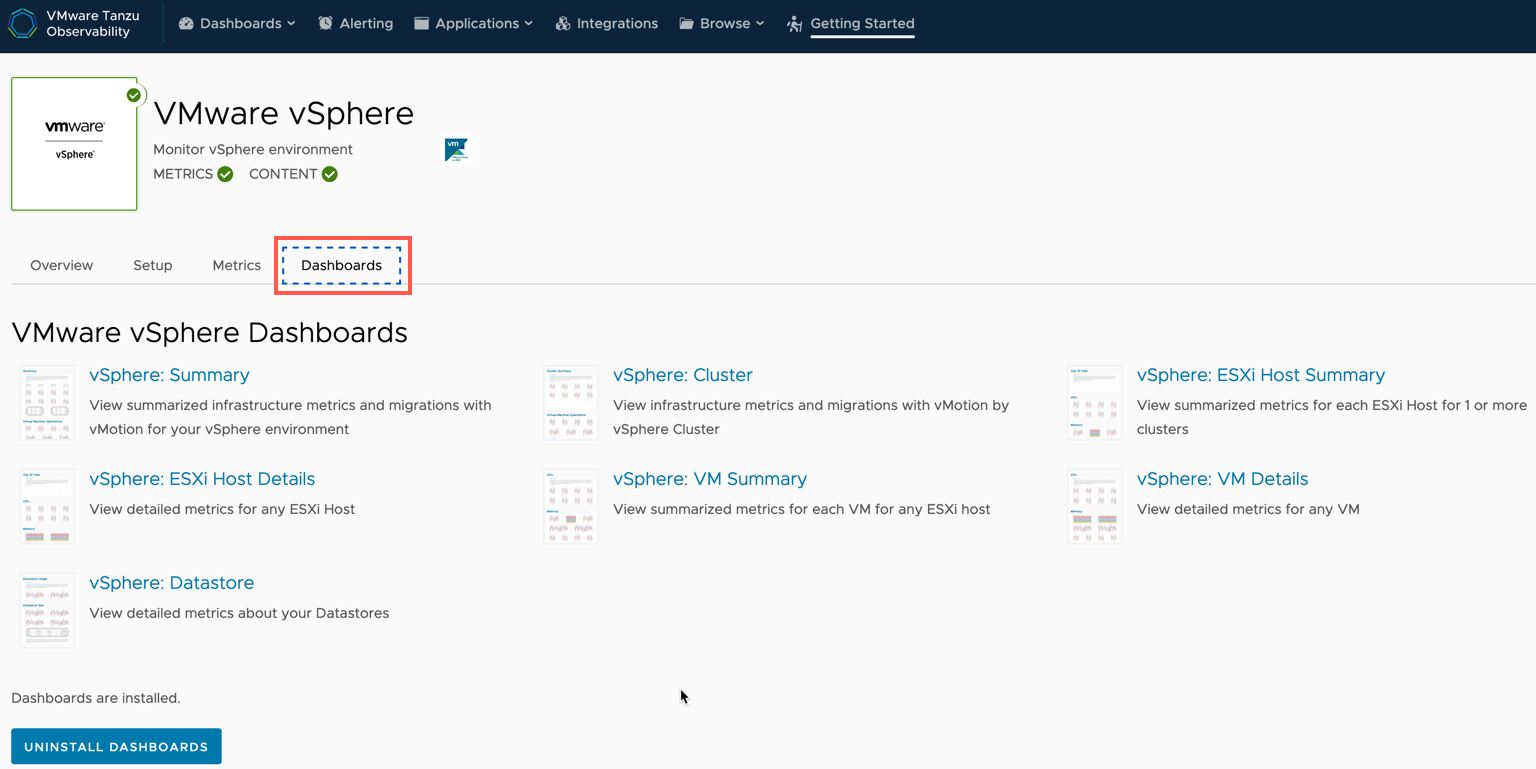
After a few minutes on the VMware vSphere Integration page, you’ll see the Metrics and Content change to Green Ticks, meaning Tanzu Observability is receiving data and auto installed the dashboards for you. (Cool, eh?).
You can click the Metrics tab and view all the collected metrics and chart them out.
Clicking the Dashboards tab, you can see all the automatically out-of-the-box installed dashboards for the Integration.
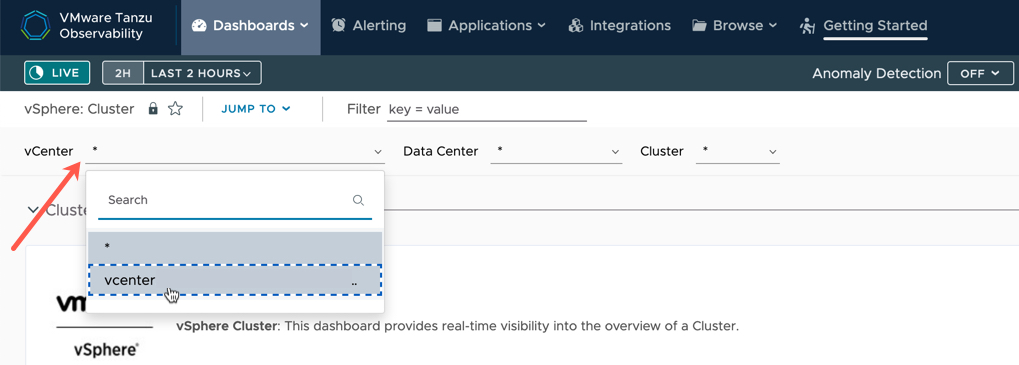
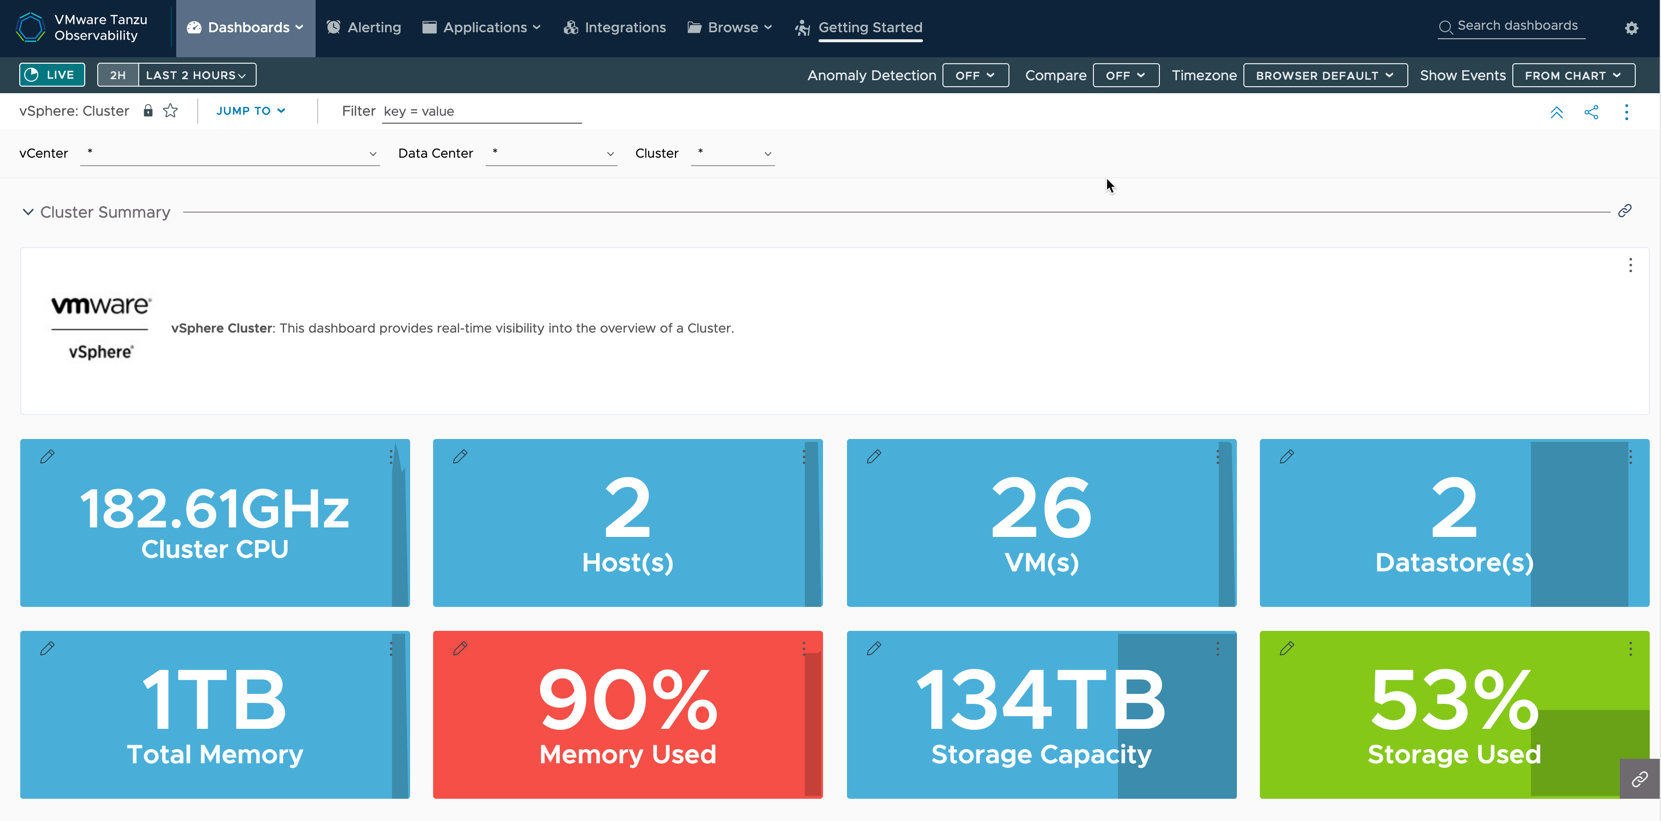
Below I’ve selected the “Cluster” dashboard. You can filter the information at the top, for example by vCenter if you have multiple monitored.
Charting a Node’s Kubernetes and vSphere metric data
You have many ways to get access to views of data in Tanzu Observability.
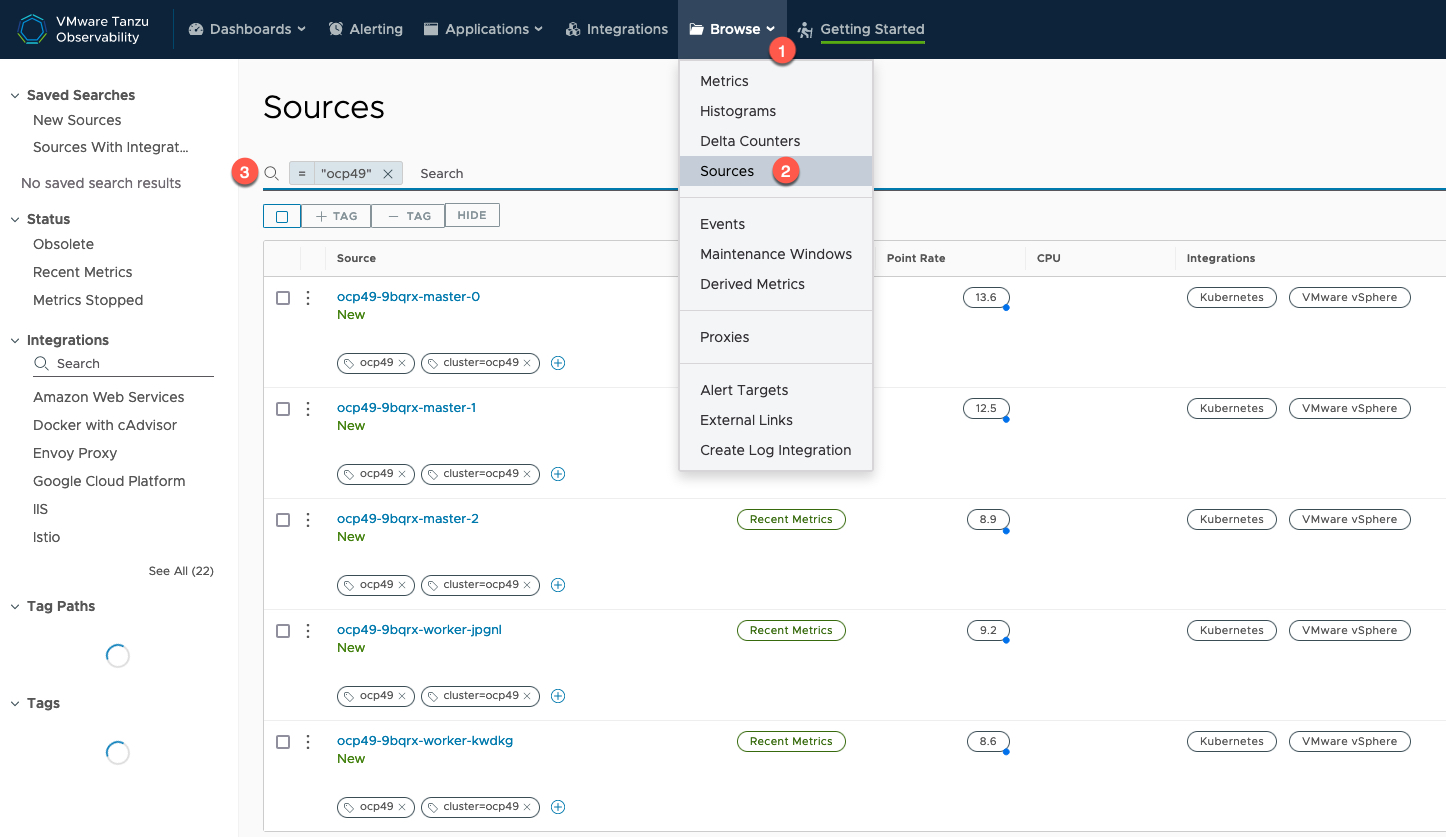
One such way is via the Object source.
- Click Browse Tab
- Select Sources
- Filter as needed
- Select the object you are interested in.
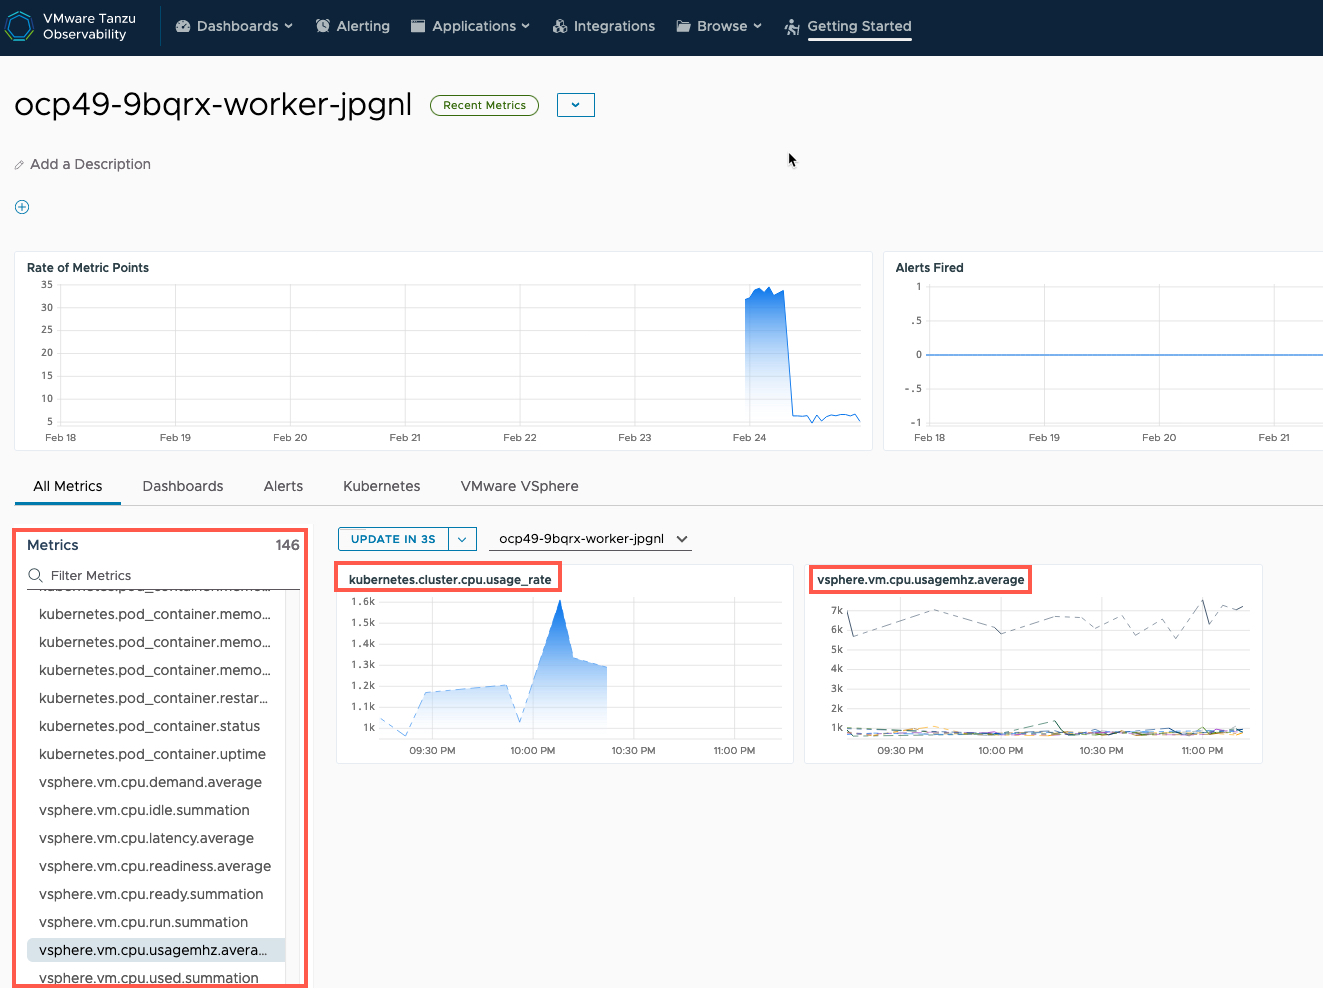
I’ve selected one of the OpenShift nodes, Tanzu Observability will show me all the collected Metrics for this source, which provides coverage across both Kubernetes and vSphere.
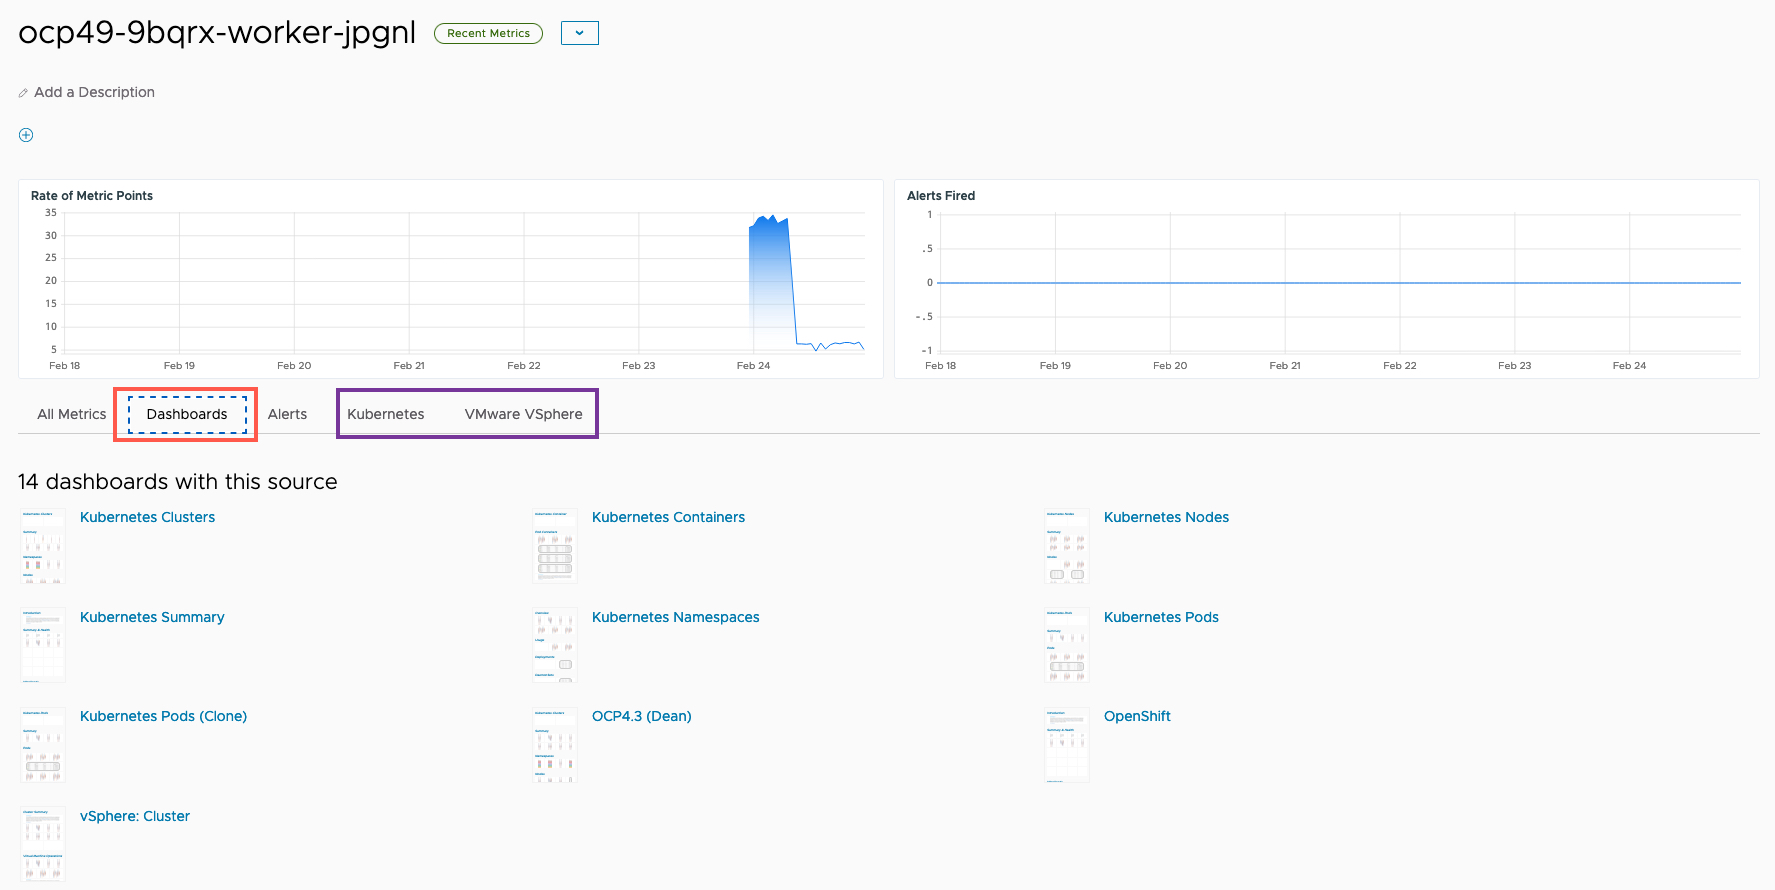
Clicking the Dashboard tab will show all associated dashboards, and in purple I highlighted the specific integration types that are available too.
A quick look at the Kubernetes Charts and Dashboards
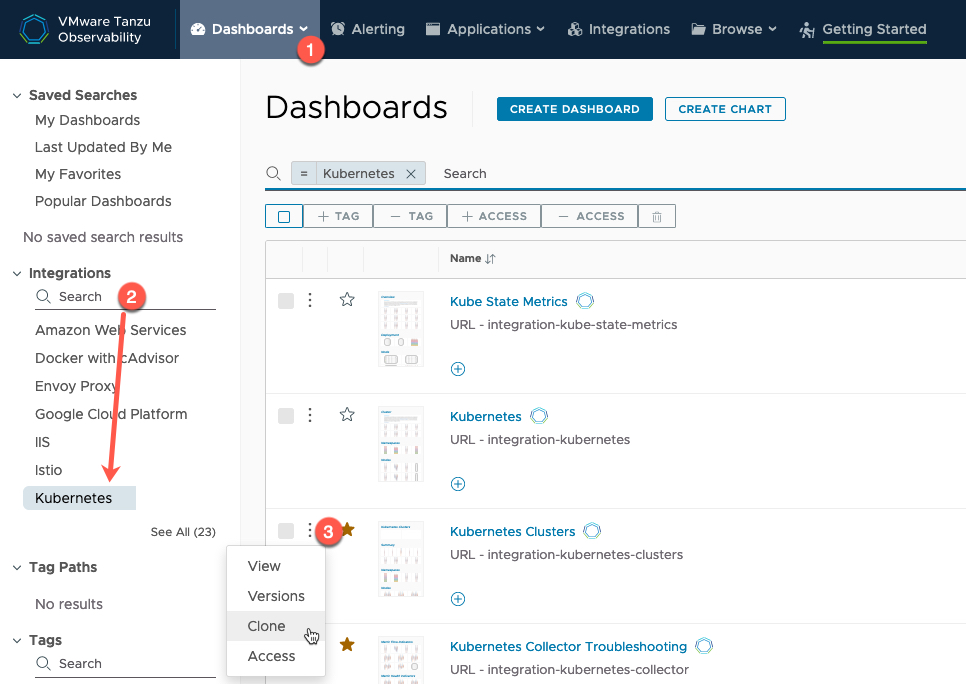
To view any dashboard, click the Dashboards Tab. you can Filter, such as by integration.
For any out-of-the-box dashboard, you cannot edit these directly, so to make changes, click the three dots next to the dashboard name and clone the dashboard.
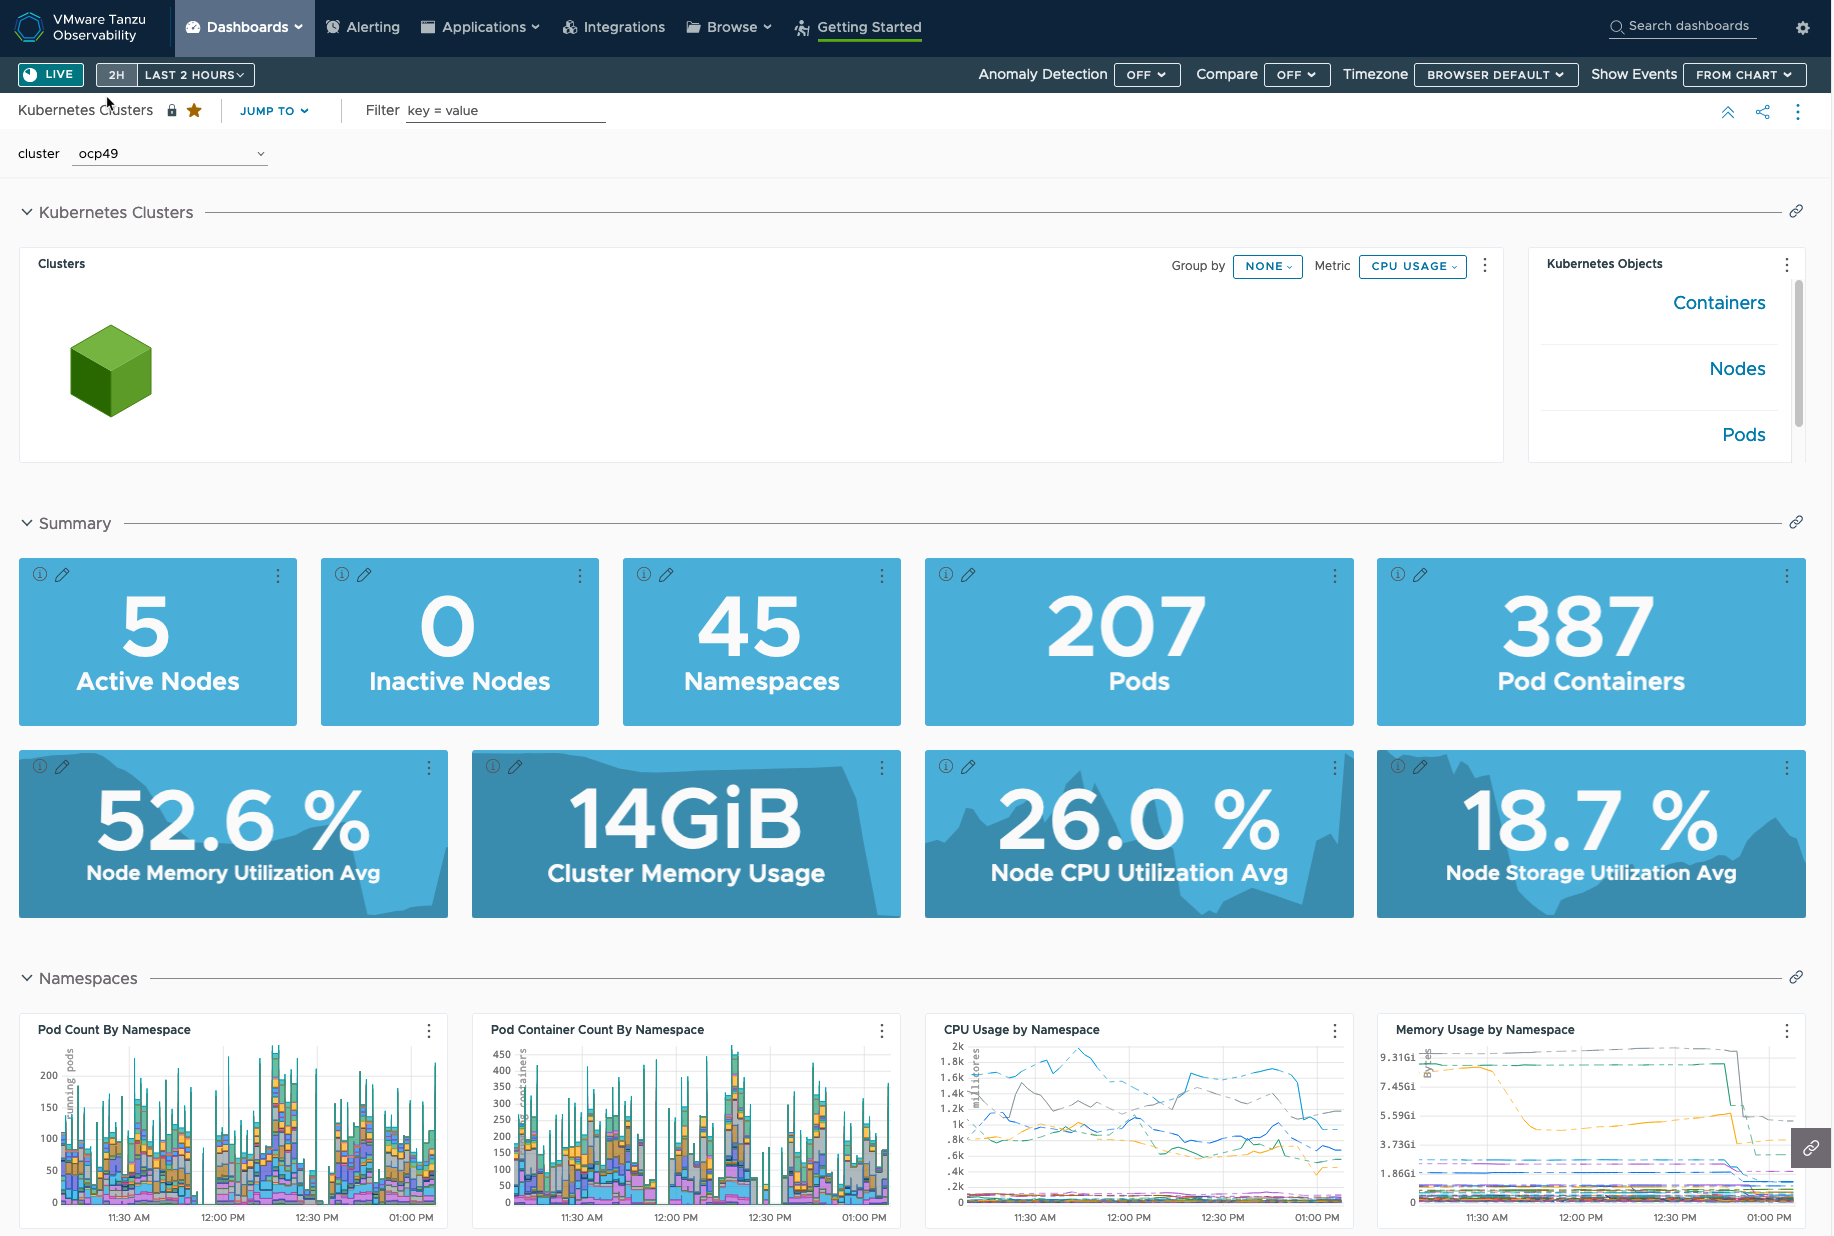
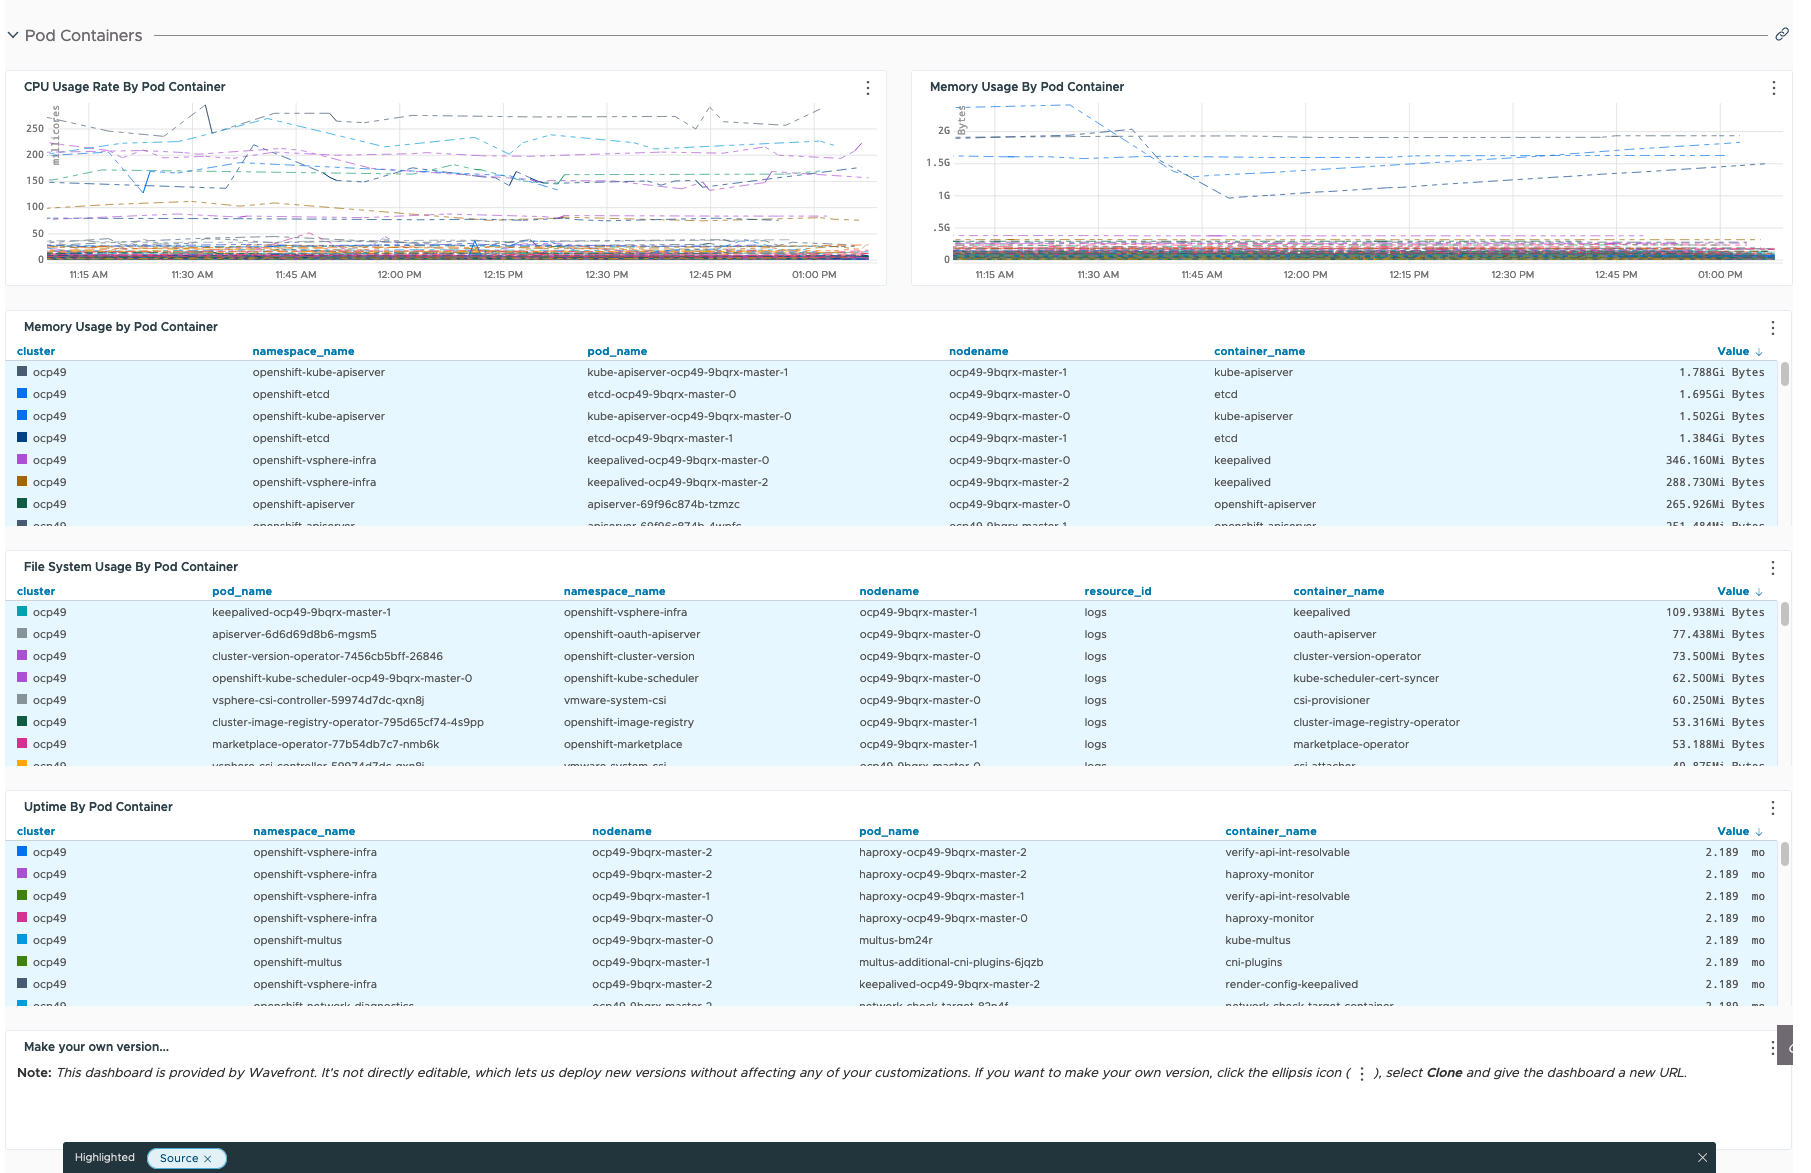
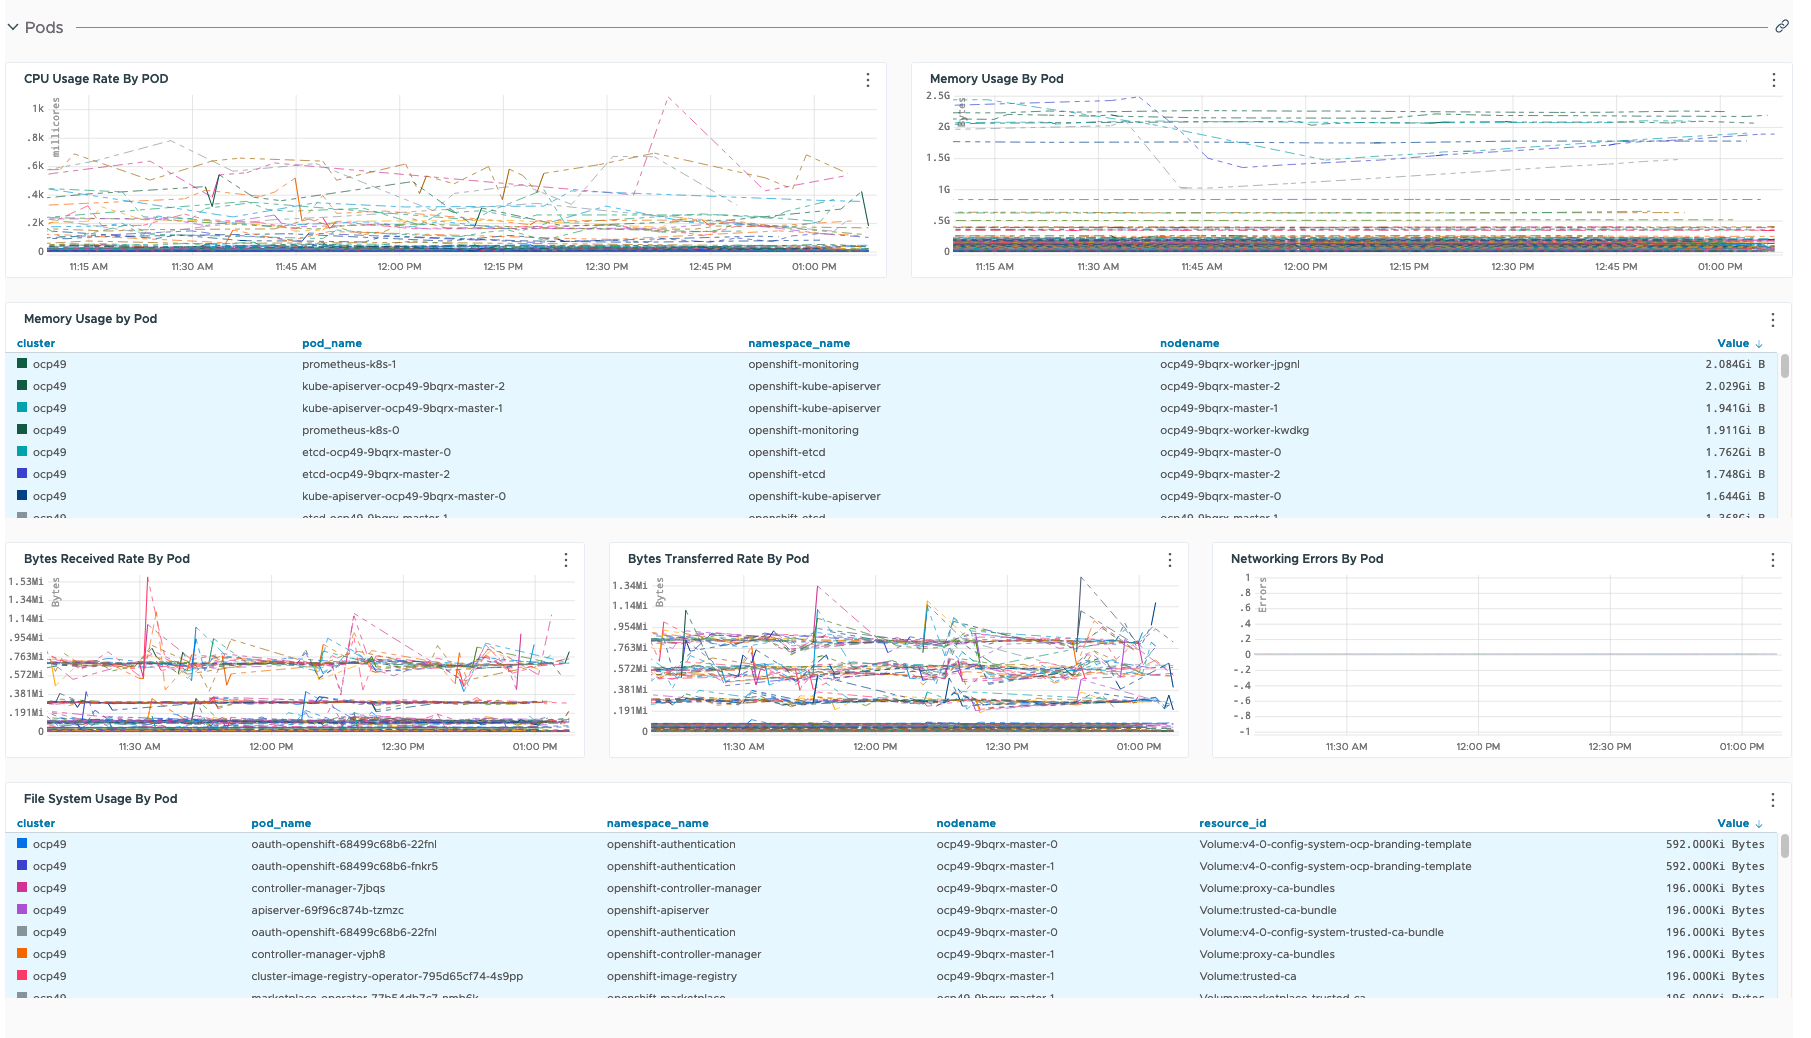
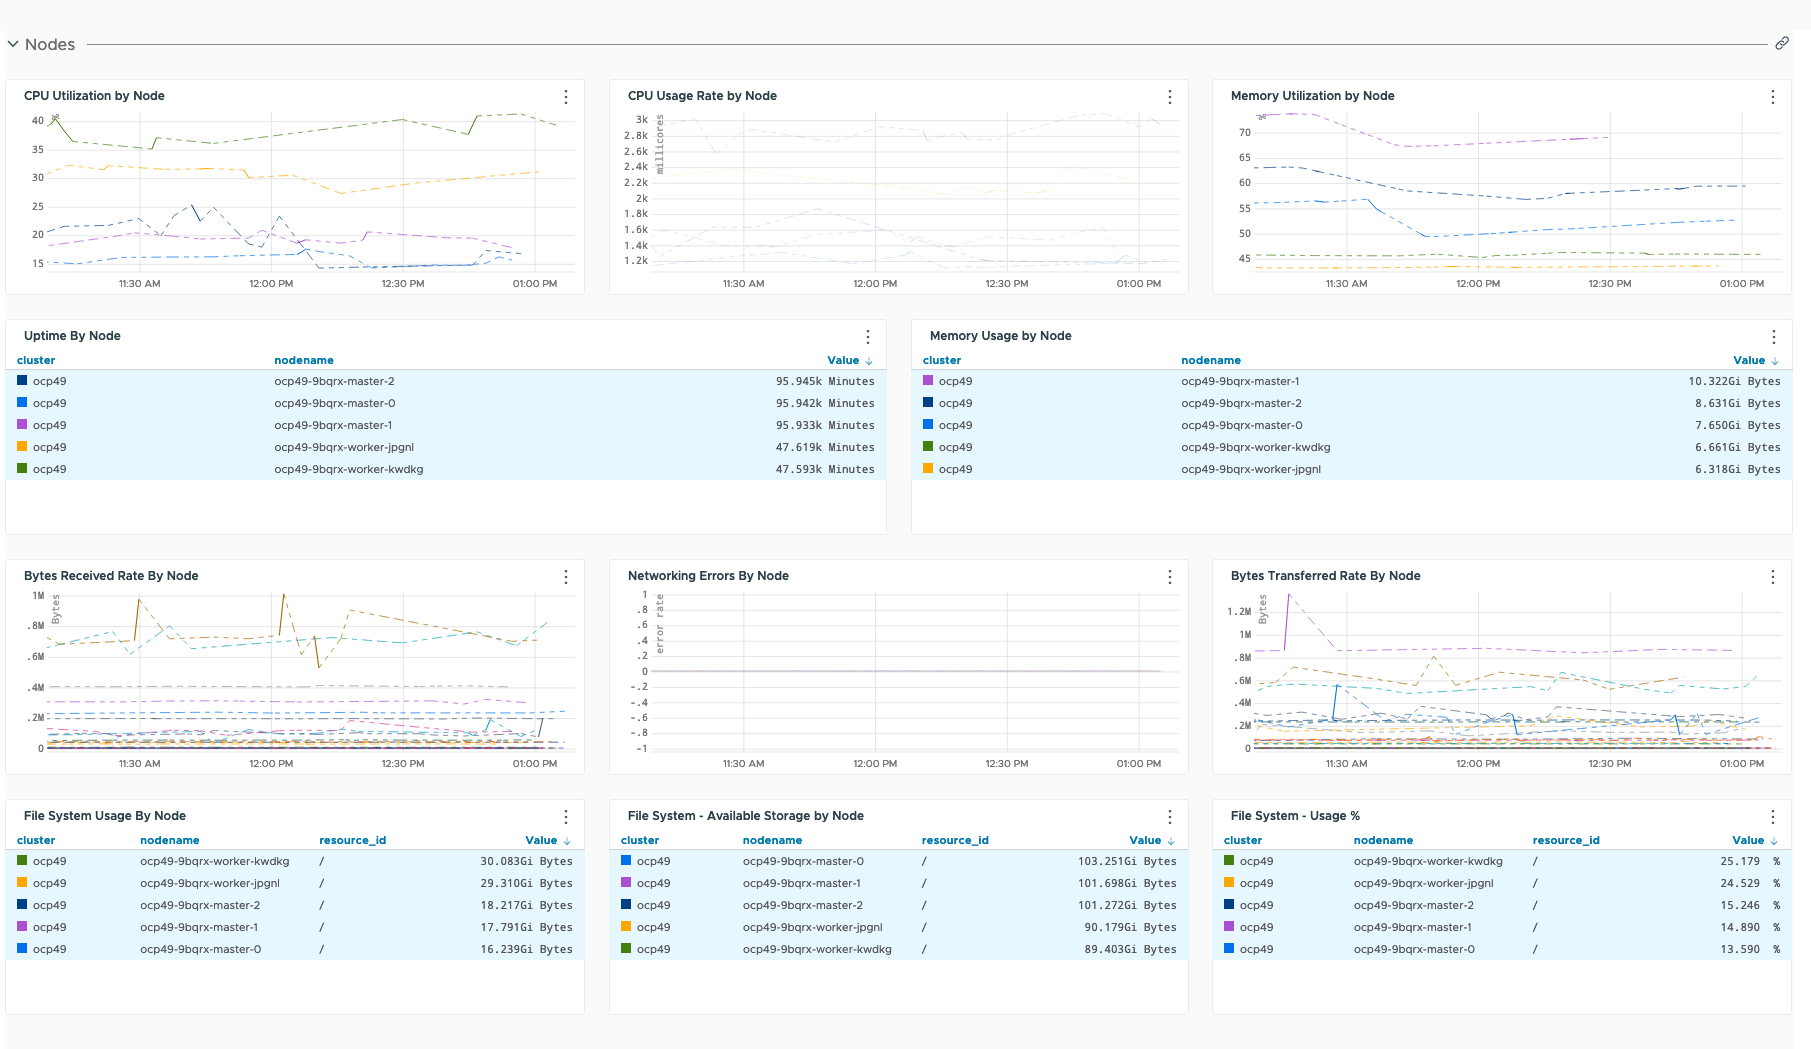
I’m not going to explain all the Kubernetes dashboards in any detail, but out of the box you get a lot of information, below is the Cluster dashboard in full for one of my clusters.
Creating my own dashboard showing an OpenShift’s nodes Kubernetes and vSphere Metrics
I’m going to use some of the existing charts and metric data that is used for Kubernetes (OpenShift) nodes for a custom dashboard.
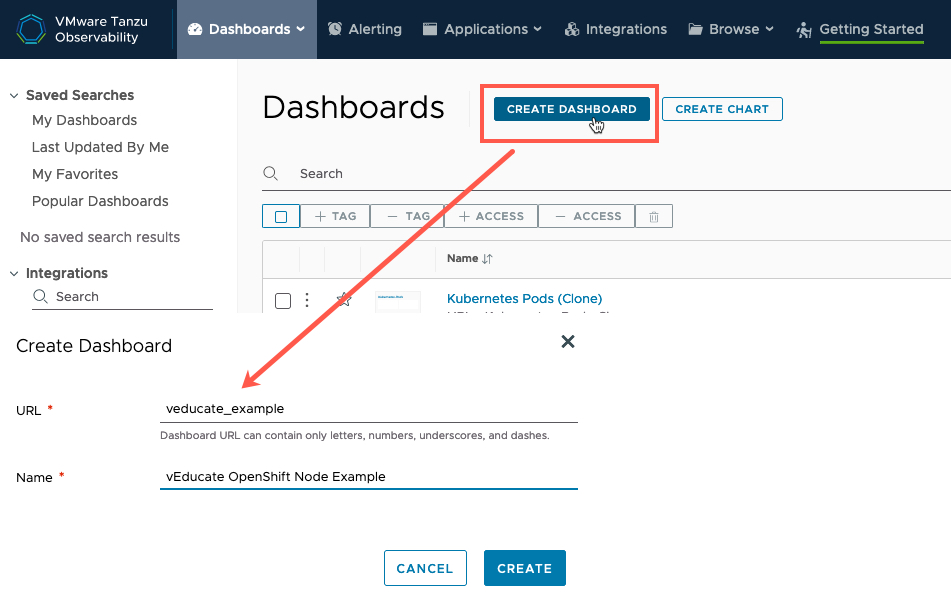
You can create a dashboard under the Dashboard tab.
Instead, I’ve cloned the dashboard “Kubernetes – Nodes” as this has a lot of what I need.
Once I’ve loaded my existing cloned dashboard, I select the edit button from the top right three-dots settings button.
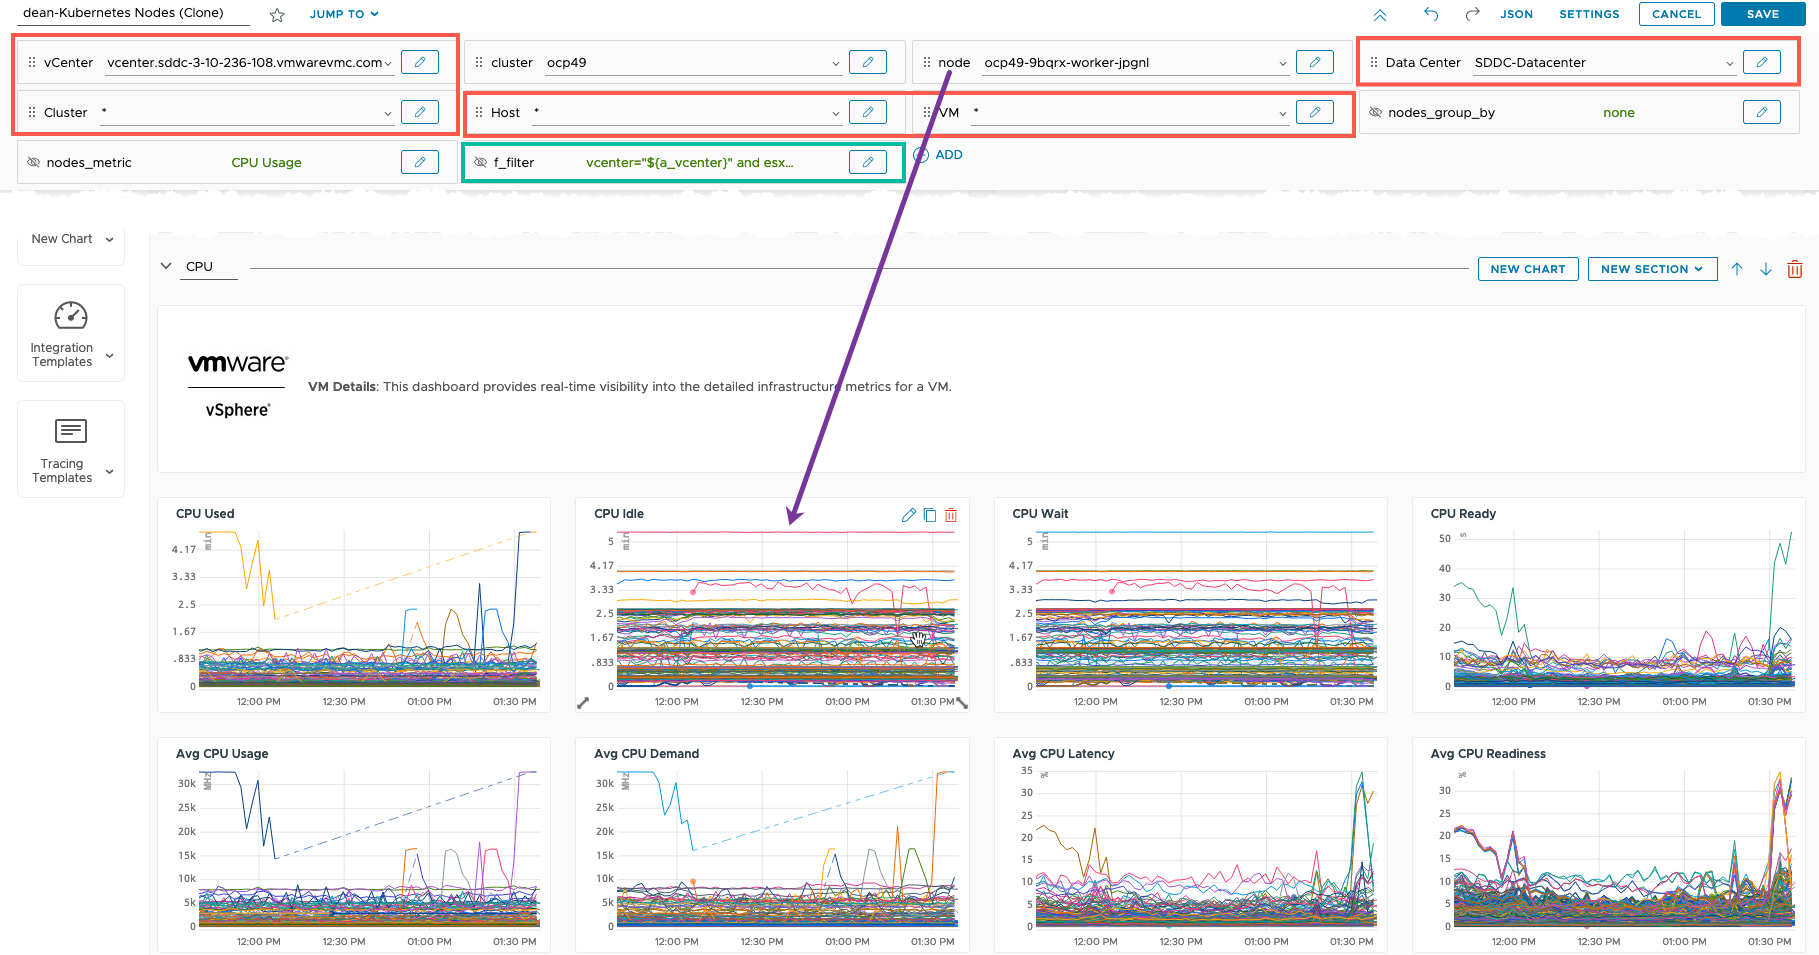
Along the top row (in the above image), I can see all the “variables” used to drive the data in the dashboard, such as “cluster” this can be a list of sources and filters. You can edit these, and drag them to control the order when they are showed to an end user who consumes the dashboard, or hide them completely.
Next, I am going to delete a section and the associated charts. As I don’t want the summary data.
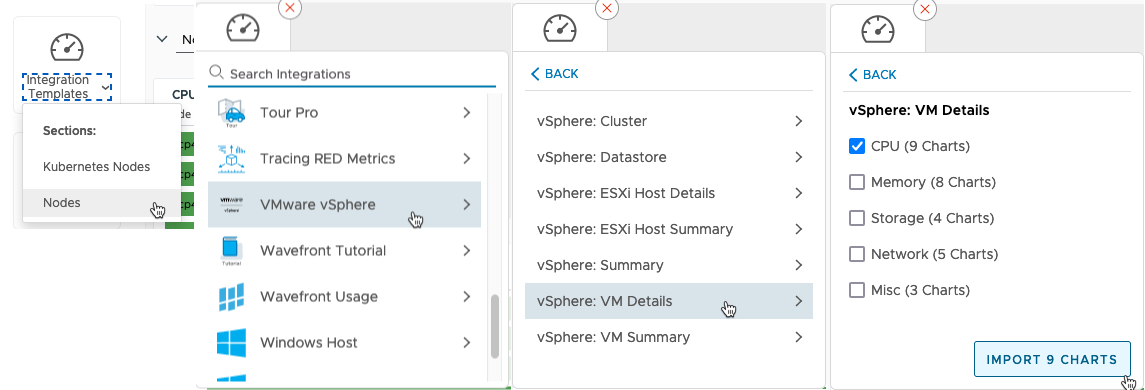
Now I want to bring in the vSphere data, in particular the CPU data for the nodes. Tanzu Observability has the great feature, that I can just pull all these settings and configurations from the existing integration dashboards.
- On the left-hand side, select Integration Templates
- Select which section to add it under
- Search and find your integration data
Now we can see a new Section of the vSphere data, and new variables added to our Dashboard, used to select the data. (Red Boxes).
The issue we have now is that even though a Kubernetes node name is selected, it doesn’t match the filter used for the CPU data, so the charts for vSphere CPU show all VMs.
To fix this, we will edit the filter used for the vSphere charts (Green Box).
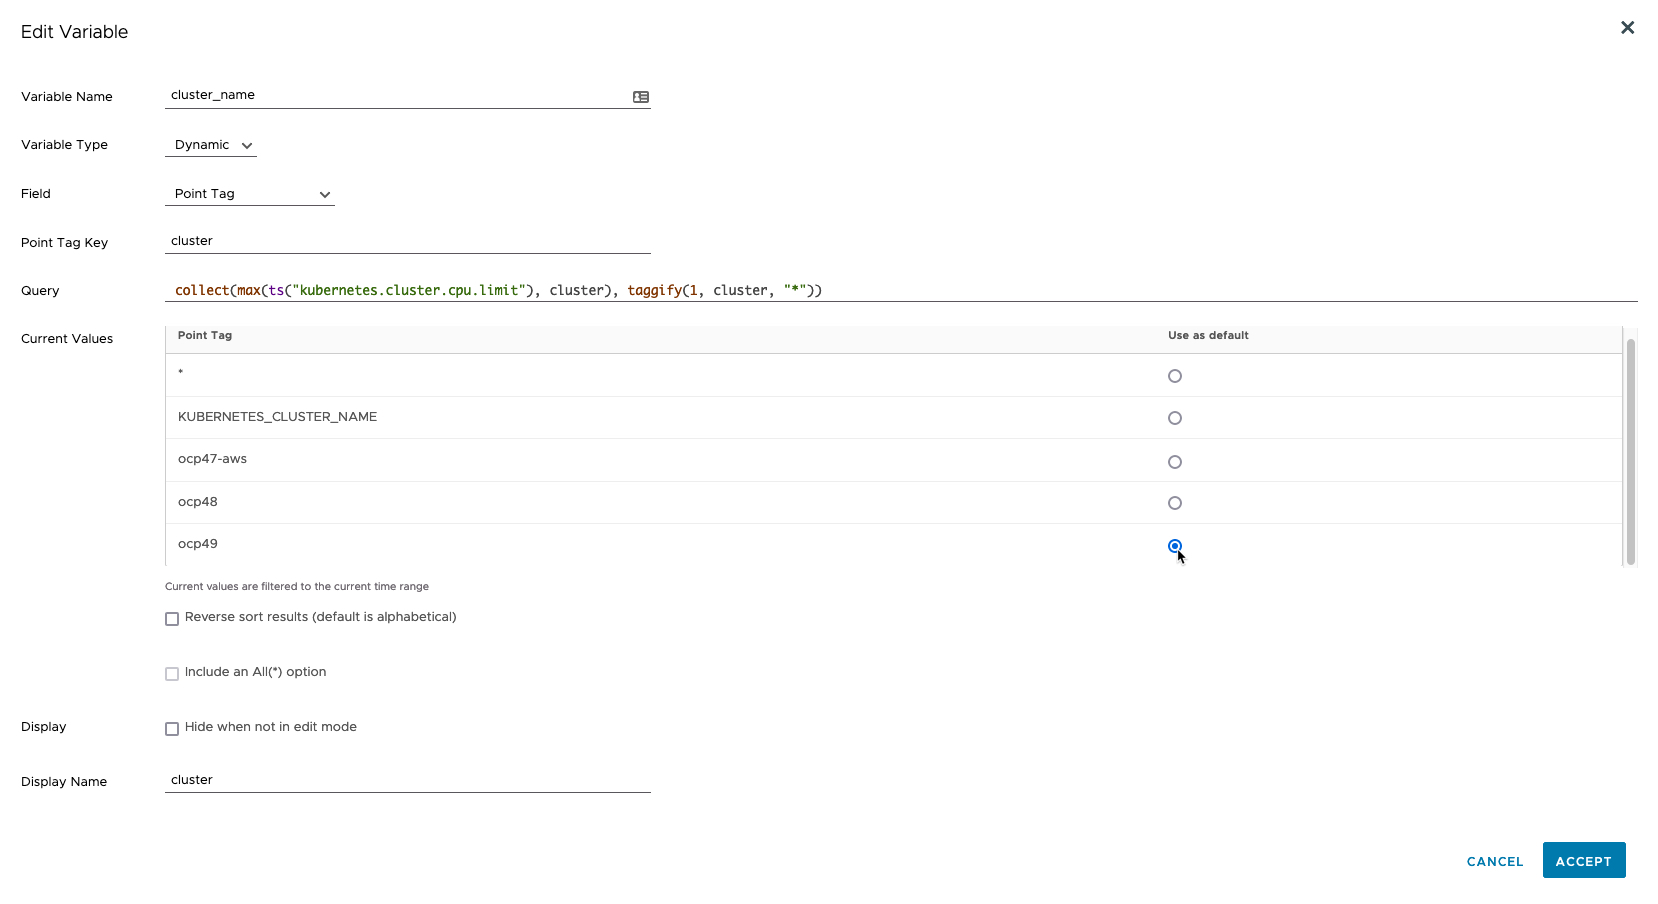
Below in the edit variable screen, I’ve changed the vnname value to match the input of “node_name” which is the variable name used for the filter of Kubernetes node.
Meaning the names will now match.
I’ve also selected to hide this variable from the end user, as well as the rest of the vSphere ones such as vCenter.
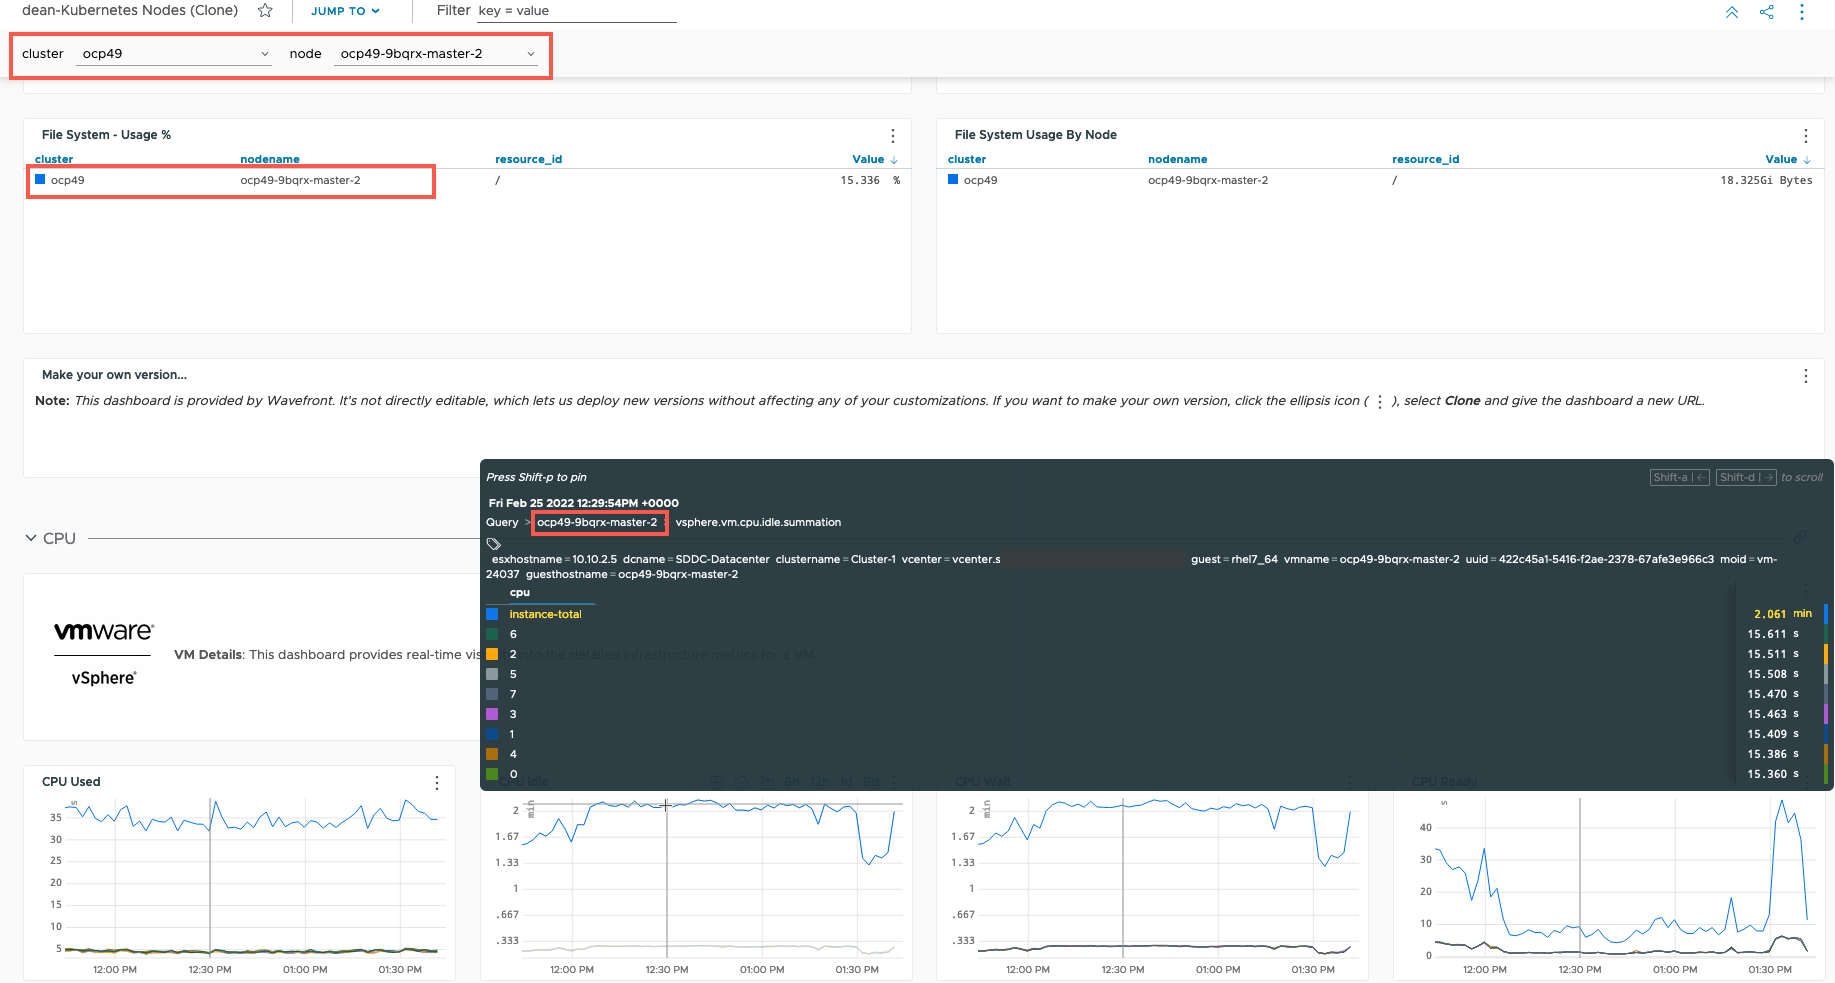
Below is my working dashboard, you can see I’ve selected the Kubernetes node, and now all data is filtered for that node, including the vSphere CPU information.
Wrap-up and Resources
Getting Tanzu Observability to collect data from various systems is really quick and simple, and the inbuilt help guides are fantastic.
Once you have data, the world is your oyster, the out-of-the-box dashboards cover my own needs. But hopefully you could see I quickly was able to create a custom dashboard too.
Now if you want to dive into something more complex, then you can create your own charts using various query language, and the product is very extensibility to show
I recommend these resources so you can dig into Tanzu Observability further:
- Recording – Advanced Observability for RedHat OpenShift 4 with VMware Tanzu
- Whitepaper – Observability for Modern Application Platforms
- Blog
- Tanzu Observability Brings Full-Stack Monitoring of Kubernetes Clusters for OpenShift
- Using VMware Cloud on AWS? Now You Can See Everything with Tanzu Observability
- Getting Started with OpenTelemetry and VMware Tanzu Observability
- The Ultimate Beginner’s Guide for How to Create a Wavefront Dashboard
- Official Docs
Regards
