In this blog post, I have collected together a number of tips, tricks and snippets I’ve learned along the away whilst learning Kubernetes.
- Configure tab completion
- Selecting all namespaces in commands
- Restarting nodes
- Setting default storage class
- Resource usage
- Delete pods that are stuck terminating
- Using the watch command
- Troubleshooting
- - Run an interactive pod for debugging issues
- - - Alpine & BusyBox
- - Check etcd is running on master nodes
- - Get deployed pod image
- - Get Kubelet Service Logs
- - Get events from all namespaces, sorted by creation time
- Other Resources
- - Visual guide on troubleshooting Kubernetes deployments
- - Tool: Stern for tailing multiple Kubernetes objects logs
- - Useful Aliases to create for managing Kubernetes
I would also highly recommend the awesome Kubectl Cheat Sheet to be one of your go to references.
Configure Tab completion
source <(kubectl completion bash)
Selecting all name spaces in commands
rather than using “–all-namespaces” you can use “-A”
kubectl get pods --all-namespaces

kubectl get pods -A
Restarting Nodes
SSH to problematic node and run
/etc/init.d/kubelet restart
Setting default storage class
Remove default storage class setting
kubectl patch storageclass {SC_NAME} -p '{"metadata": {"annotations":{"storageclass.kubernetes.io/is-default-class":"false"}}}'
Configure storage class as default
kubectl patch storageclass {SC_NAME} -p '{"metadata": {"annotations":{"storageclass.kubernetes.io/is-default-class":"true"}}}'
Resource Usage
Requires metrics-server to be installed and running (github)
Pods;
#Check what pods are using the most memory in the cluster:
kubectl top pod --all-namespaces  | sort -rnk4 | head -40

#Check what pods are using the most CPU in the cluster:
kubectl top pod --all-namespaces  | sort -rnk3 | head -80
Nodes;
#Check which nodes are using the most memory in the cluster:
kubectl top nodes --all-namespaces  | sort -rnk4 | head -40

#Check which nodes are using the most CPU in the cluster:
kubectl top nodes --all-namespaces  | sort -rnk3 | head -80
Verify Kubelet is exposing Node metrics;
kubectl get --raw /api/v1/nodes/{Node_Name}/proxy/stats/summary
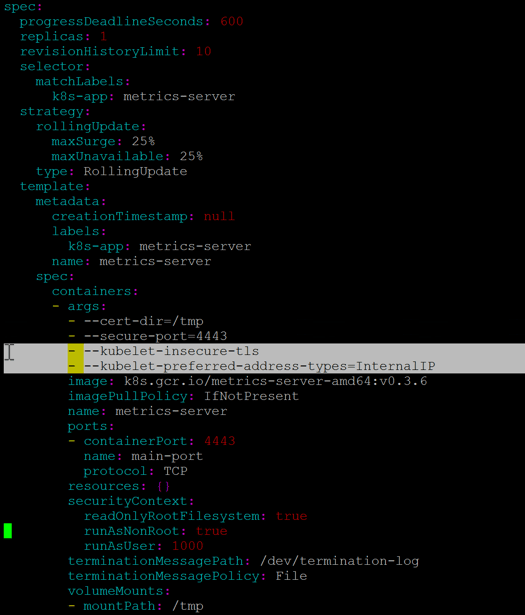
To get kube-metrics working I had to add the following to the deployment. (Highlighted in bold).
kubectl edit deployment metrics-server -n kube-system
#############
name: metrics-server
spec:
containers:
- args:
 - --kubelet-preferred-address-types=InternalIP
 - --kubelet-insecure-tls
Delete pods that are stuck terminating
kubectl get pods --all-namespaces | grep Terminating | while read line; do pod_name=$(echo $line | awk '{print $2}') && name_space=$(echo $line | awk '{print $1}' ); kubectl delete pods $pod_name -n $name_space --grace-period=0 --force ; done
Using the Watch command
Really simple one, but when deploying things, sometimes you don’t the feedback you need from the system. However using the Linux watch command infront of your Kubernetes commands, you can;
watch -n 2 kubectl get pods -n {namespace}
In the above example, this command will refresh your page every 2 seconds and list out the available pods and status.
Troubleshooting:
Run an interactive pod for debugging
This will create a pod of one of the below images, which will be removed when you exit out of the session.
Apline;
kubectl run -i --rm -t alpine-$USER --image=alpine --restart=Never -- /bin/sh

Press enter
BusyBox
kubectl run -i --tty --rm debug --image=busybox --restart=Never -- sh

Press enter
Check etcd is running on master nodes
Check etcd pods have been created by Kubelet
sudo crictl pods --name=etcd-member

or

sudo crictl ps -A
Check etcd logs on master nodes
sudo crictl logs $(sudo crictl ps --pod=$(sudo crictl pods --name=etcd-member --quiet) --quiet)
Get pod deployed image
Kubectl get pod {name} -n {namespace} -o "jsonpath={range .status.containerStatuses[*]}{.name}{'\t'}{.state}{'\t'}{.image}{'\n'}{end}"

Example:

root@k8s-master# kubectl get pods nginx -o "jsonpath={range .status.containerStatuses[*]}{.name}{'\t'}{.state}{'\t'}{.image}{'\n'}{end}"

nginx map[running:map[startedAt:2020-06-10T15:44:40Z]] nginx:latest
Get Kubelet Service logs
SSH to your node and run the following
journalctl -f -u kubelet.service
Get events from all namespaces, sorted by creation time
kubectl get events -A --sort-by='.metadata.creationTimestamp'
Other Resources
A visual guide on troubleshooting Kubernetes deployments
Tool: Stern allows you to tail multiple pods on Kubernetes and multiple containers within the pod. Each result is colour coded for quicker debugging.
This can be more useful than the Kubectl logs command, which you need to know your individual pods name.
Tail logs of all pods of the deployment/service
 CMD: stern -n {Namespace} {deployment}

Same as above but starting with logs in the last minute
 CMD: stern -n {Namespace} {deployment} -s 1m
Useful Alias, can be used without ZSH
Regards


