Tag Archives: Observability

Kubernetes Header Image

Highlight Kubernetes Labels in your Terminal with AWK

A quick tip and bit of code: if you’re outputting a lot of Kubernetes metadata using the --show-labels command, it can feel like looking for a needle in a haystack. The snippet below colorizes key label outputs to make them stand out.

The Code Snippet

When working with Kubernetes, it can be helpful to visually scan for certain node labels—such as service.cilium.io/node=... or custom readiness flags like ingress-ready=true. Using a simple awk script, we can colorize these labels directly in our terminal output. This script uses ANSI escape codes to wrap matched text in color and awk’s gsub() function to apply substitutions line by line. It’s a lightweight and effective way to highlight key data points in otherwise dense CLI output.

kubectl get ciliumnodes --show-labels | awk '
BEGIN {
  color_start = "\033[1;36m"; # cyan
  color_end = "\033[0m";
}
{
  gsub(/service\.cilium\.io\/node=[^, ]+/, color_start "&" color_end);
  gsub(/ingress-ready=true/, color_start "&" color_end);
  print
}'

Screenshot Example


Screenshot showing the use of an awk command to color-highlight the ingress-ready=true label in red within kubectl get ciliumnodes --show-labels output in a Kubernetes terminal session.

Breakdown of the Code

We pipe the output of the kubectl command to awk. The BEGIN block sets up the ANSI color codes used for matching patterns.

  • \033[1;36m is an ANSI escape code that starts cyan-colored text.
  • \033[0m resets the text color back to normal.

gsub(...)

These two lines apply substitutions to each input line:

  • gsub() is a global substitution function that replaces all matches in the line.
    • service\.cilium\.io\/node=[^, ]+ matches a full key-value pair like service.cilium.io/node=mynode
    • [^, ]+ grabs the node value until the next comma or space
    • ingress-ready=true matches the exact label string
    • & refers to the entire matched string, which we wrap in color codes

print

This prints the modified line after substitutions are applied.

Customize the Highlight Color

You can change \033[1;36m to another color code:

  • Red: \033[1;31m
  • Green: \033[1;32m
  • Yellow: \033[1;33m
  • Blue: \033[1;34m
  • Magenta: \033[1;35m

A Final Note on sub() vs gsub()

  • sub() replaces only the first occurrence of the regex in the line
  • gsub() replaces all occurrences of the regex in the line

Regards

Bluesky Icon
Follow me on Bluesky

Dean Lewis

Tanzu Observability Header

Tanzu Observability – First look at monitoring OpenShift & VMware Cloud on AWS

Recently, I was involved in some work to assist the VMware Tanzu Observability team to assist them in updating their deliverables for OpenShift. Now it’s generally available, I found some time to test it out in my lab.

For this blog post, I am going to pull in metrics from my VMware Cloud on AWS environment and the Red Hat OpenShift Cluster which is deployed upon it.

What is Tanzu Observability?

We should probably start with what is Observability, I could re-create the wheel, but instead VMware has you covered with this helpful page.

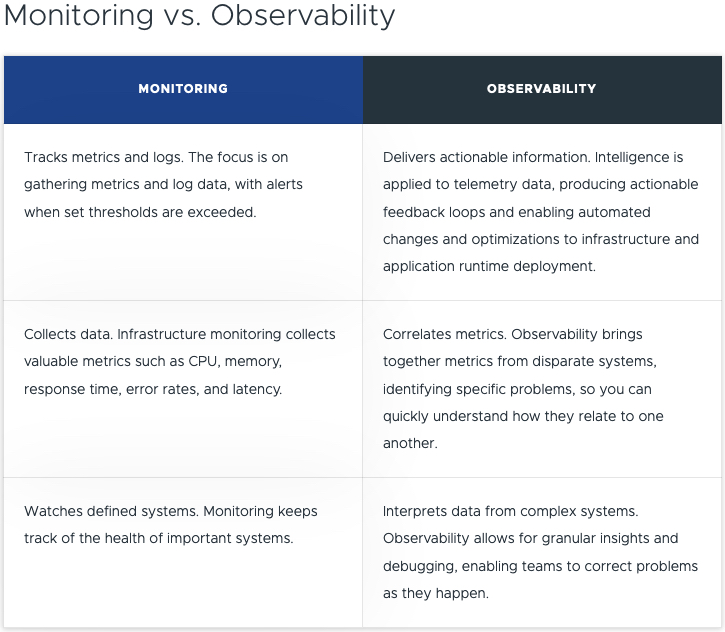
Below is the shortened table comparison.

Monitoring vs. Observability

As a developer you want to focus on developing the application, but you also do need to understand the rest of the stack to a point. In the middle, you have a Site Reliability Engineer (SRE), who covers the platform itself, and availability to ensure the app runs as best it can. And finally, we have the platform owner, where the applications and other services are located.

Somewhere in the middle, when it comes to tooling, you need to cover an example of the areas listed below:

  • Application Observability & Root Cause Analysis
    • App-aware Troubleshooting & Root Cause Analysis
  • Distributed Tracing
  • CI/CD Monitoring
  • Analytics with Query Language and high reliability, granularity, cardinality, and retention
  • Full-Stack Apps & Infra Telemetry as a Service
  • Infra Monitoring
    • Performance Optimization
    • Capacity and Cost Optimization
    • Configuration and Compliance

So now you are thinking, OK, but VMware has vRealize Operations that gives me a lot of data, so why is there a new product for this?

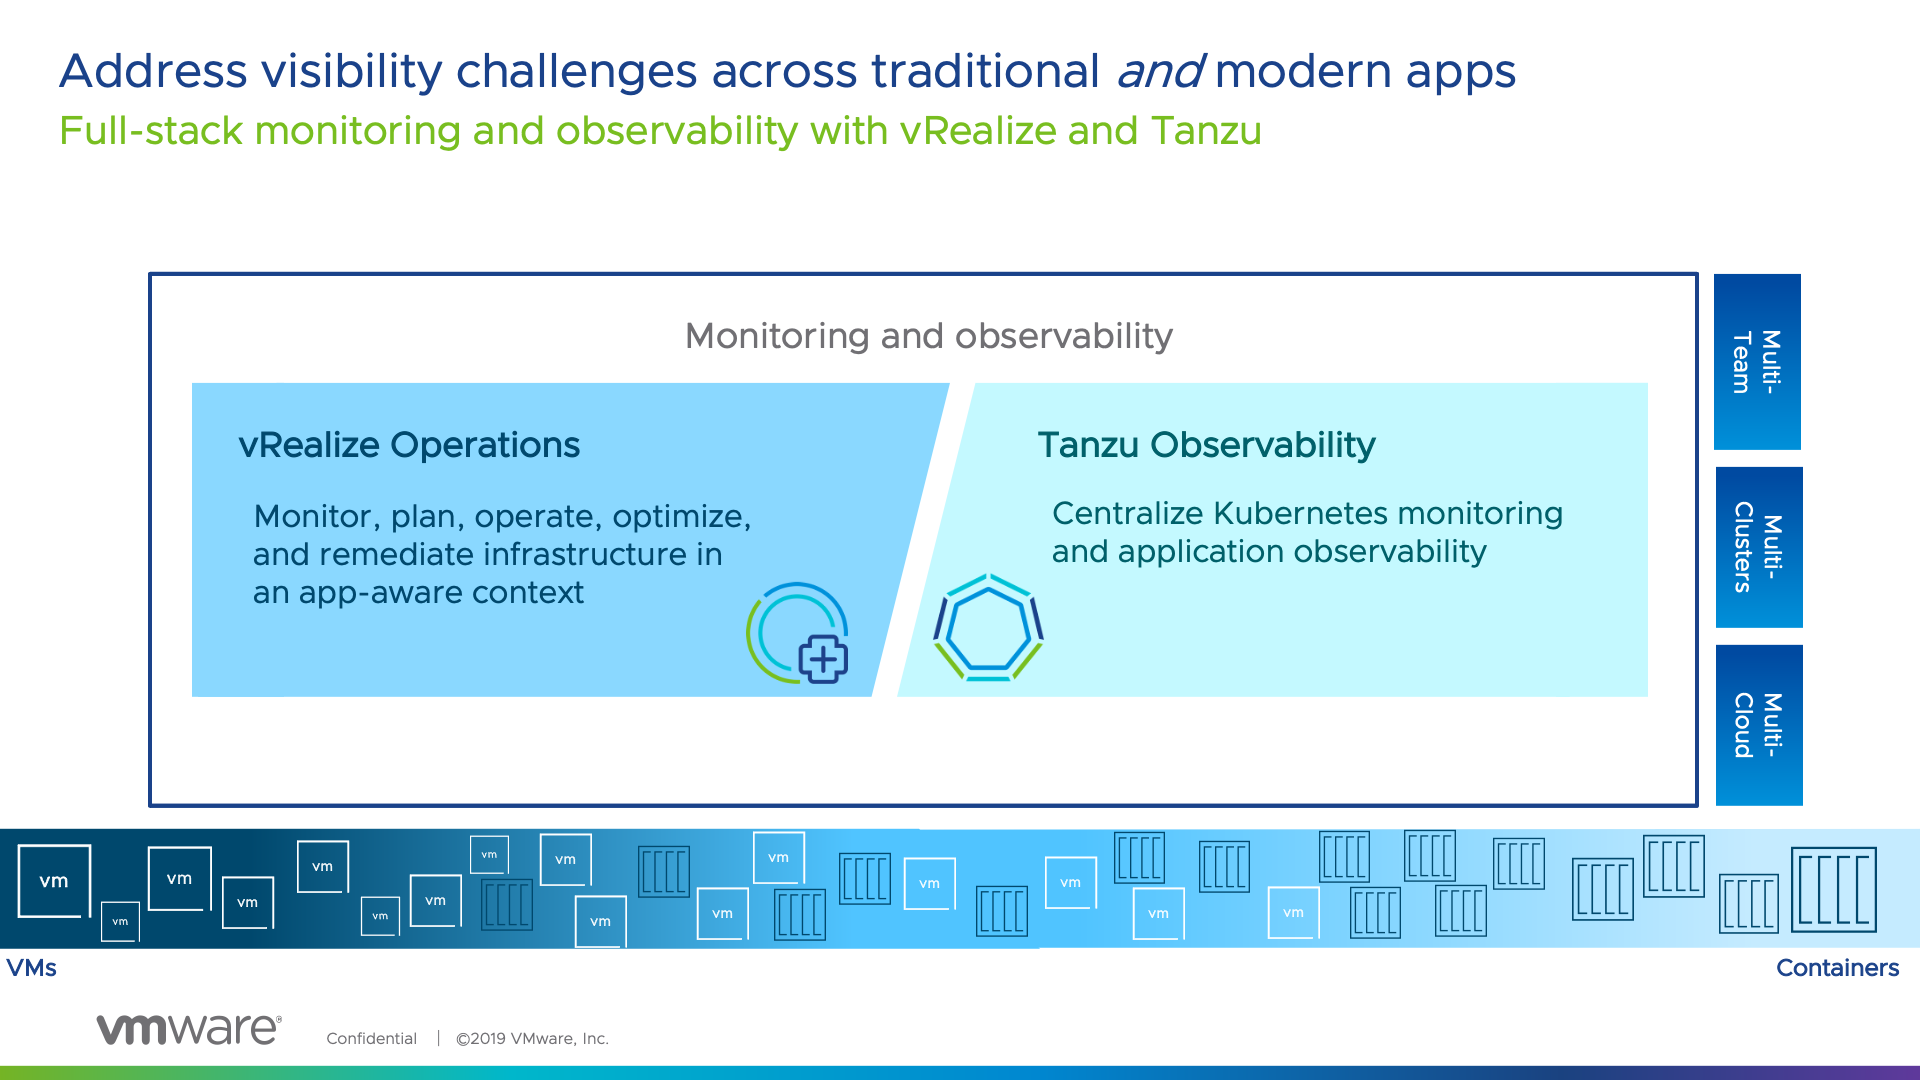
vRealize Operations and Tanzu Observability come together – delivering full stack monitoring and observability from both the infra-up and app-down perspective, equipping both teams in the org to meet common goals.

Monitoring & Observability

It is about the right tool for the right team and bringing together harmony between them. Which is why at VMware, the focus has been on covering the needs of team across the two products.

vRealize Operations is going to give you SLA metrics for your infrastructure and even application awareness. However Tanzu Observability brings more application focused features to allow you as a business, report on Application Experience of your end users/customers, at an SLA/SLO/KPI approach with extensibility to provide an Experience Level Agreement (XLA) type capability.

VMware Tanzu Observability by Wavefront delivers enterprise-grade observability and analytics at scale. Monitor everything from full-stack applications to cloud infrastructures with metrics, traces, event logs, and analytics.

High level features include:

To follow this blog, you can also easily get yourself access to Tanzu Observability.

Configuring data ingestion into Tanzu Observability using the native integrations

Configuring the OpenShift (Kubernetes) Integration using Helm

First, we need to create an API Key that we can use to connect our locally deployed wavefront services to the SaaS service to send data. Continue reading Tanzu Observability – First look at monitoring OpenShift & VMware Cloud on AWS