Tag Archives: VMC

VMC Tanzu Header

VMware Cloud on AWS – Managed Tanzu Kubernetes Grid with Tanzu Mission Control
In my previous blog post, I detailed a full end to end guide in deploying and configurating the managed Tanzu Kubernetes Service offering as part of VMware Cloud on AWS (VMC), finishing with some example application deployments and configurations.

In this blog post, I am moving on to show you how to integrate this environment with Tanzu Mission Control, which will provide fleet management for your Kubernetes instances. I’ve wrote several blog posts on TMC previous which you can find below:

Tanzu Mission Control 
- Getting Started Tanzu Mission Control 
- Cluster Inspections 
- Workspaces and Policies  
- Data Protection 
- Deploying TKG clusters to AWS 
- Upgrading a provisioned cluster 
- Delete a provisioned cluster 
- TKG Management support and provisioning new clusters
- TMC REST API - Postman Collection
- Using custom policies to ensure Kasten protects a deployed application
Management with Tanzu Mission Control

The first step is to connect the Supervisor cluster running in VMC to our Tanzu Mission Control environment.

Connecting the Supervisor Cluster to TMC

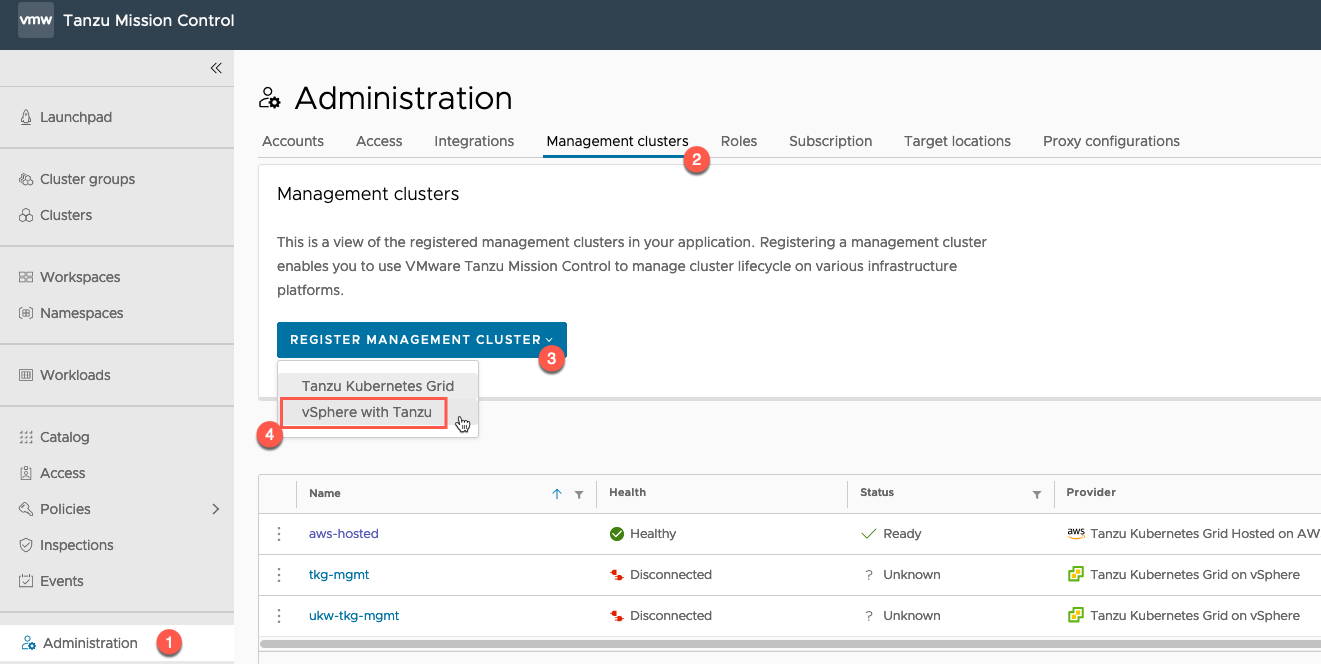
Within the TMC console, go to:

  • Administration
  • Management Clusters
  • Register Management Cluster
    • Select “vSphere with Tanzu”

Managed Tanzu Kubernetes Service - VMC - TMC - Register Management Cluster

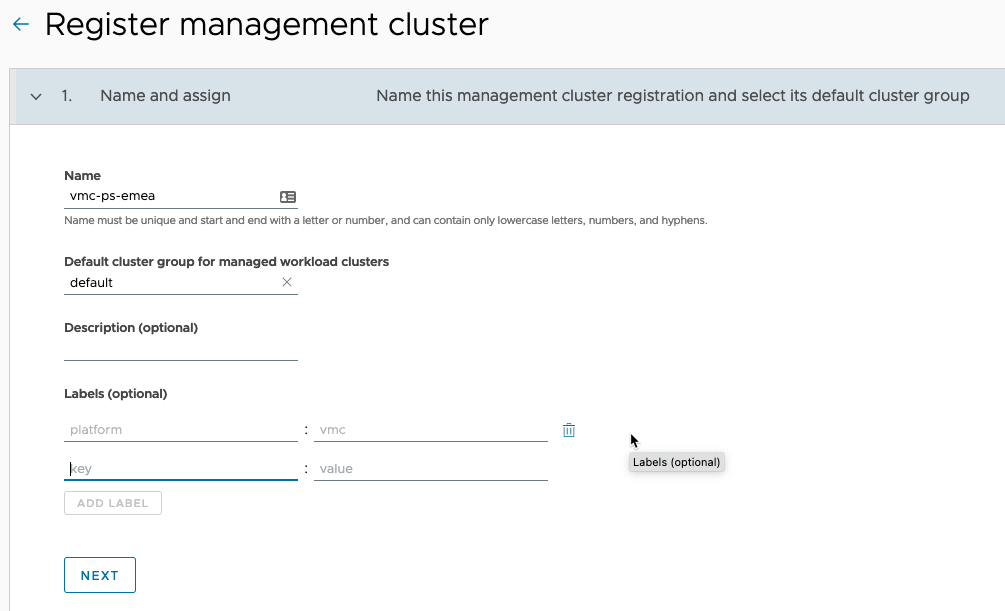
On the Register Management Cluster page:

  • Set the friendly name for the cluster in TMC
  • Select the default cluster group for managed workload clusters to be added into
  • Set any description and labels as necessary

Managed Tanzu Kubernetes Service - VMC - TMC - Register Management Cluster - Name and Assign

  • Proxy settings for a Supervisor Cluster running in VMC are not supported, so ignore Step 2.

Managed Tanzu Kubernetes Service - VMC - TMC - Register Management Cluster - Proxy Configuration

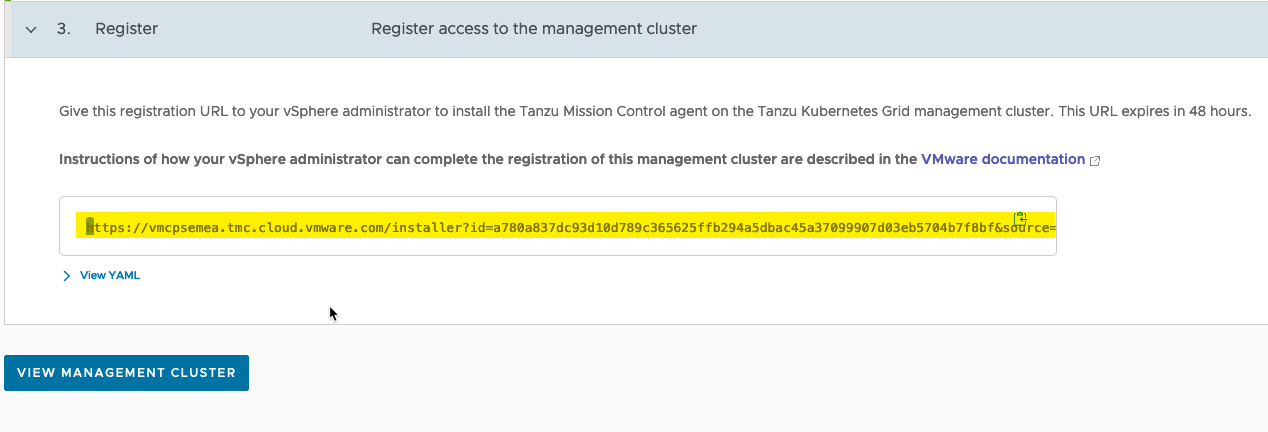
  • Copy the registration URL.

Managed Tanzu Kubernetes Service - VMC - TMC - Register Management Cluster - Register

  • Log into your vSphere with Tanzu Supervisor cluster.
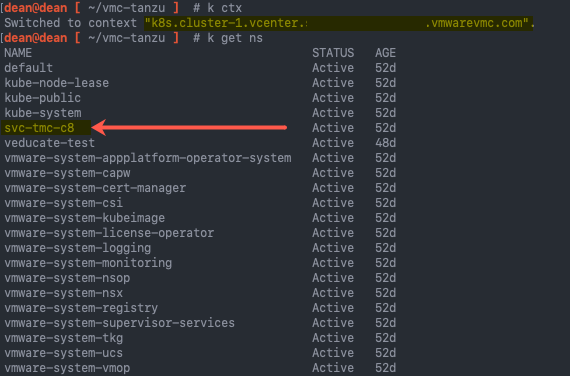
  • Find the namespace that identifies your cluster and is used for TMC configurations, “kubectl get ns”
    • It will start “svc-tmc-xx”
    • Copy this namespace name

Managed Tanzu Kubernetes Service - VMC - TMC - Supervisor Cluster - Kubectl get namespace Continue reading VMware Cloud on AWS – Managed Tanzu Kubernetes Grid with Tanzu Mission Control
VMC Tanzu Header

VMware Cloud on AWS Deep Dive – Activating, Deploying and Using the managed Tanzu Kubernetes Grid Service

In this blog post I’m going to deep dive into the end-to-end activation, deployment, and consuming of the managed Tanzu Services (Tanzu Kubernetes Grid Service > TKGS) within a VMware Cloud on AWS SDDC. I’ll deploy a Tanzu Cluster inside a vSphere Namespace, and then deploy my trusty Pac-Man application and make it Publicly Accessible.

Previously to this capability, you would need to deploy Tanzu Kubernetes Grid to VMC, which was fully supported, as a Management Cluster and then additional Tanzu Clusters for your workloads. (See Terminology explanations here). This was a fully support option, however it did not provide you all the integrated features you could have by using the TKGS as part of your On-Premises vSphere environment.

What is Tanzu Services on VMC?

Tanzu Kubernetes Grid Service is a managed service built into the VMware Cloud on AWS vSphere environment.

This feature brings the availability of the integrated Tanzu Kubernetes Grid Service inside of vSphere itself, by coupling the platform together, you can easily deploy new Tanzu clusters, use the administration and authentication of vCenter, as well as provide governance and policies from vCenter as well.

Note: VMware Cloud on AWS does not enable activation of Tanzu Kubernetes Grid by default. Contact your account team for more information. 

Note2: In VMware Cloud on AWS, the Tanzu workload control plane can be activated only through the VMC Console.
But wait, couldn’t I already install a Tanzu Kubernetes Grid Cluster onto VMC anyway?

Tanzu Kubernetes Grid is a multi-cloud solution that deploys and manages Kubernetes clusters on your selected cloud provider. Previously to the vSphere integrated Tanzu offering for VMC that we are discussing today, you would deploy the general TKG option to your SDDC vCenter.

What differences should I know about this Tanzu Services offering in VMC versus the other Tanzu Kubernetes offering?
  • When Activated, Tanzu Kubernetes Grid for VMware Cloud on AWS is pre-provisioned with a VMC-specific content library that you cannot modify.
  • Tanzu Kubernetes Grid for VMware Cloud on AWS does not support vSphere Pods.
  • Creation of Tanzu Supervisor Namespace templates is not supported by VMware Cloud on AWS.
  • vSphere namespaces for Kubernetes releases are configured automatically during Tanzu Kubernetes Grid activation.
Activating Tanzu Kubernetes Grid Service in a VMC SDDC
Reminder: Tanzu Services Activation capabilities are not activated by default. Contact your account team for more information.

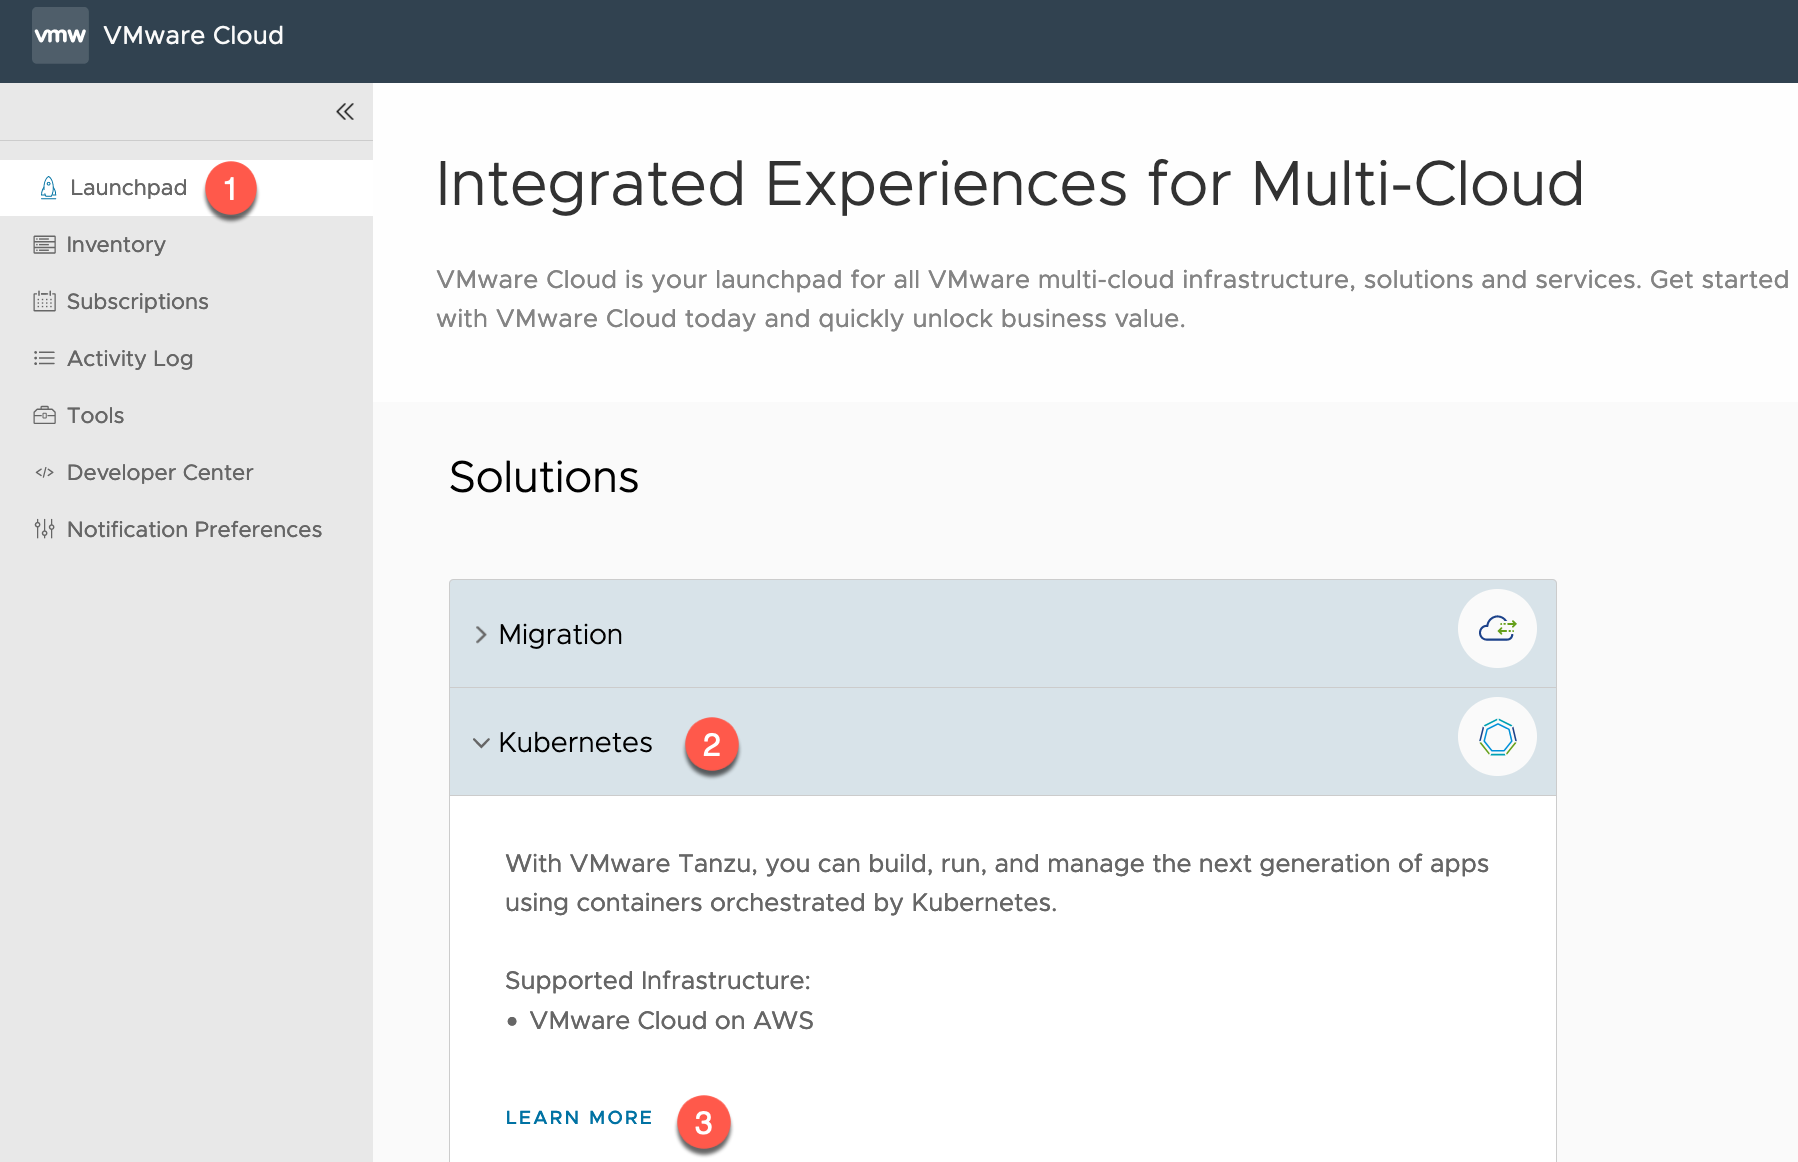
Within your VMC Console, you can either go via the Launchpad method or via the SDDC inventory item. I’ll cover both:

  • Click on Launchpad
  • Open the Kubernetes Tab
  • Click Learn More

VMC - Launchpad - Kubernetes

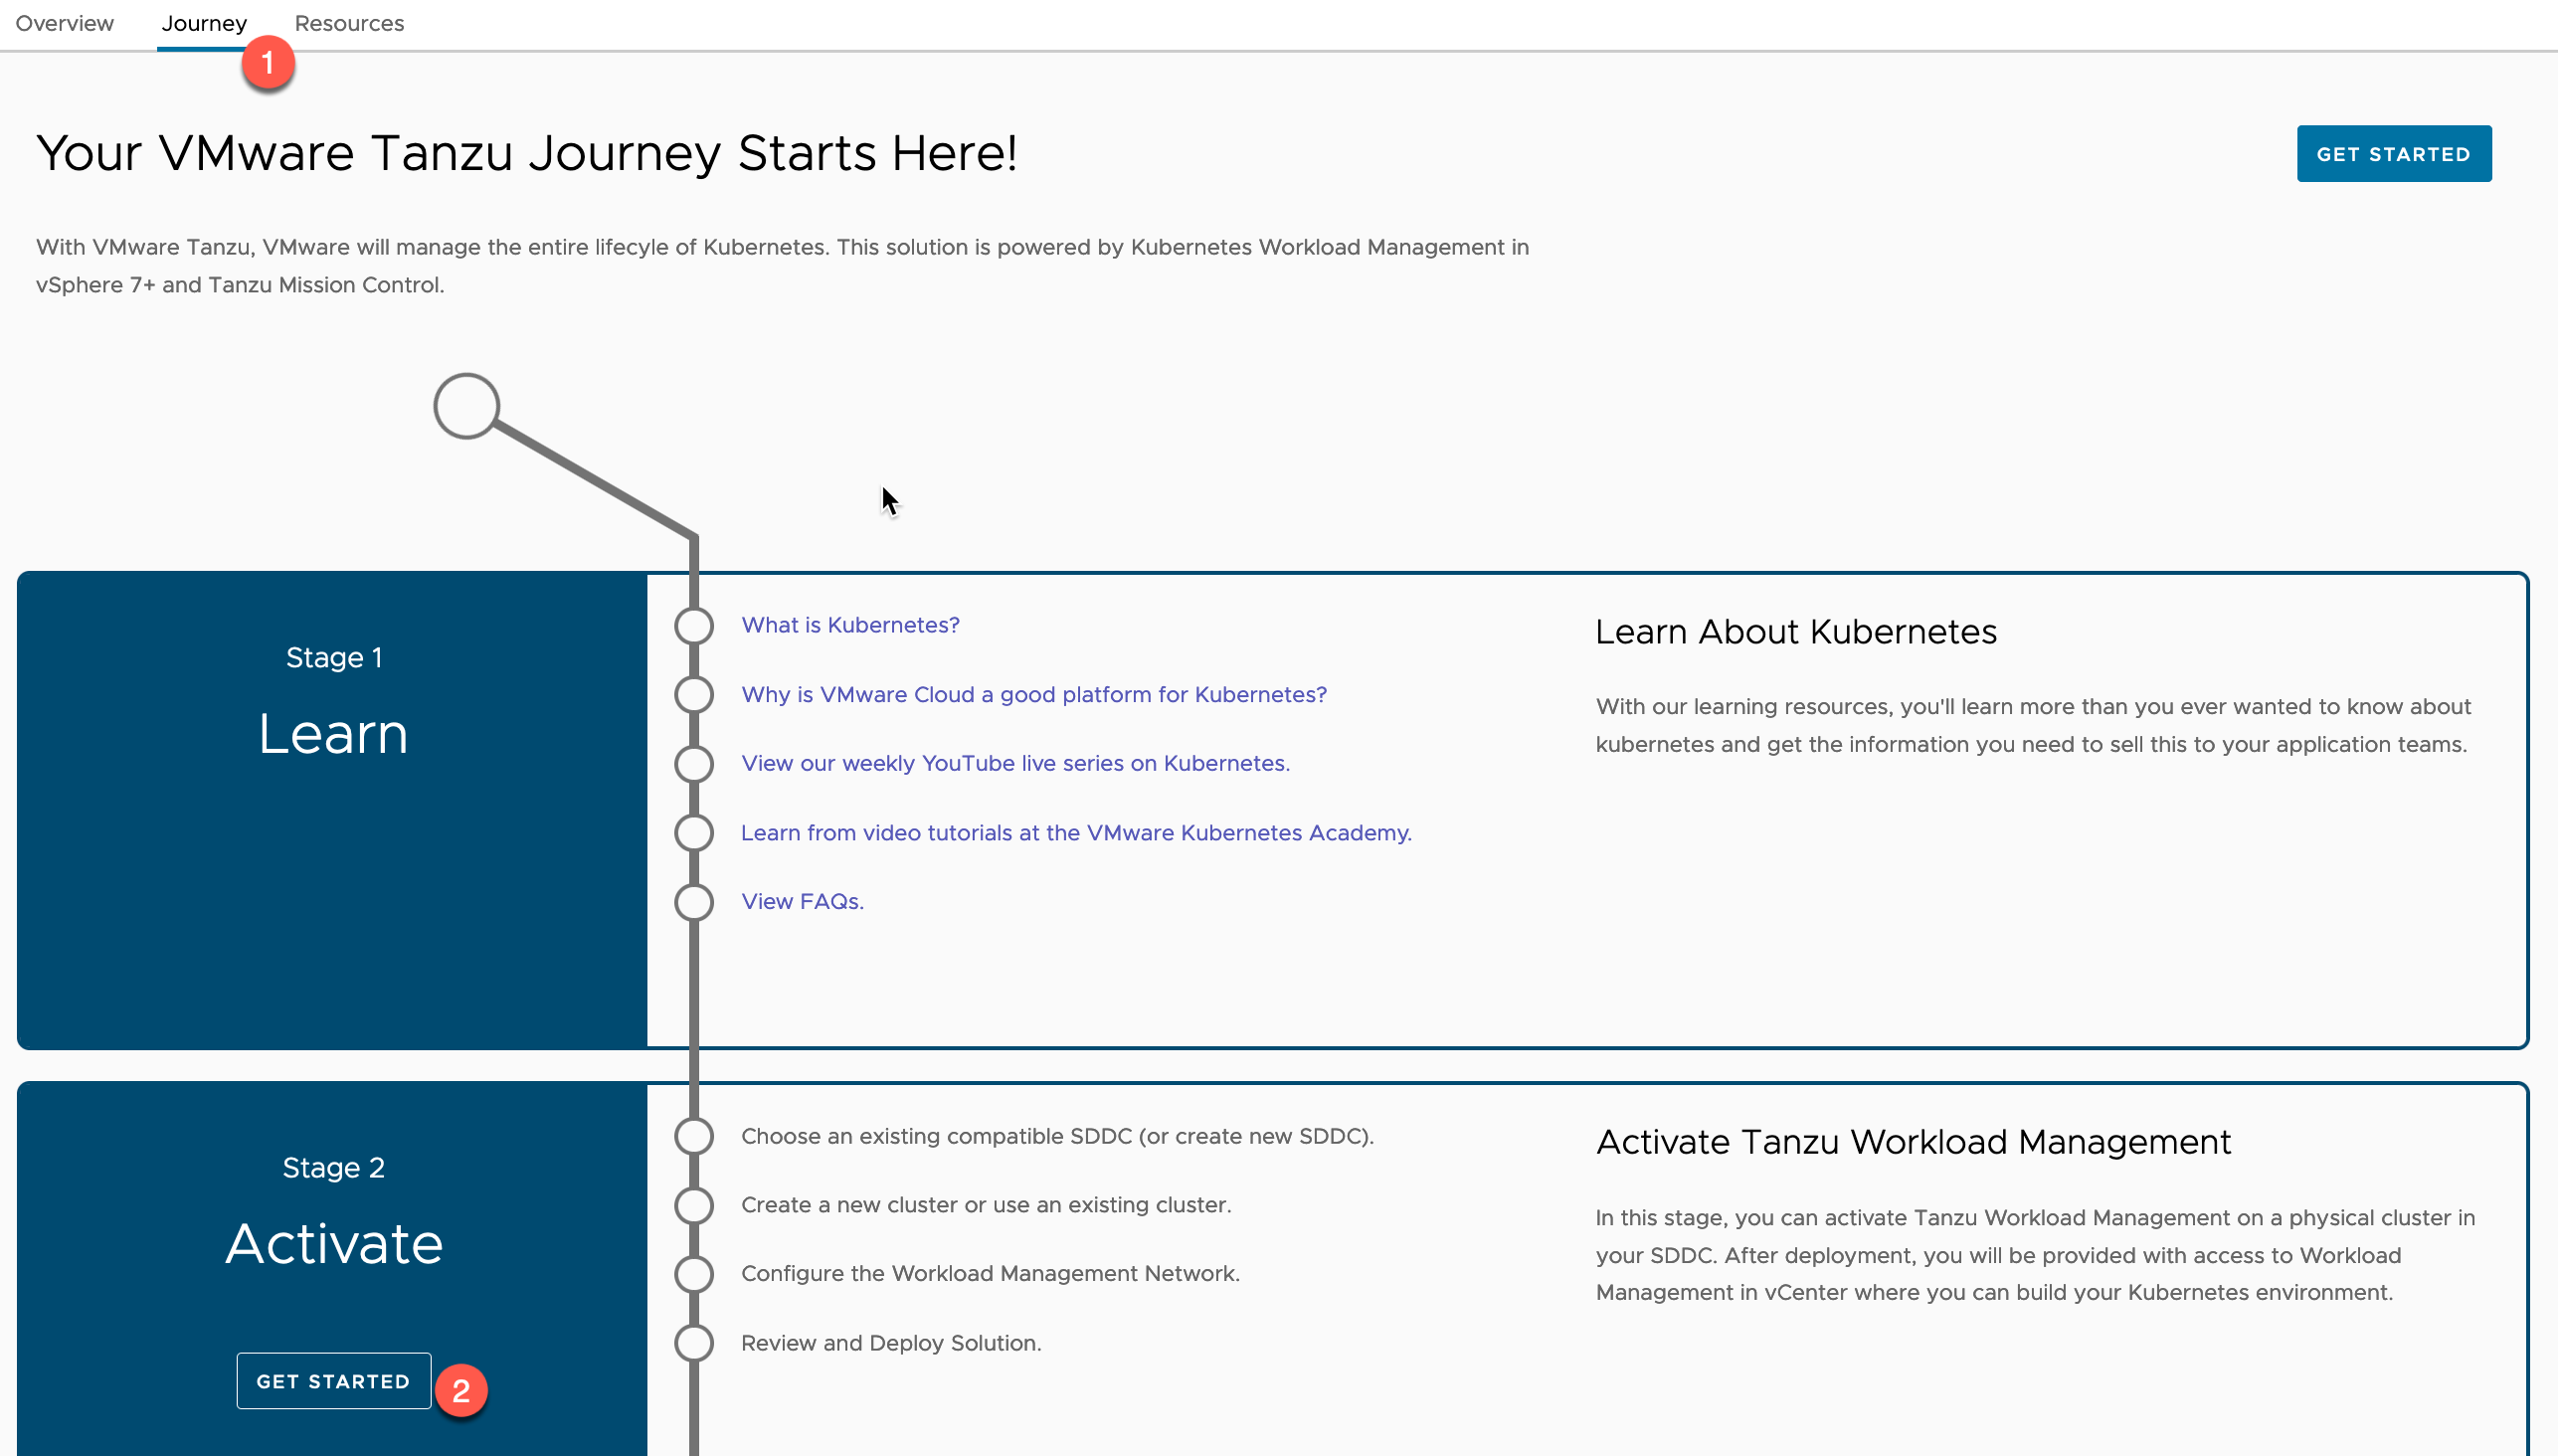
  • Select the Journey Tab
  • Under Stage 2 – Activate > Click Get Started

VMC - Launchpad - Kubernetes - Journey - Get started

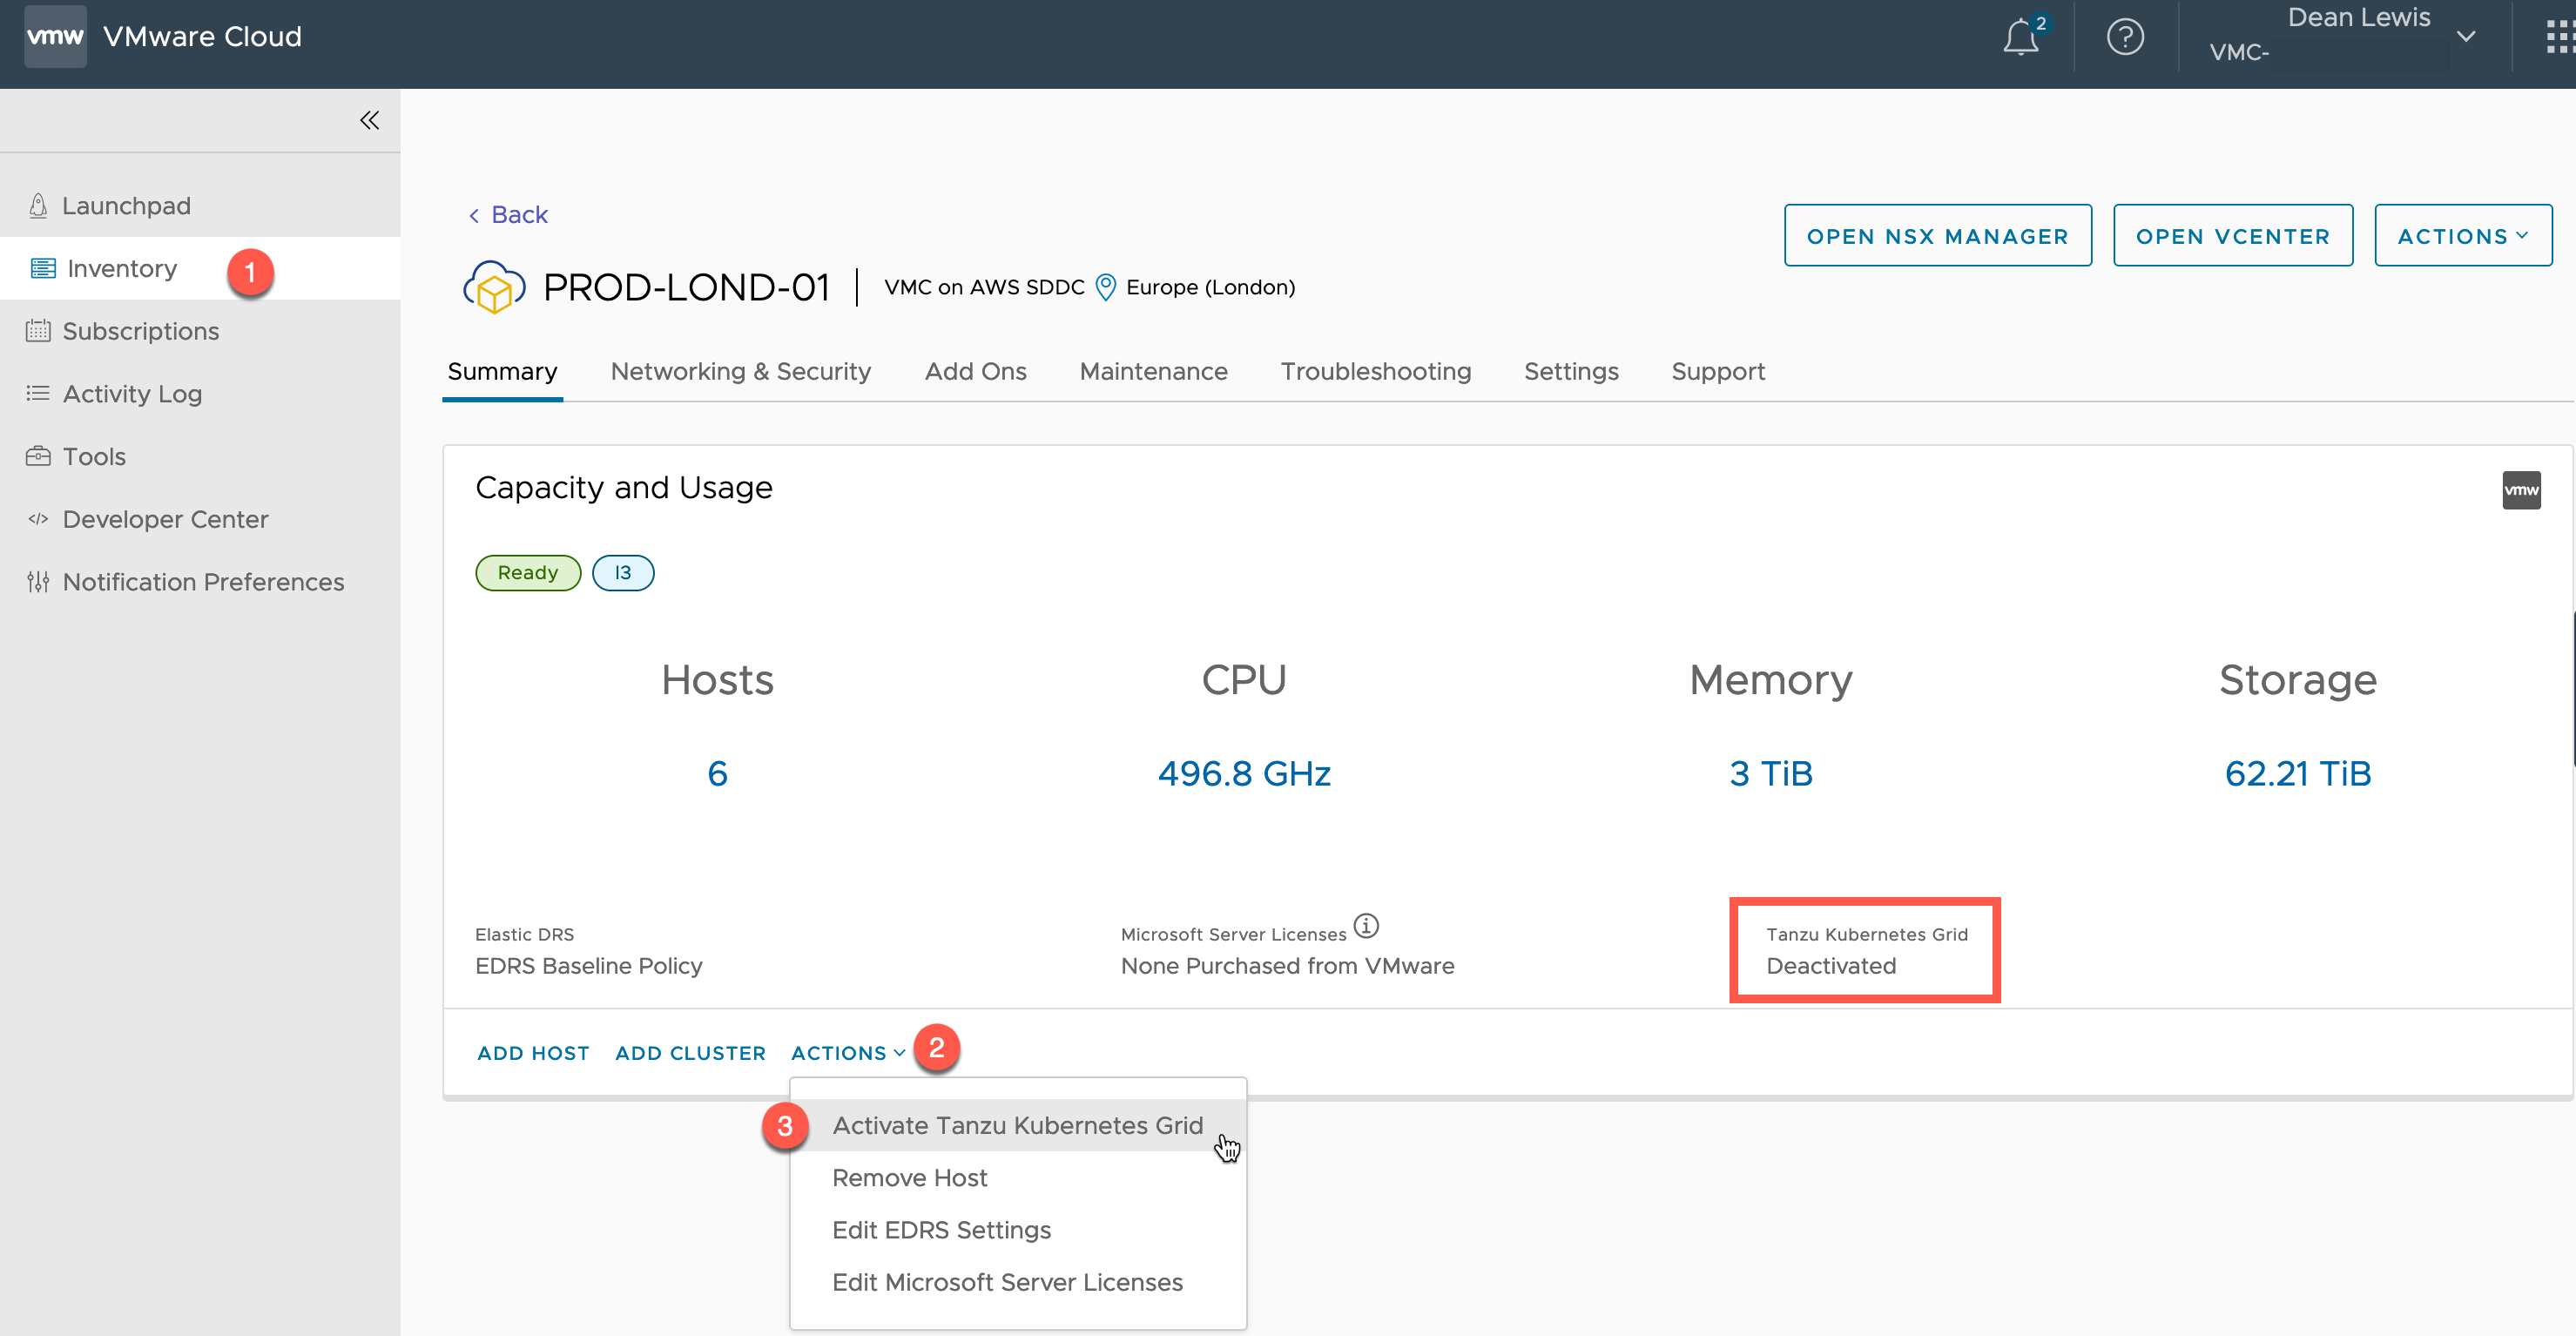
Alternatively, from the SDDC object in the Inventory view

  • Click Actions
  • Click “Activate Tanzu Kubernetes Grid”

VMC - Inventory - SDDC - Activate Tanzu Kubernetes Grid

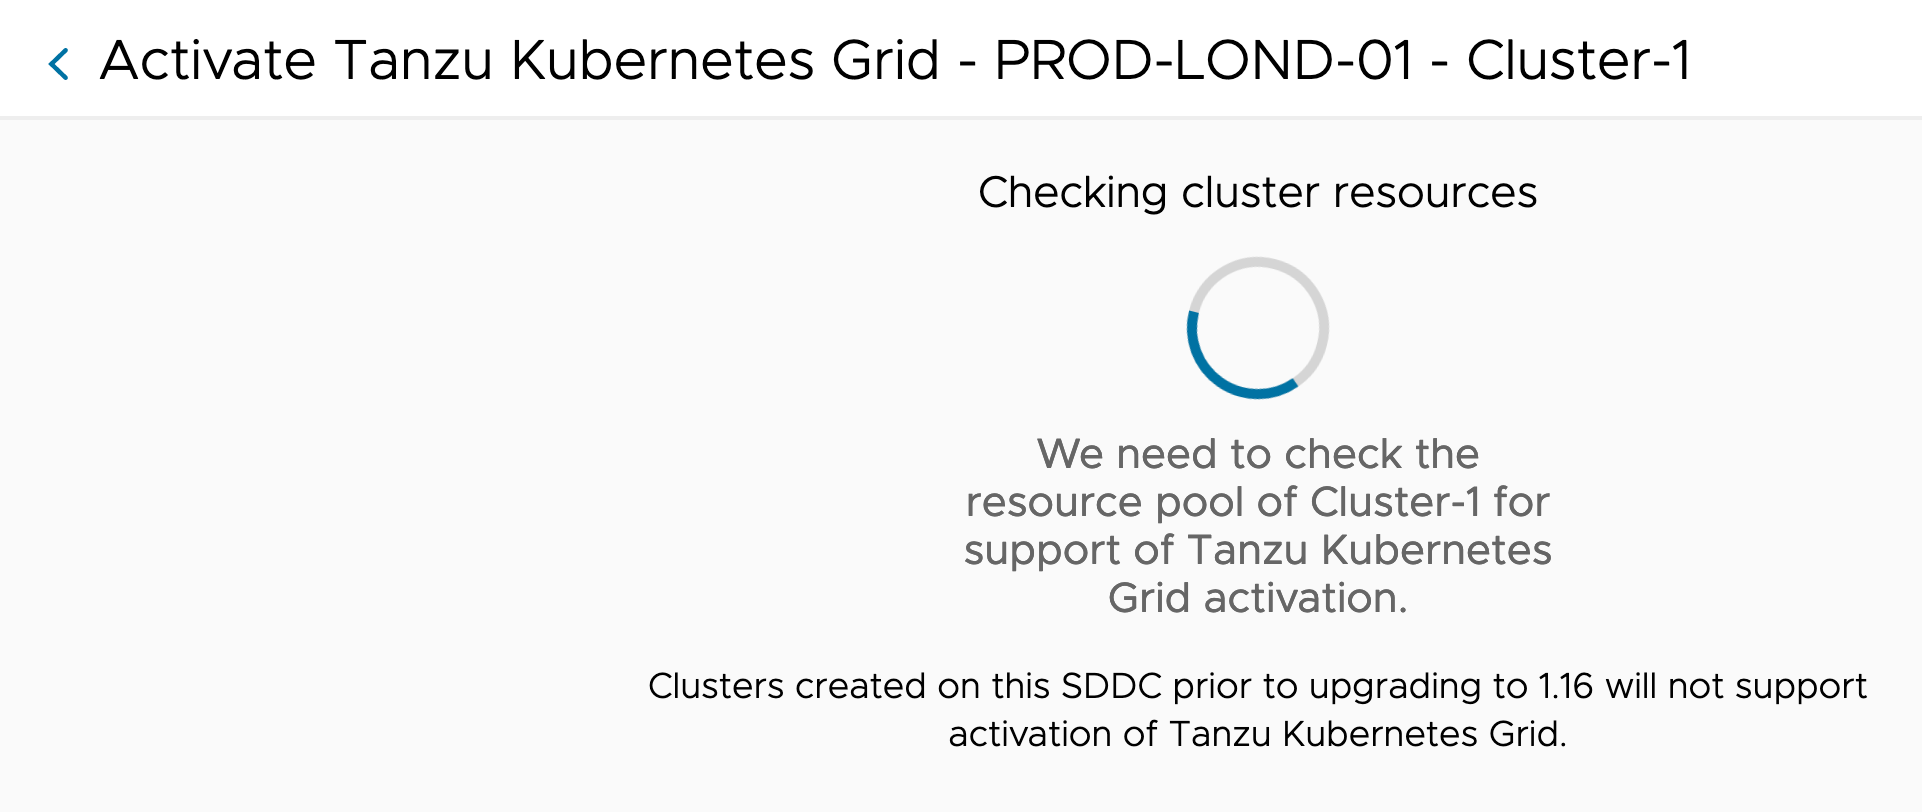
You will now be shown a status dialog, as VMC checks to ensure that Tanzu Kubernetes Grid Service can be activated in your cluster.

This will check you have the correct configurations and compute resources available.

VMC - Inventory - SDDC - Activate Tanzu Kubernetes Grid - Checking cluster resources

If the check is successful, you will now be presented the configuration wizard. Essentially, all you must provide is your configuration for four networks. Continue reading VMware Cloud on AWS Deep Dive – Activating, Deploying and Using the managed Tanzu Kubernetes Grid Service

Tanzu Observability Header

Tanzu Observability – First look at monitoring OpenShift & VMware Cloud on AWS

Recently, I was involved in some work to assist the VMware Tanzu Observability team to assist them in updating their deliverables for OpenShift. Now it’s generally available, I found some time to test it out in my lab.

For this blog post, I am going to pull in metrics from my VMware Cloud on AWS environment and the Red Hat OpenShift Cluster which is deployed upon it.

What is Tanzu Observability?

We should probably start with what is Observability, I could re-create the wheel, but instead VMware has you covered with this helpful page.

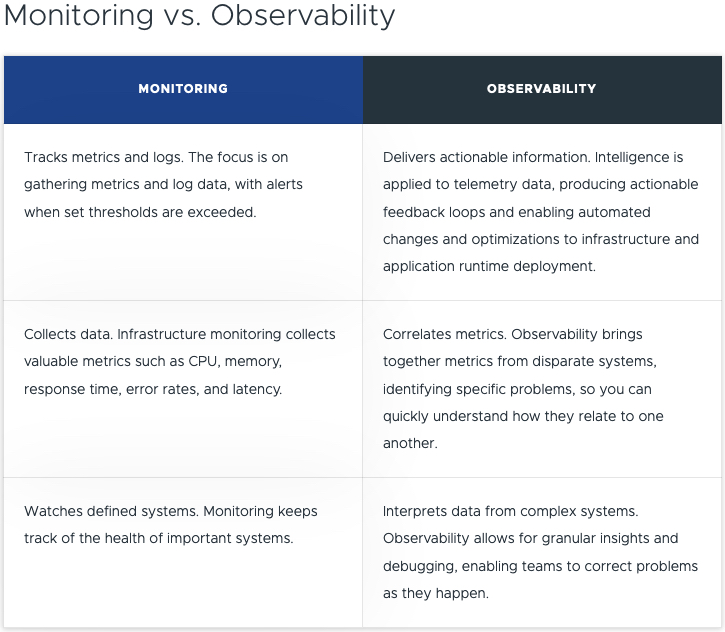
Below is the shortened table comparison.

Monitoring vs. Observability

As a developer you want to focus on developing the application, but you also do need to understand the rest of the stack to a point. In the middle, you have a Site Reliability Engineer (SRE), who covers the platform itself, and availability to ensure the app runs as best it can. And finally, we have the platform owner, where the applications and other services are located.

Somewhere in the middle, when it comes to tooling, you need to cover an example of the areas listed below:

  • Application Observability & Root Cause Analysis
    • App-aware Troubleshooting & Root Cause Analysis
  • Distributed Tracing
  • CI/CD Monitoring
  • Analytics with Query Language and high reliability, granularity, cardinality, and retention
  • Full-Stack Apps & Infra Telemetry as a Service
  • Infra Monitoring
    • Performance Optimization
    • Capacity and Cost Optimization
    • Configuration and Compliance

So now you are thinking, OK, but VMware has vRealize Operations that gives me a lot of data, so why is there a new product for this?

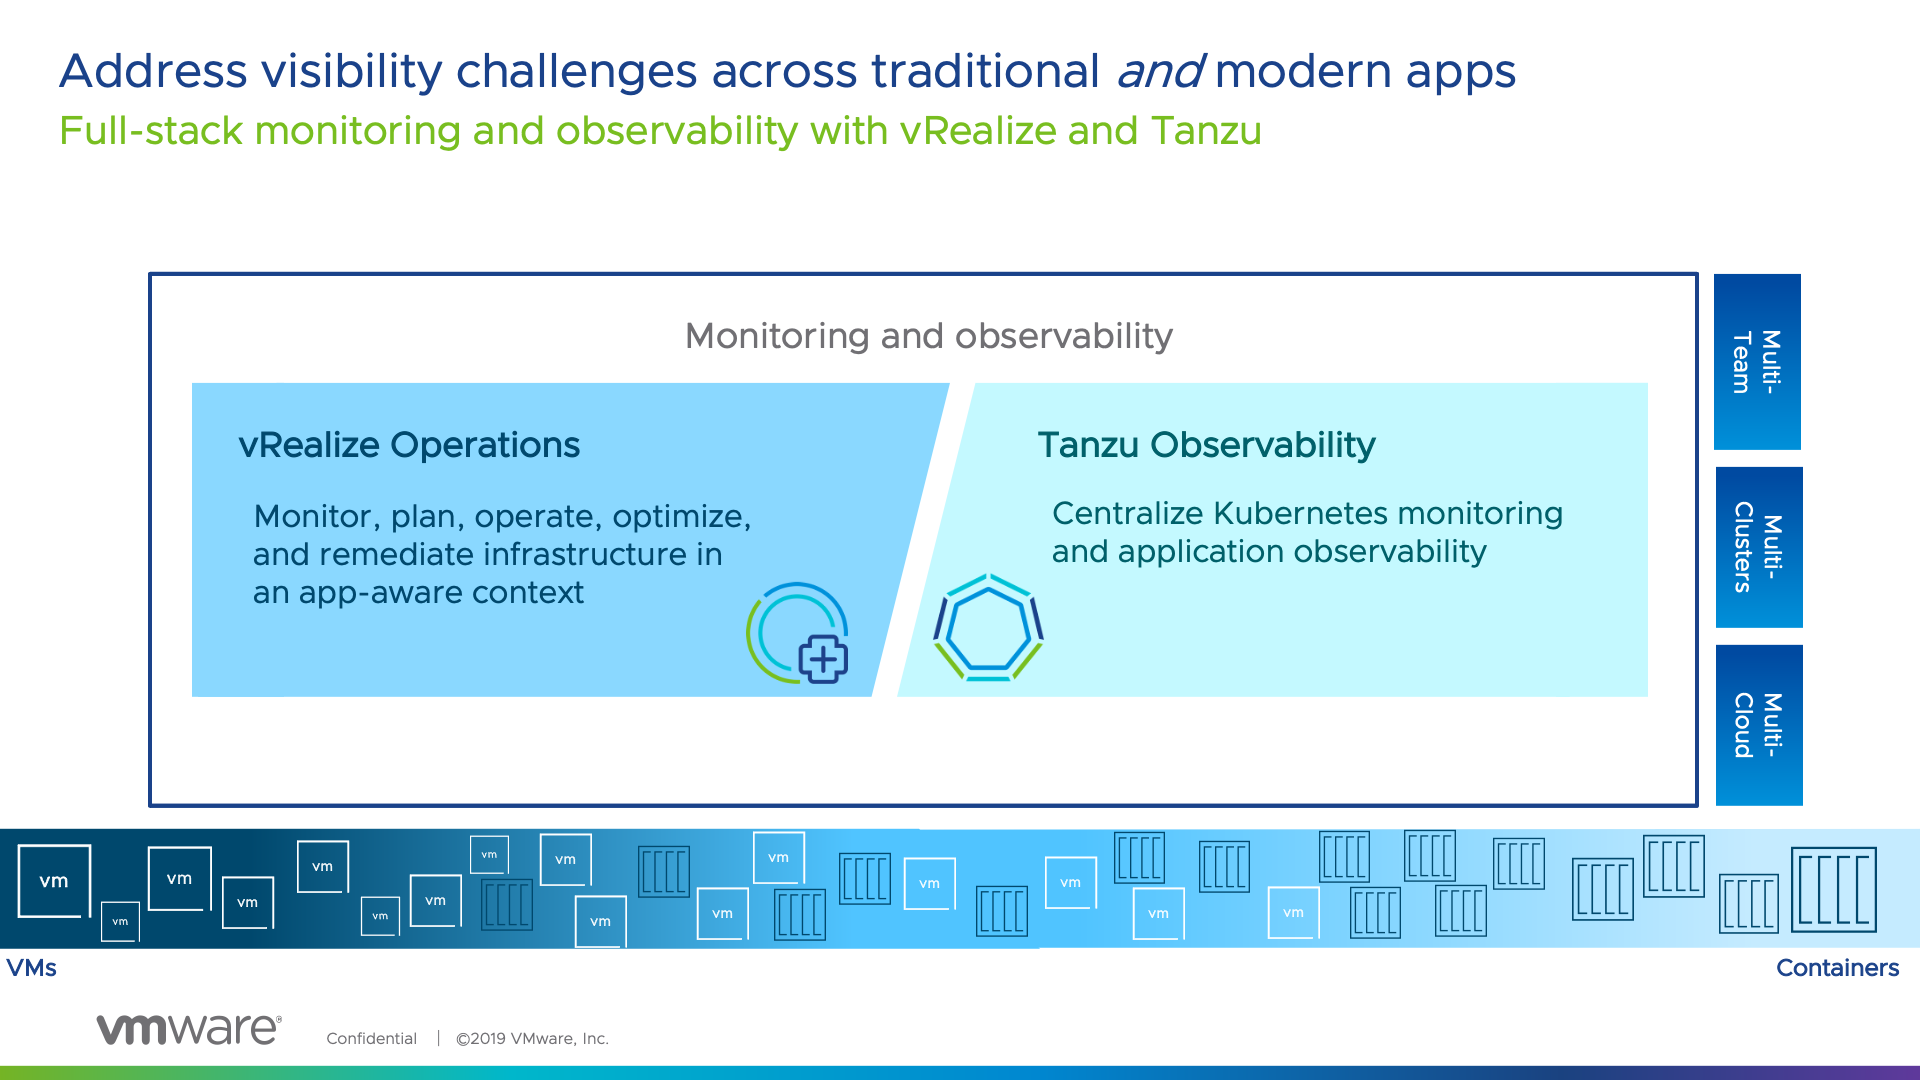
vRealize Operations and Tanzu Observability come together – delivering full stack monitoring and observability from both the infra-up and app-down perspective, equipping both teams in the org to meet common goals.

Monitoring & Observability

It is about the right tool for the right team and bringing together harmony between them. Which is why at VMware, the focus has been on covering the needs of team across the two products.

vRealize Operations is going to give you SLA metrics for your infrastructure and even application awareness. However Tanzu Observability brings more application focused features to allow you as a business, report on Application Experience of your end users/customers, at an SLA/SLO/KPI approach with extensibility to provide an Experience Level Agreement (XLA) type capability.

VMware Tanzu Observability by Wavefront delivers enterprise-grade observability and analytics at scale. Monitor everything from full-stack applications to cloud infrastructures with metrics, traces, event logs, and analytics.

High level features include:

To follow this blog, you can also easily get yourself access to Tanzu Observability.

Configuring data ingestion into Tanzu Observability using the native integrations

Configuring the OpenShift (Kubernetes) Integration using Helm

First, we need to create an API Key that we can use to connect our locally deployed wavefront services to the SaaS service to send data. Continue reading Tanzu Observability – First look at monitoring OpenShift & VMware Cloud on AWS

vRLI Header

VMC vCenter email alerts not supported – Workaround with vRealize Log Insight Cloud

The Issue

When configuring a VMware Cloud on AWS (VMC) SDDC vCenter, Administrators trying to use the vCenter Alerts email feature find they cannot complete the configuration, as the necessary options such as setting email server settings are greyed out.

Thanks to Bilal Ahmed for discussing this issue with me, so we could find a solution.
The Cause

Today this feature is not supported in VMware Cloud on AWS

The Workaround

By creating the vCenter Alert, even if it triggers to alert a placeholder email address. This will generate a vCenter event which is captured by vRealize Log Insight Cloud (vRLIC), the offering which is included with VMC (the freemium version included with VMC will sufficed for the workaround).

Within vRealize Log Insight you can generate an email alert from a query.

Obviously, a full monitoring suite is where you should be really heading for these types of information gathering and notifications such as vRealize Operations Cloud. However, this will suffice as a workaround where that option is not possible.

The vRealize Log Insight Cloud collects and analyzes logs generated in your SDDC.

A trial version of the vRealize Log Insight Cloud add-on is enabled by default in a new SDDC. The trial period begins when a user in your organization accesses the vRealize Log Insight Cloud add-on and expires in thirty days. After the trial period, you can choose to subscribe to this service or continue to use a subset of service features at no additional cost. 
Source
Example – Datastore Usage

You can do this for any vCenter Alarm type, but I am using datastore usage space as an example

  • First, we will create the vCenter Alarm

Continue reading VMC vCenter email alerts not supported – Workaround with vRealize Log Insight Cloud

Resolving VMC – Objects with non-compliant storage policies in SDDC

The Issue

Overnight I received an email from the VMware Cloud Services platform regarding a VMC environment I am an administrator of. The opening paragraph was as below:

Please be advised that you have VMs and or objects in your VMware Cloud on AWS SDDC that do not comply with the VMC SLA i.e. they have non-compliant storage policies.

Well, this doesn’t sound good. The email trailed off with a list of affected virtual machines and snapshots.

The Cause

This message is a flag on not following best practices in the VMC environment. VMC implements a Managed Storage Policy Profiles (MSPP) which integrate with vSphere VM Storage Policy management into SDDC Management. Ensuring that any workload not assigned a custom storage policy always complies with the services SLA requirements.

In short, if your VMs are part of the managed storage profile, they are covered by the SLAs provided by VMC, and if there’s an outage, you are eligible for credits.

You do have the ability to create your own custom policies as you require, but any VMs that are configured in these policies are not subject to the SLA.

The email is simply a pointer to say “hey we recommend you move those objects to a storage policy covered by the SLA”.

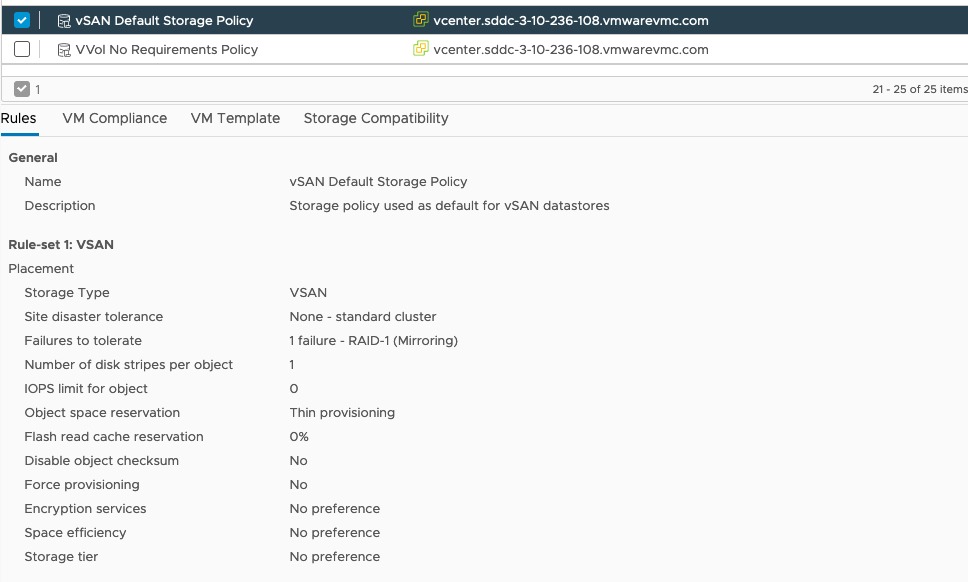
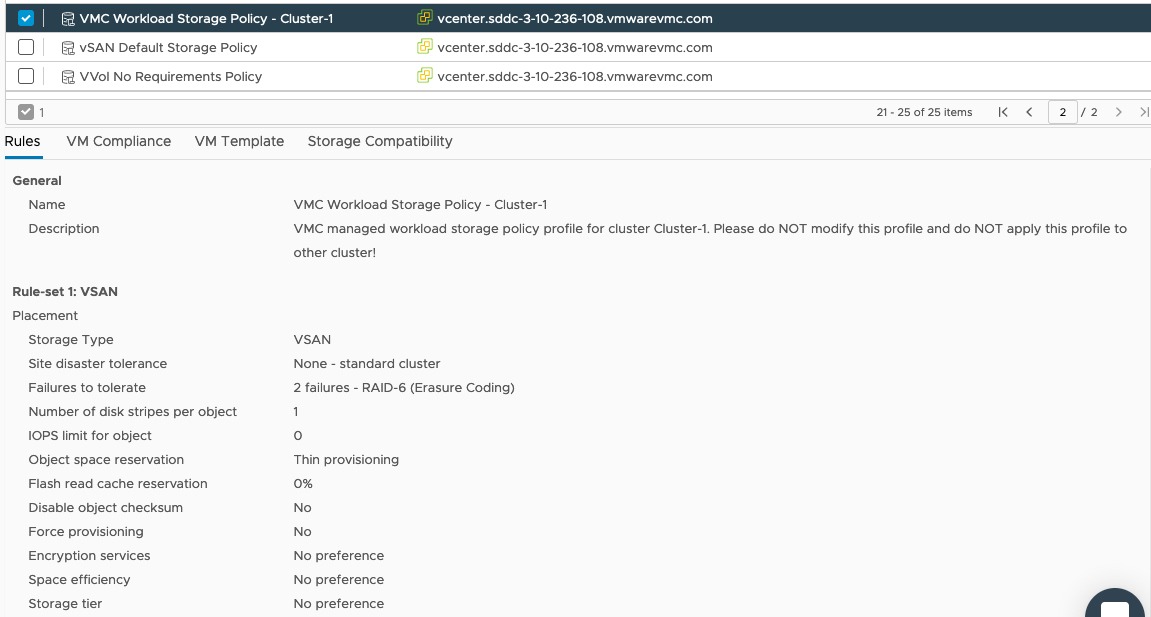
Below we have the custom policy (in this case just the default VSAN policy) and then the provided managed policy which takes the format of “VMC Workload Storage Policy – <Cluster-Name>”

VSAN default policy

VSAN managed policy

The Fix

If you want to resolve this, then here is a quick PowerCLI script to do that for you.

$custompolicy = <Custom Storage Policy Name>
$managedpolicy = <Managed Cluster Policy Name>

# To target the VMs home configuration
$vms = get-vm * | Get-SpbmEntityConfiguration | where {$_.StoragePolicy -like $custompolicy}

foreach ($VM in $vms) { $VM | Set-SpbmEntityConfiguration -StoragePolicy $managedpolicy}

# To target the hard drives of VMs
$hds = get-vm -location Compute-ResourcePool | get-harddisk | Get-SpbmEntityConfiguration | where {$_.StoragePolicy -like $custompolicy}

foreach ($hd in $hds) { $hd | Set-SpbmEntityConfiguration -StoragePolicy $managedpolicy }

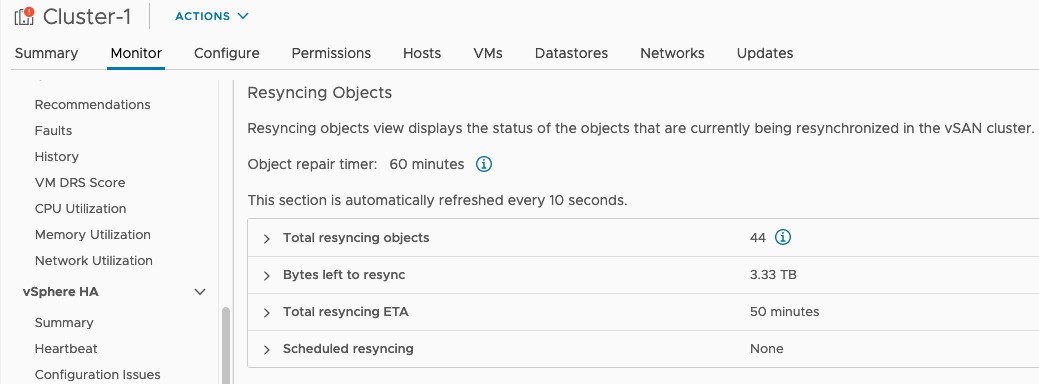
Below we can see now that the VSAN environment is now resyncing the data to the new storage policy requirements.

VSAN Resync Objects

If you’ve any questions or concerns about the changes to the storage policies for your production workloads, then as always, contact VMware Support to discuss first.

Regards

Dean Lewis