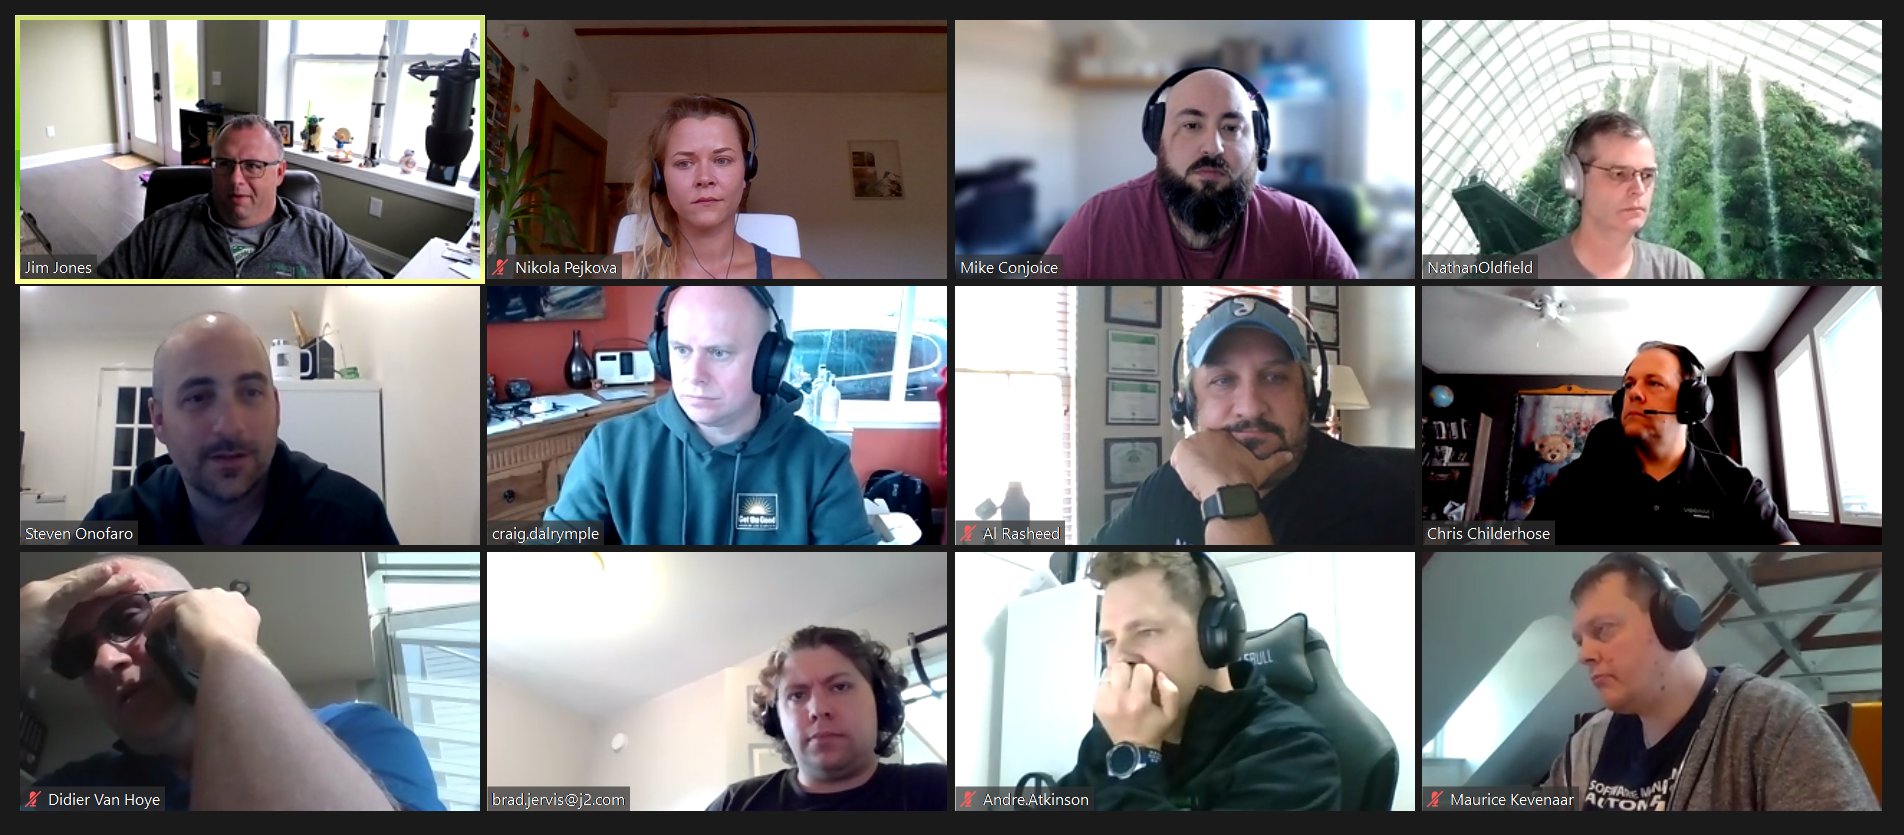
For those of you who know or follow me, I’m delighted to be part of the Veeam Vanguard program, created to bring together some of the top individuals focused on technology and yes, the Veeam ecosystem to help guide Veeam with feedback and perspective.
But to be honest, for me it’s just a fantastic group of individuals who are experts in their various fields. They will bend over backwards to help and support you, and we all love to learn and share with the community. If you are involved with Veeam products in any way in your daily life/job role, I highly recommend you look into the program and apply if you feel like it suits you.
One of highlights at #VanguardSummit was definitely AMA session with @gostev & his super team!Every #VeeamVanguard had unique chance to ask anything about @Veeam #backup #vao #veeamagents #cloud #datamanagement & exchange their user experience to help us improve them. PRICELESS! pic.twitter.com/EdqP16WtMm
— Nikola Pejková (@NikolaPejkova) October 18, 2019
Moving onto this blog post, I’ve had the pleasure of interviewing Nikola Pejkova (twitter) from Veeam, Technical Analyst and Community Manager. Nikola has been the driving force behind the Veeam Vanguard program and events for the past few years.
So, let’s dive in!
Nikola, tell us a bit about yourself, and what led to you taking the role as the community manager for Veeam.
Thanks for having me, Dean! I live in Prague, beautiful capital of Czech Republic where Veeam have its offices. I’ve been working in IT industry for more than 6 years now and I’ve experienced different roles in corporates as well as in startups. This mix of experiences have been probably the right fit when Veeam was searching for a community manager and I’ve been searching for a role where I can build something valuable and long-term.

So, the Veeam Vanguard community manager role was the perfect match! I’ve been impressed by Veeam’s history, maintenance, and development of their own software products and also the culture that is so far from the experience I gained in other worldwide corporate companies.
Please can you define what community means to you? And what goals you had coming into this role?
Community is something like a secondary family when it’s treated in a good way. There are many kinds of communities out there, but specially in case of IT ones, they’re kind of a special case. As they are uniting literally people from all the world, they are incredibly diverse and let us overcome the physical distance through technologies we got available those days.

Power of the community comes from its members, who can share together their experiences, have conversations about issues they’re solving at the moment or just support each other in hard times. Another crucial role in the community success is having the company that has to offer not just great products, but also continuous and various ways of engagement that keep the community live and up-to-date with all the innovations that are coming so fast nowadays! It’s like a group of friends who are having the same passion, in our case, saving and protecting the data with products that just work.
What makes an excellent community program versus just a good community program?
In my opinion there’s a crucial management of the community that needs to be done in a way that members understand the purpose of being part of the community, what benefits they are getting from interactions with others and what is the added value that they take out of being a part of any community.

I’d say that difference between excellent and just a good community program is a passion of its members – when the community program is managed in a great way, members are happy, passionate, willing to participate and do extra steps for the community. When you got an average one, it can fulfill its purpose as a platform for social interactions and sharing experiences, but members won’t be so proactive to dedicate their own time out for the community.
Can’t even describe how much joy can bring such a #veeamazing gift as a @VannyVanguard hologram sticker waiting for me in the mailbox after arriving home!? Thanks @saintdle, couldn’t wish a better community than a #VeeamVanguard superheroes covering my back! ??♂️ #happy #grateful pic.twitter.com/IJ183R9vNc
— Nikola Pejková (@NikolaPejkova) July 10, 2020
Are there areas from other community programs you are looking to replicate or even avoid? Which activities to you think have lost their shine?
What I’d like to generally avoid is taking the community members as “anonymous” numbers without any personal touch. What is incredible on Veeam Vanguard community is that we know each other not just by name, in most cases also personally. We do care about Vanguards as a group of unique and very special and talented individuals, which I’d love to keep for the future, as it’s one of the aspects that differentiate our community from others.
What’s been the highlights so far leading the community programs at Veeam?
It’s hard to name just few of them, but for sure the highlight has been Vanguard Summit in Prague last October, where we met all together – Veeam Product Strategy team accompanied also with members of R&D team was spending almost the week in Prague together with Vanguards from all over the world to share latest product updates, which was super fun and we all had incredible time!

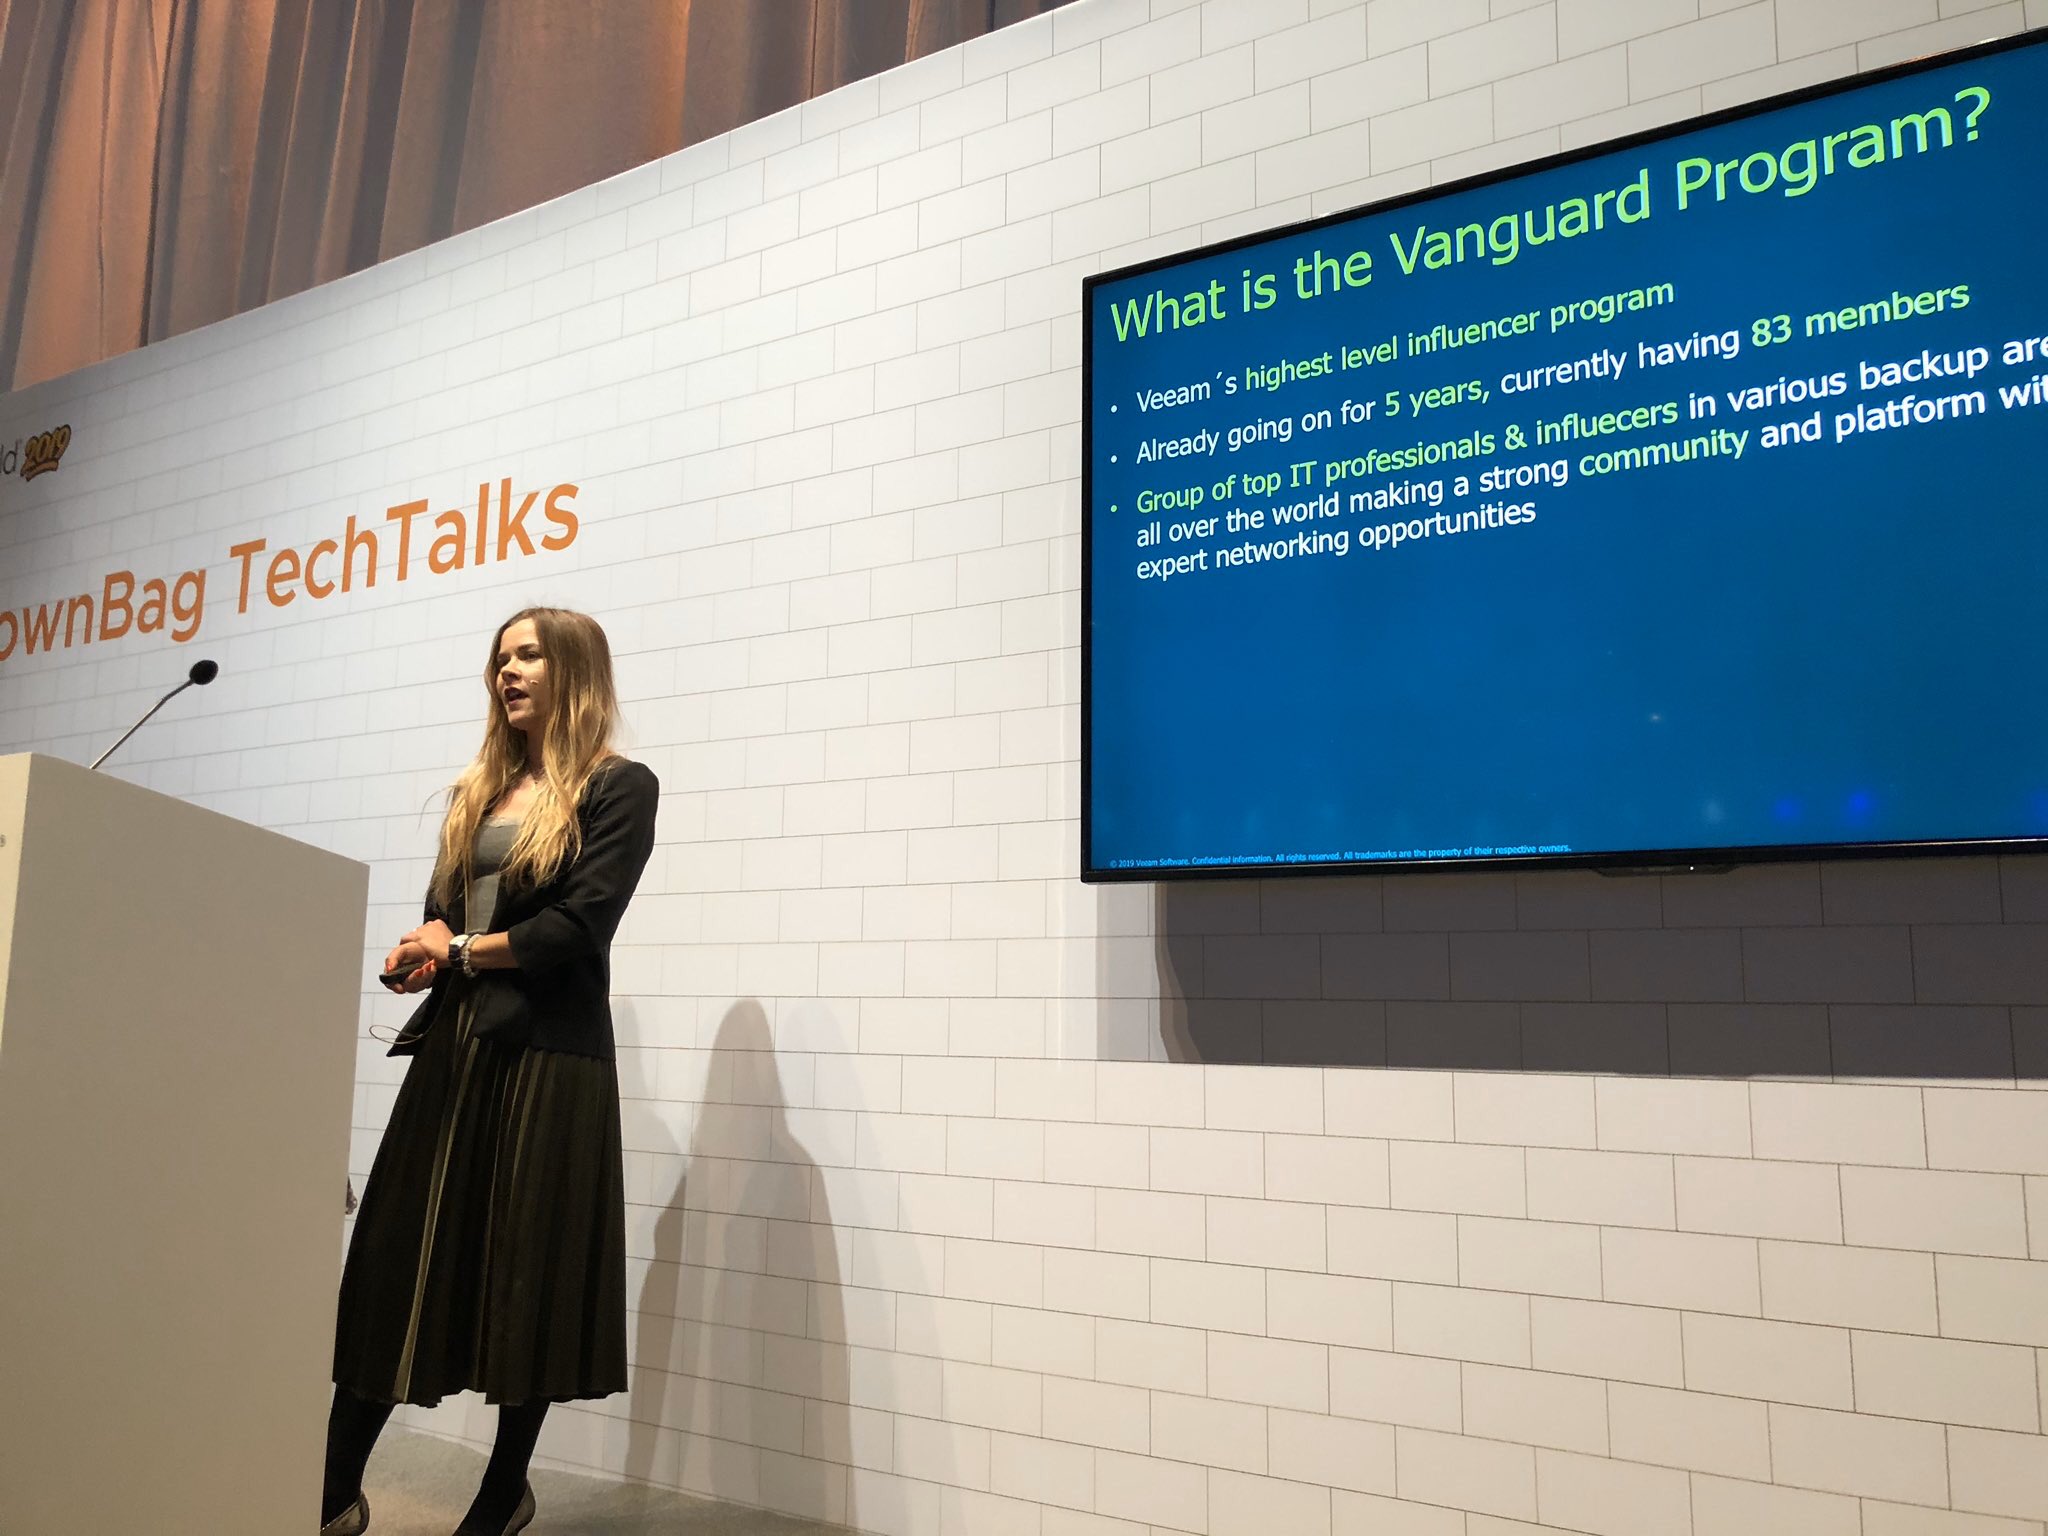
Also presenting about the Vanguard program during VMworld in Barcelona last fall was incredible experience. And I cannot forget how proud I was when so many Vanguards were answering during VeeamON Virtual in Expert Lounge to attendees from across the globe or participated on presentations with other Veeamers during VeeamON this year. Generally, the biggest highlight for me is to see the passion that Vanguards have towards Veeam products and willingness to constantly helping improve them.
You are launching a new program, the Veeam Legends program, can you tell me about the process behind getting this ready for release to the public?
Well, there were a lot of thoughts and efforts behind this project! First, we wanted to foster even deeper engagement that rewards our customers and partners for the role they have played in our success. We also wanted to introduce a new tier in our community program enabling some of our most active community participants to be recognized as leaders in the data protection community through content creation and user group and event participation.
Second, we wanted to keep conversation going and to provide users with a single place where they can share best practices, participate in virtual Veeam User Groups, grow as a Veeam pro by completing free, on-demand training through Veeam University and have fun by recognition and rewards.
That’s how we launched Veeam Community Resource Hub and Veeam Legends, the new community programs!
Diversity and inclusion have become a recent focal topic in the 2020 climate, what is Veeam doing around this?
Veeam is very proactive when it comes to inclusion and equal opportunities. There are various initiatives inside the company that everybody can join, we also have an option to be active inside our local communities as volunteers. As Veeam is a global company with offices across the world, diversity is one of the key values as well as respect to others.
And as a woman in the technology industry, what do you think of the state of D&I in technology today? And what barriers do we need to overcome?
Since time I’ve started to work in IT industry, I can see growing number of women not just in leading managerial roles, but also in development, graphics, and analytics, which is great!

I don’t see any reason why IT should be just for men, but I believe that it’s kind of stigmatised from the past that those technical areas are for men and others for women. I believe that we’ve overcome this as a society and much more girls are applying now to technical fields in universities, so I am expecting continual growth of numbers of girls in the IT. Also, for the reason that technologies are everywhere today, so younger generation is growing surrounded by all this since they were born, and It feels generally much more natural for them to be in contact with all the technology that is new for previous generations.
Obviously with the current global pandemic we find ourselves suffering some disruption in our lives, but looking towards the rest of 2020 and into 2021, what personal goals and plans do you have?
After being locked due to COVID quarantine over 4 months in Canarias, my main goal to get home was fortunately finally met ?.

Regarding the current travel restrictions and turning the world as we knew it before upside down, I’m thinking about some minivan reconstruction to rebuild it into the house on 4 wheels. We are having unlimited number of beautiful spots to visit in Czech Republic and surrounding countries, so having the van and independence to go anywhere I want gives me enough satisfaction. And finally put together my home office, as I think I might be seeing it a little more often!
Wrapping up
Dean here again.
I’d like to thank Nikola for agreeing to be interviewed. Working as a community manager in the technology industry is a unique challenge. It’s more than running events and asking customers/partners/advocates to help promote your brand. There are many community programs out there, but not all are successful, and it’s a fine line in getting it right.
It’s taken me a while to finalise this article and writing during a tumultuous year has been interesting. Since Nikola and I first exchanged messages on this blog post, so much has changed worldwide.
Hopefully in the future when we find ourselves to travel, myself and Nikola will be able to sit down and conduct a follow up interview, we can review this time, and how the community has changed during this time.
Regards


