Continuing from the First Look blog post, where we created a distributed application between different public cloud Kubernetes deployments and connected them via Tanzu Service Mesh. We will move onto some of the more advanced capabilities of Tanzu Service Mesh.
In this blog post, we’ll look at how we can setup monitoring of our application components and performance against a Service Level Objective, and then how Tanzu Mission Control and action against violations of the SLO using auto-scaling capabilities.
What is a Service Level Objective and how do we monitor our app?
Service level objectives (SLO/s) provide a structured way to describe, measure, and monitor the performance, quality, and reliability of micro-service apps.
A SLO is used to describe the high-level objective for acceptable operation and health of one or more services over a length of time (for example, a week or a month).
- For example, Service X should be healthy 99.1% of the time.
In the provided example, Service X can be “unhealthy” 1% of the time, which is considered an “Error Budget”. This allows for downtime for errors that are acceptable (keeping an app up 100% of the time is hard and expensive to achieve), or for the likes of planned routine maintenance.
The key is the specification of which metrics or characteristics, and associated thresholds are used to define the health of the micro-service/application.
- For example:
- Error rate is less than 2%
- CPU Average is Less than 80%
This specification makes up the Service Level Indicator (SLI/s), of which one or multiple can be used to define an overall SLO.
Tanzu Service Mesh SLOs options
Before we configure, let’s quickly discuss what is available to be configured.
Tanzu Service Mesh (TSM) offers two SLO configurations:
- Monitored SLOs
- These provide alerting/indicators on performance of your services and if they meet your target SLO conditions based on the configured SLIs for each specified service.
- This kind of SLO can be configured for Services that are part of a Global Namespace (GNS-scoped SLOs) or services that are part of a direct cluster (org-scoped SLOs).
- Actionable SLOs
- These extend the capabilities of Monitored SLOs by providing capabilities such as auto-scaling for services based on the SLIs.
- This kind of SLO can only be configured for services inside a Global Namespace (GNS-scoped SLO).
-
Each actionable SLO can have only have one service, and a service can only have one actionable SLO.
The official documentation also takes you through some use-cases for SLOs. Alternatively, you can continue to follow this blog post for an example.
Quick overview of the demo environment
- Tanzu Service Mesh (of course)
- Global Namespace configured for default namespace in clusters with domain “app.sample.com”
- Three Kubernetes Clusters with a scaled-out application deployed
- AWS EKS Cluster
- Running web front end (shopping) and cart instances
- Azure AKS Cluster
- Running Catalog Service that holds all the images for the Web front end
- GCP GKE
- Running full copy of the application
- AWS EKS Cluster
In this environment, I’m going to configure a SLO which is focused on the Front-End Service – Shopping, and will scale up the number of pods when the SLIs are breached.
Configure a SLO Policy and Autoscaler
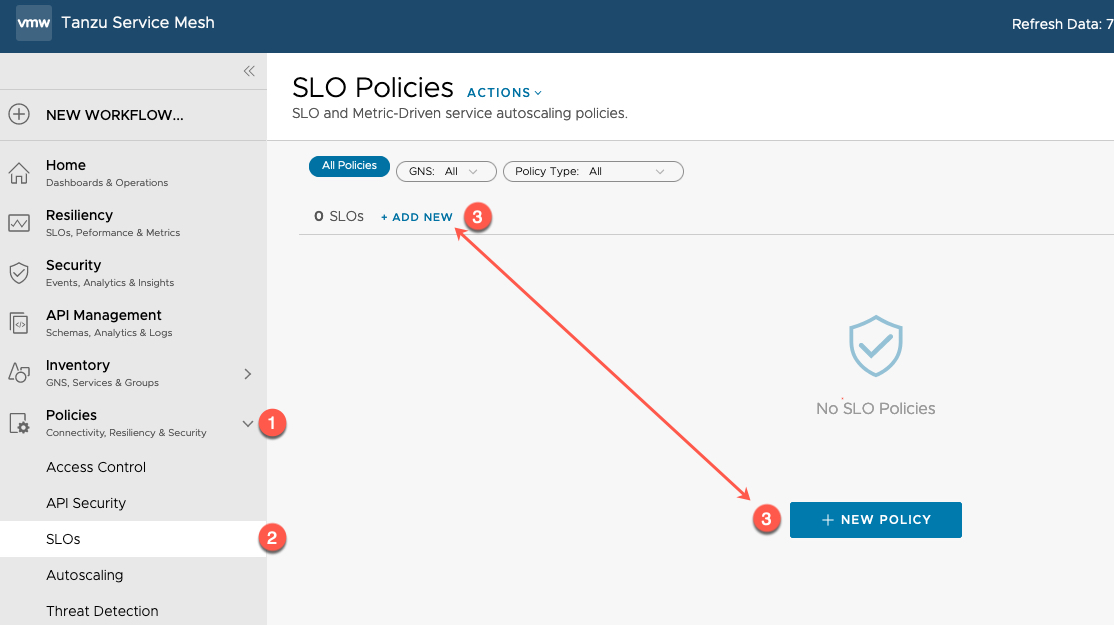
- Under the Policies header, expand
- Select “SLOs”
- Select either New Policy options
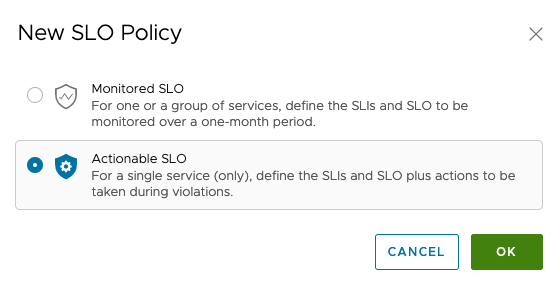
- Choose your SLO Policy type
- Once your type is chosen, you cannot change them.
- If you want to configure an actionable SLO but monitor/simulate first, there are options to allow you to do so when you choose this type.
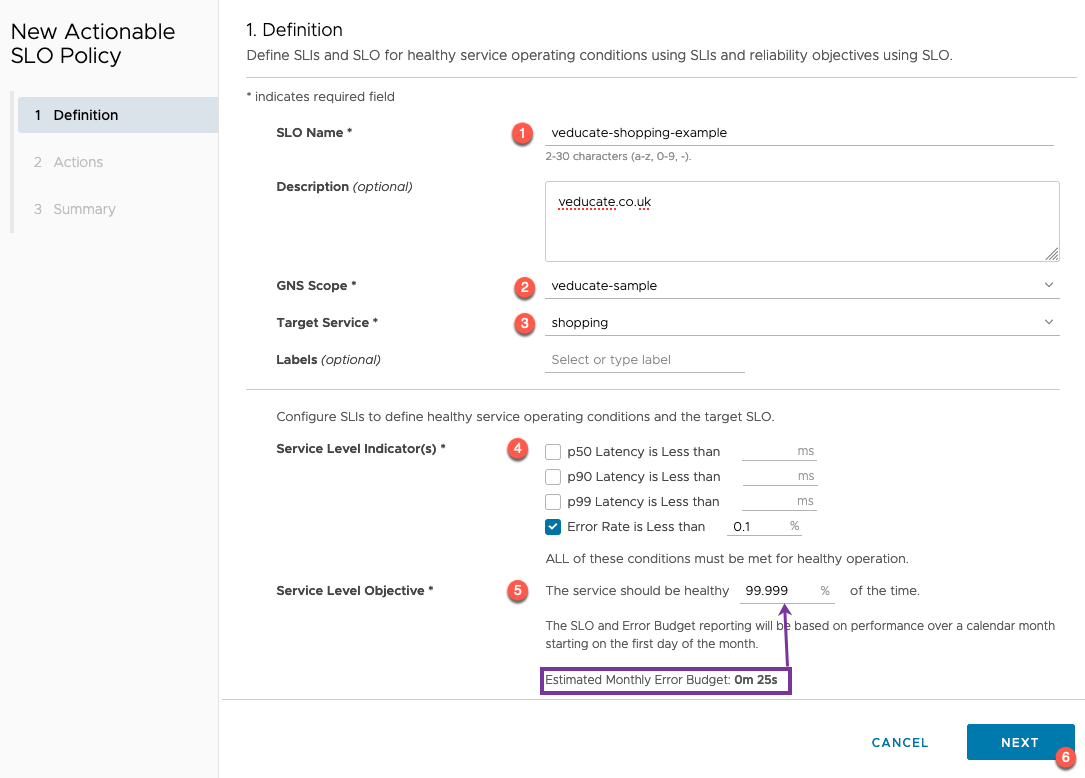
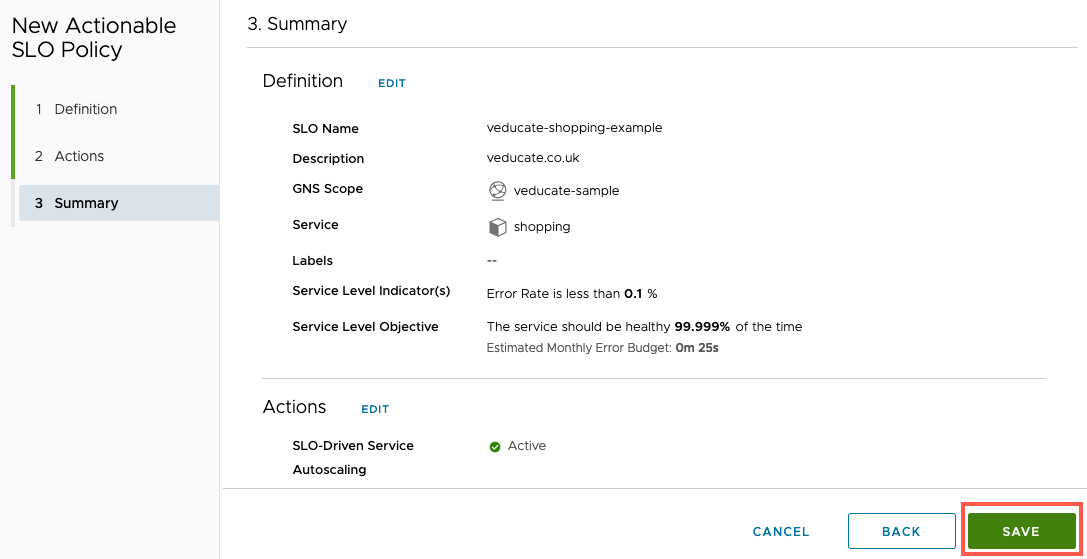
- Set the name of the SLO Policy and description (optional)
- Select which GNS this policy will be part of
- In this example I am using an actionable SLO which can only be used against a GNS
- Select the target service
- A service can only be tied to a single SLO Policy
- Select your chosen Service Level Indicators
- In the next section, you’ll see where we can monitor these statistics so we can gauge what we should configure or tweak
- Select the Service Level Objective
- When you change this figure, the estimated monthly error budget will change dynamically
- Five 9’s of availability is the maximum figure you can input
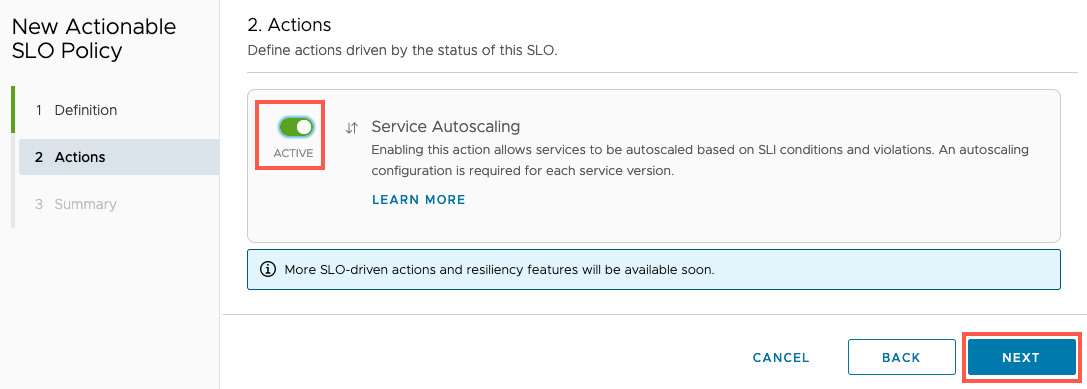
- Configure if you want to activate an autoscaling policy
- You could choose to not activate and monitor first.
- Review the summary, select Save
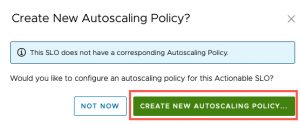
- You will be prompted to create a new associated Autoscaling policy
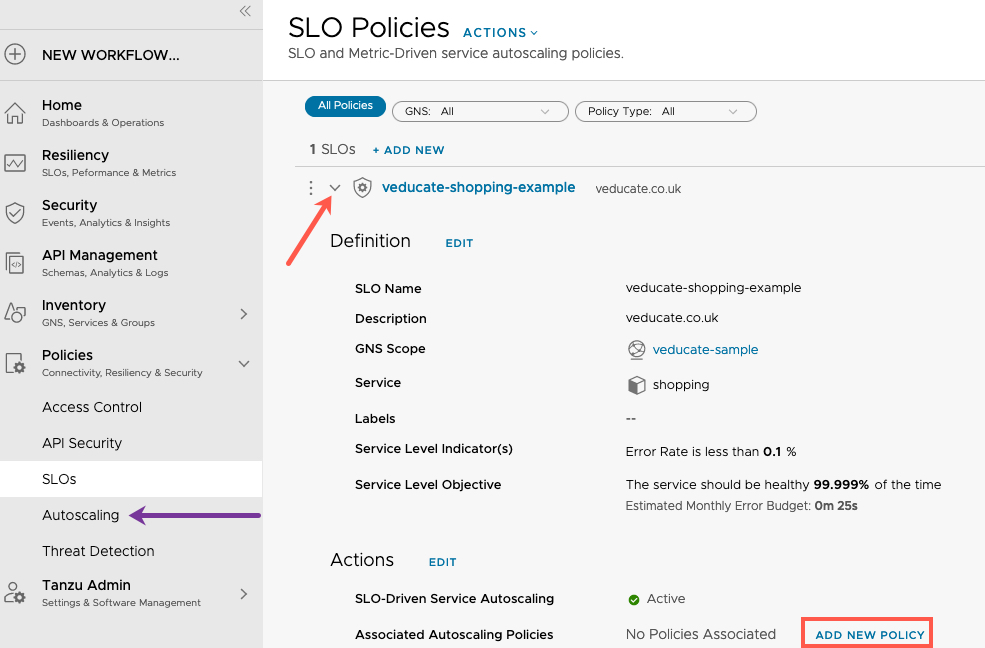
- If you select “Not Now” the next screenshot show you the steps
- You can click to add a new autoscaling policy from the SLO Policy interface, or via the Autoscaling policy view.
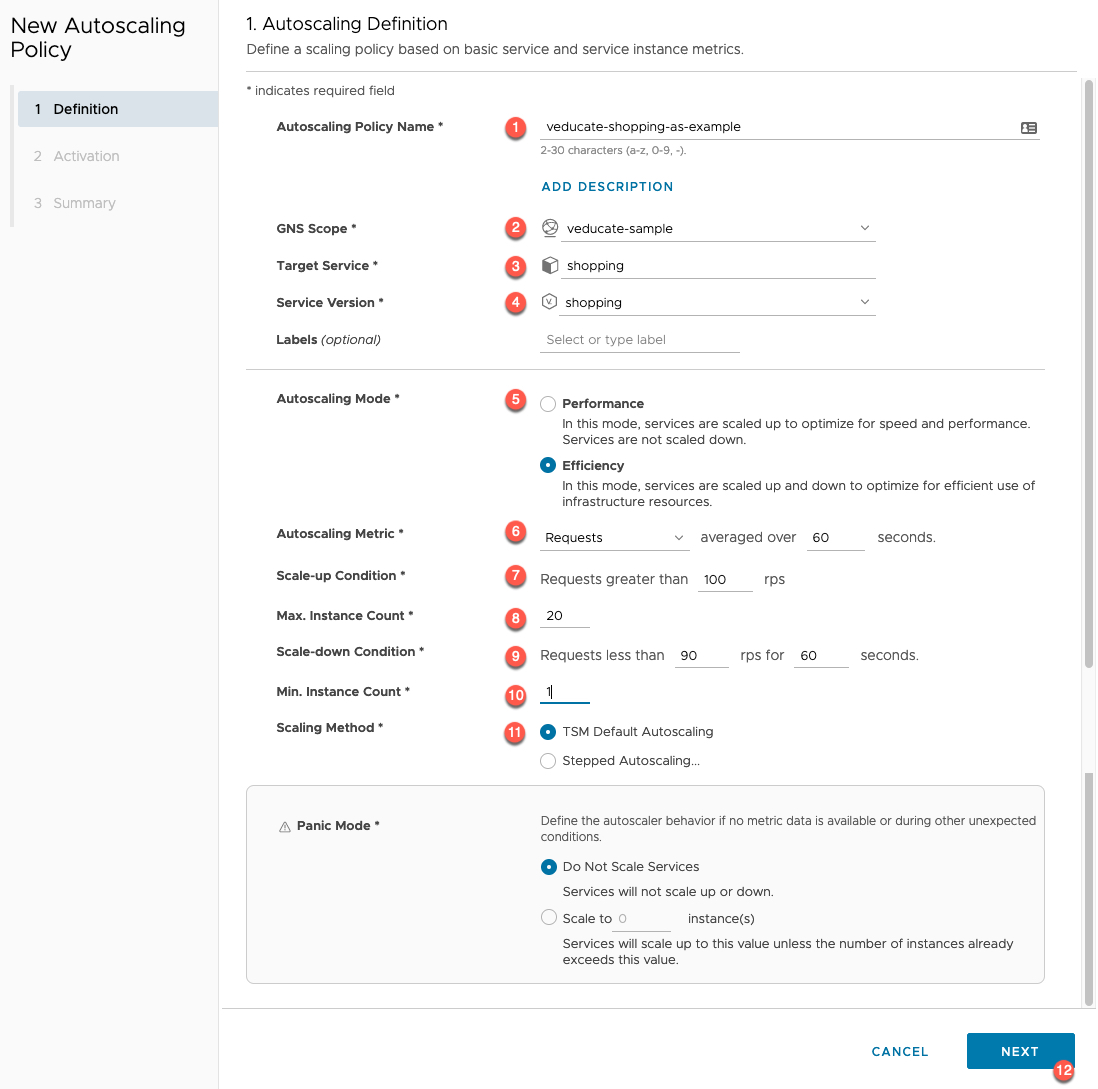
Now to create the new autoscaling policy. Once you’ve made your way to that dialog box from the above options.
- Configure the autoscaling policy name
- Select the GNS Scope
- Select the Target Service
- Select the Service Version
- If you have no versions configured, only a single value will be selectable
- Select the Autoscaling mode
- Performance – Scales up only
- Efficency – Scales up and down
- Select which metric to monitor for the autoscaling decision, and the time period to average over
- Set the scale-up condition
- Select the max instances of your service
- Set the scale-down condition
- Select the minimum instances of your service
- Select the Scaling Method
- If you select “Stepped” you’ll be asked to input the increment size.
Select Next.
Select the Policy Activation configuration. Here you can choose to be active or just simulate for monitoring purposes.
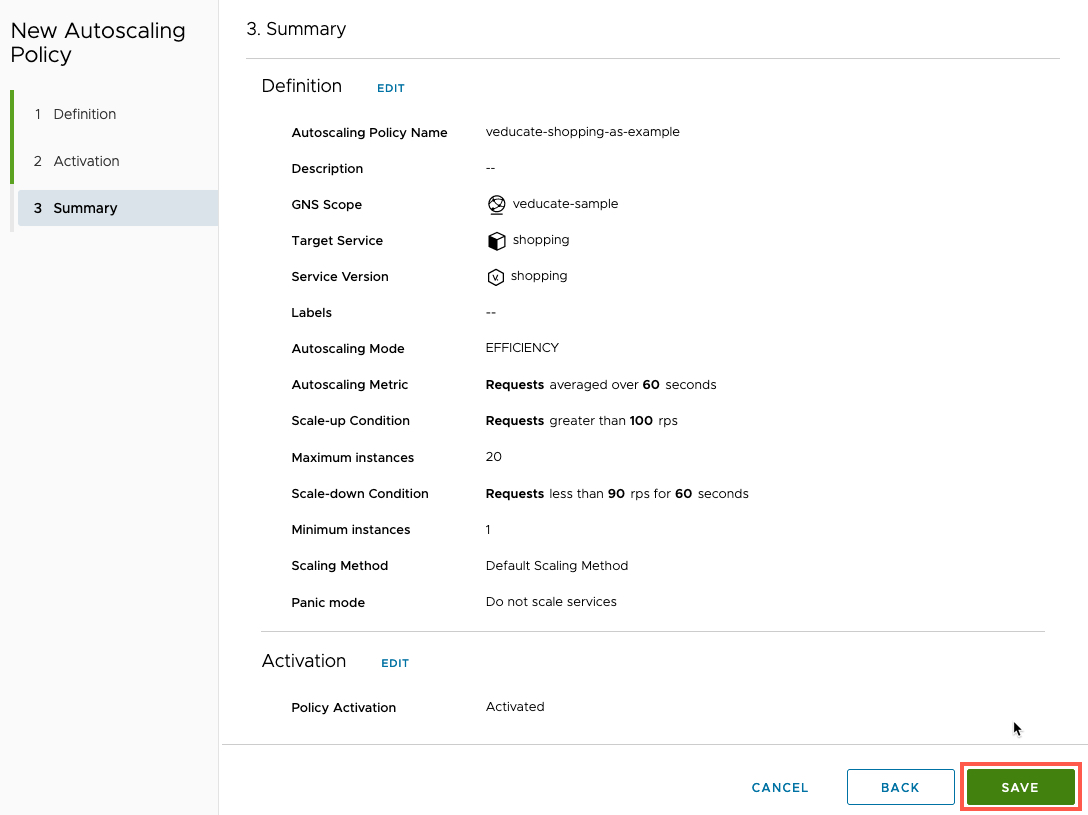
Review the summary and click Save.
Now we our SLO configured to alert if the health of the Service falls under 99.999% availability, and the autoscaler will increase the number of pods running the shopping service, should the request number hit an average over 100 rps over 60 seconds polling period.
Seeing the SLO and Autoscaler in Action
Let’s see this in action and the information we can gather from the TSM interface.
First, let’s view the SLO itself, by clicking the SLO name in the interface.
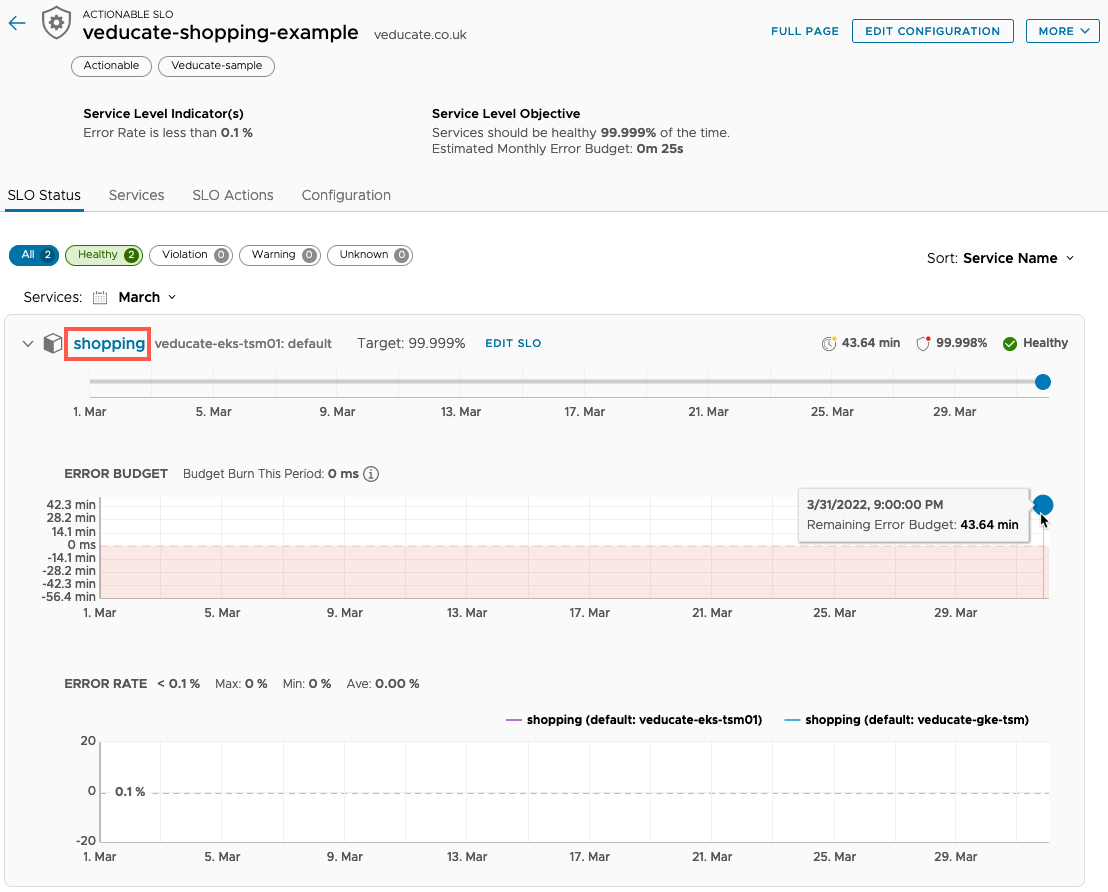
We can see the overall status, the targets for availability and the error budget.
In the next screenshot we are digging into the Service metrics by clicking the Service name in the SLO Policy view (Red Box)
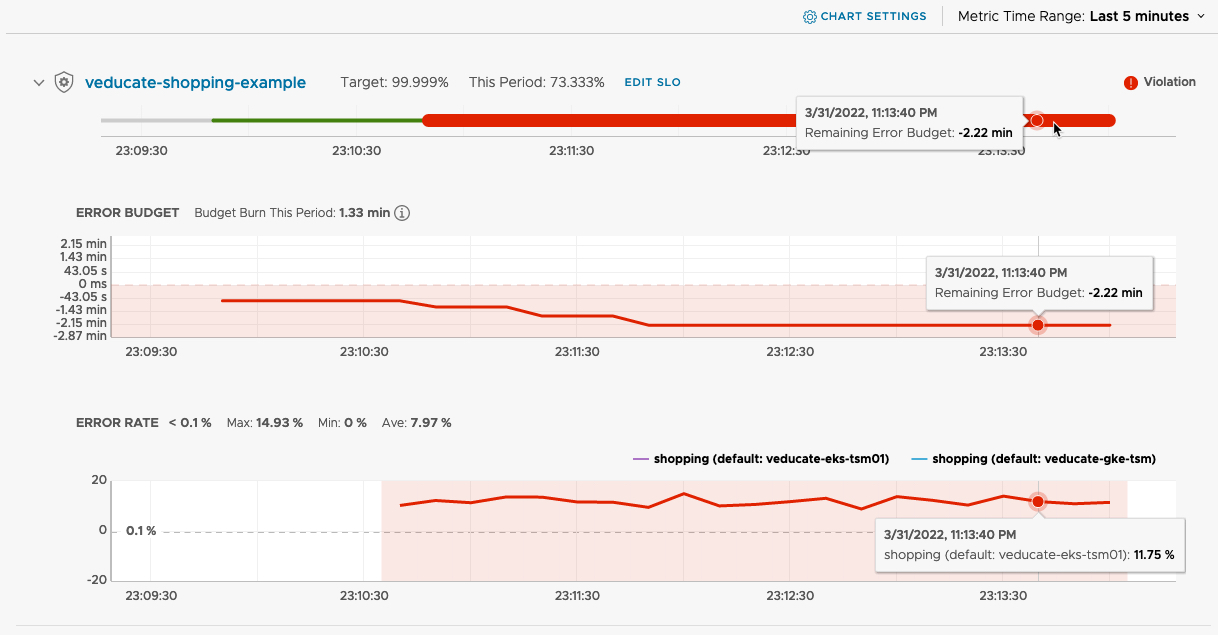
As I’ve moved into this screen, in the background I’ve also kicked off a load generator to hammer my application with web requests to push load to the system.
We can see the status of this service has now changed to “Error”, hovering over this, we can see it’s because the SLO policy is violated.
For the following screenshots, I’ve selected the Performance Tab, so we can see the Service metrics.
We can see the associated SLO for this service, and details about the Error budget and Error rates.
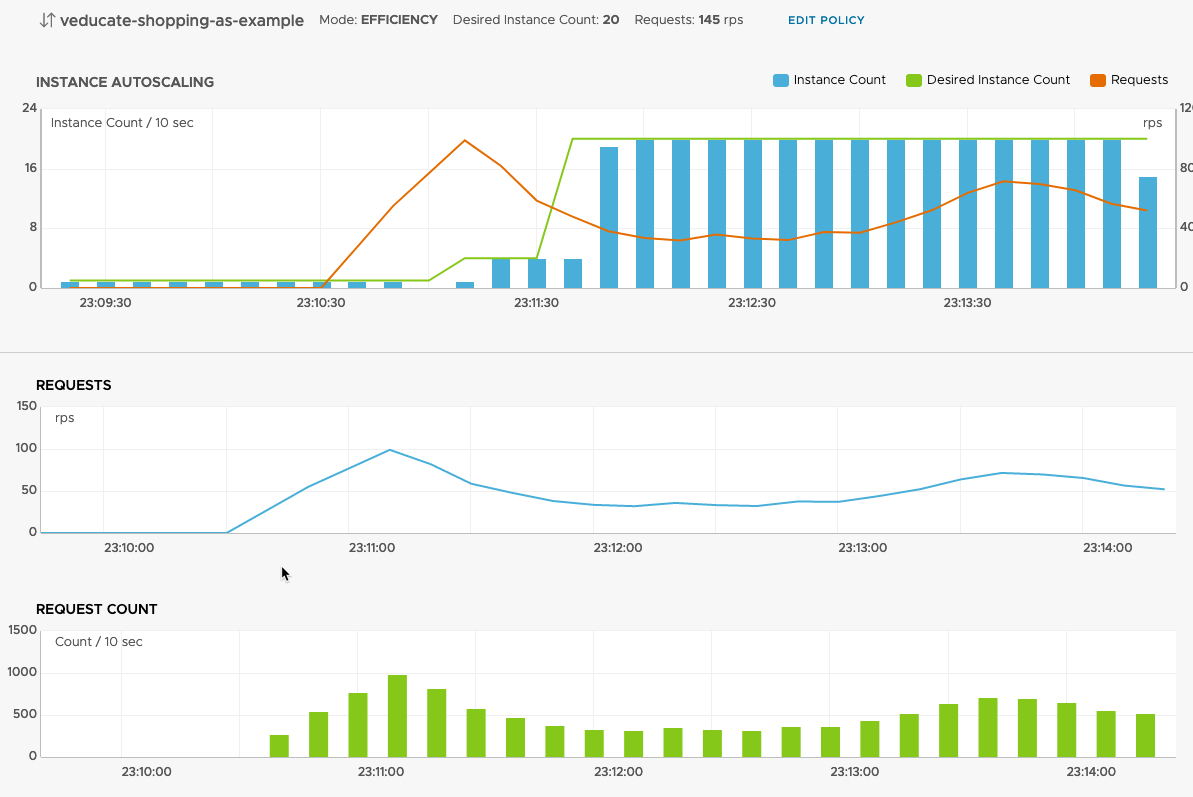
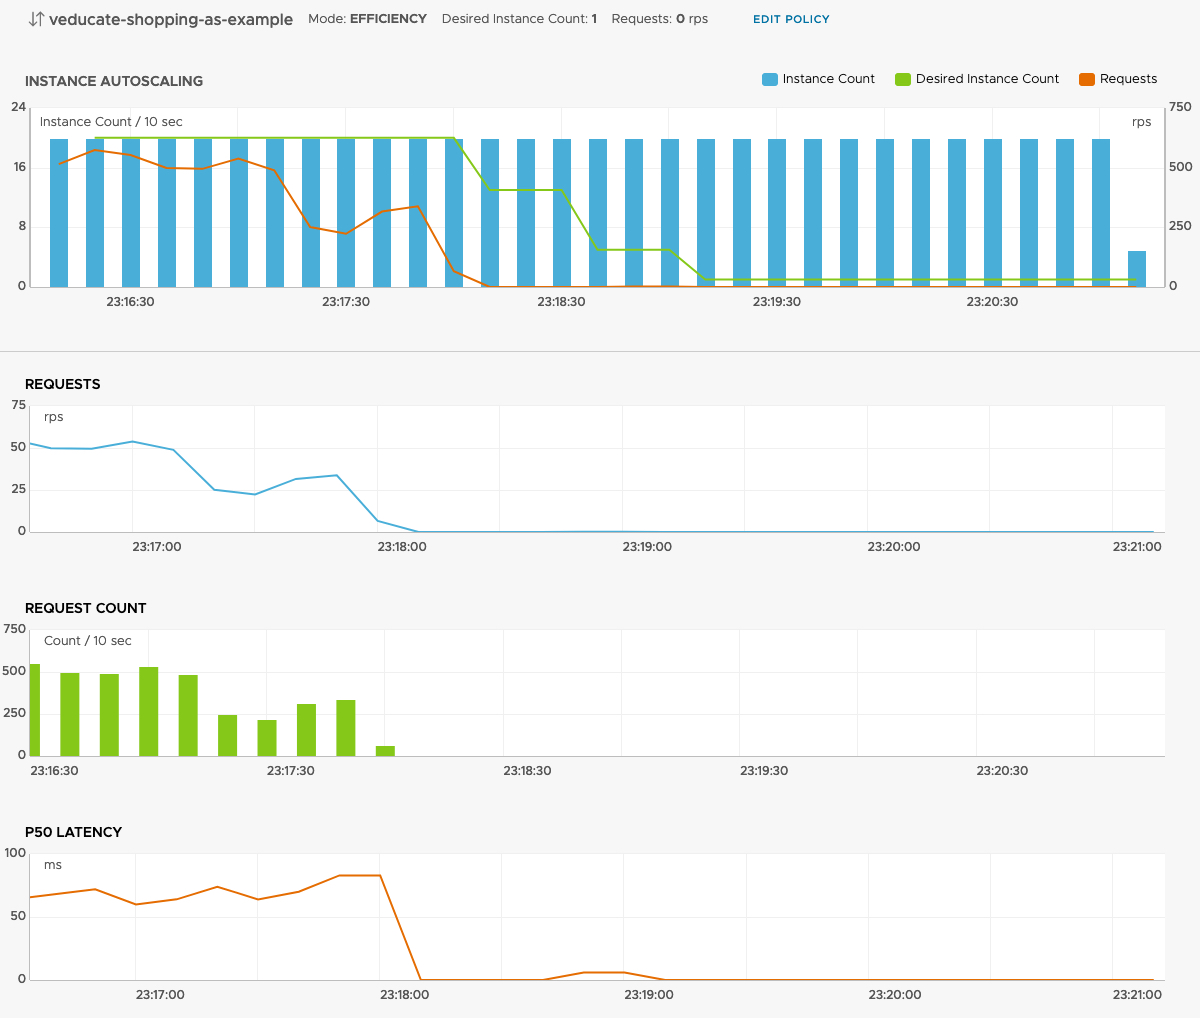
Scrolling further, we can see the Autoscaler policy metrics. This includes the instance autoscaling metrics, charting out the number of instances deployed in the Kubernetes cluster, matched against the desired count from the policy, and the requests (the metric used to trigger the policy).
Essentially from these three charts, we can see how our Autoscaling policy is being implemented in real-time.
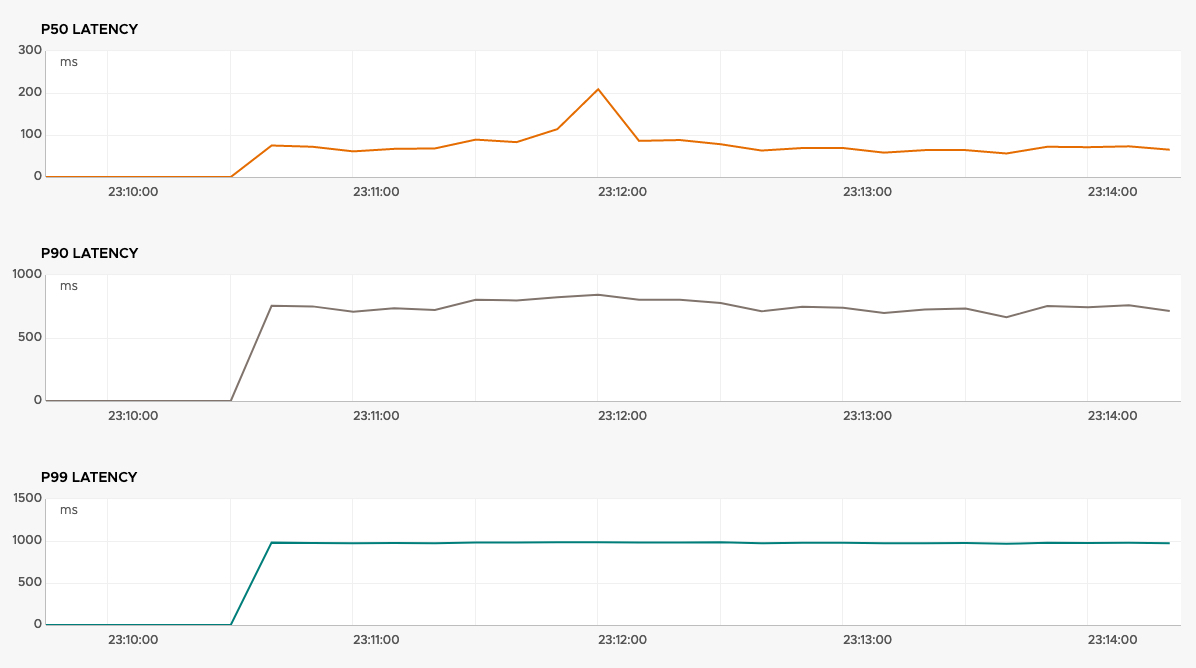
Further down this performance view, we can also see the other metrics including the P50, P90 and P99 Latency. In my example, these are not used for the autoscaling policy or SLO, but I can use these charts to decide if these are better metrics to use, and what values should work best.
You can read more about these metrics here.
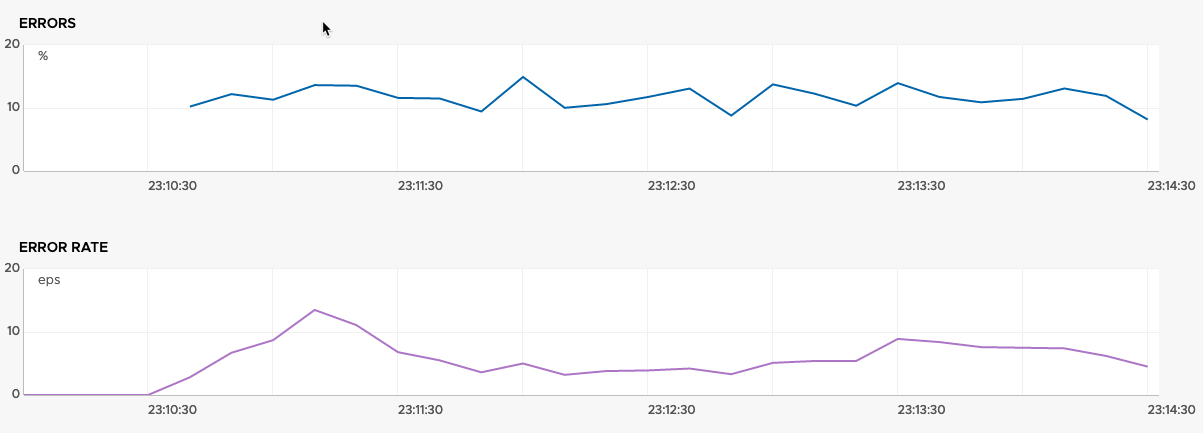
Finally, we have the errors and error rate of the service.
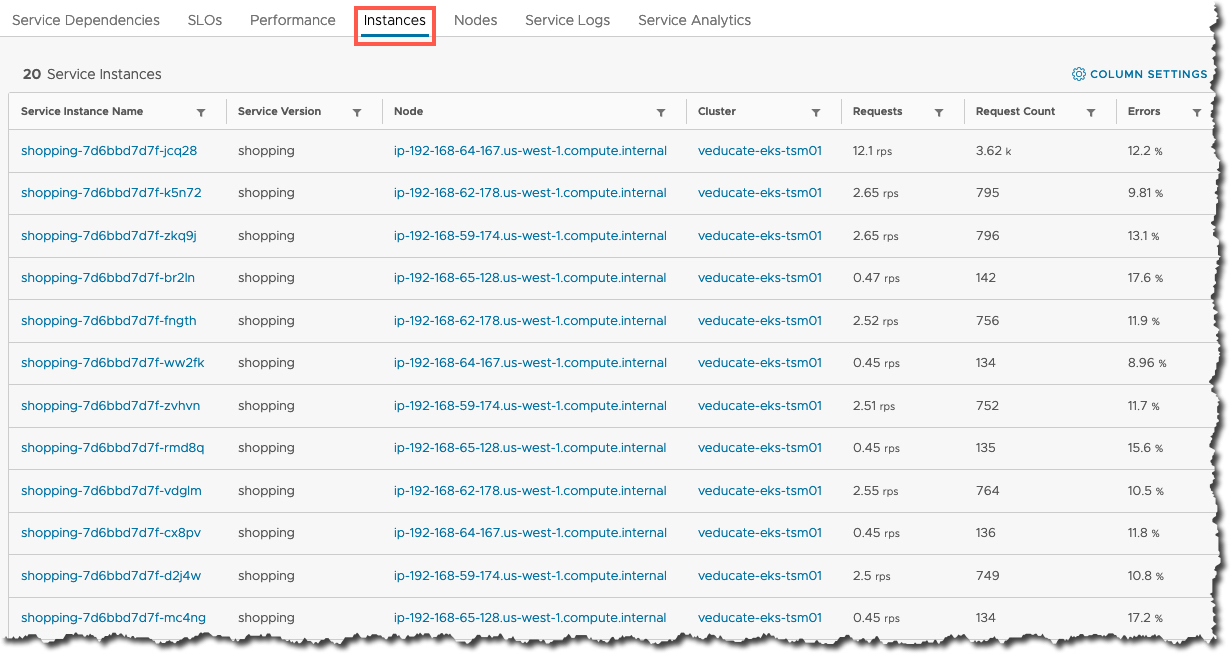
Moving to the Instances tab, I can see all the deployed instances (Kubernetes pods) in my Cluster for the Shopping service, and the high-level metrics, we can see the load is not exactly distributed here. Something maybe to dig into in the future.
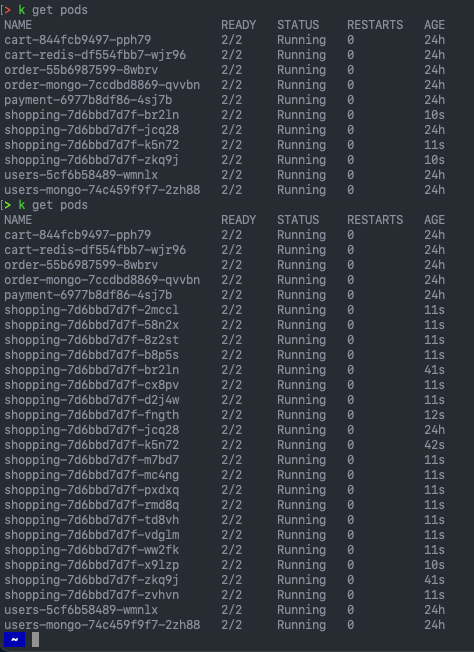
Below I capture a quick “kubectl get pods” output, just showing as I re-ran the command, the number of pods increasing in my environment as the autoscaler policy takes affect.
To wrap up, going back to the autoscaling policy metric view in TSM, to show what happens when I’ve stopped the load generation tasks. TSM scales down the number of instances in my environment as the requests return below the configured values, and the SLO returns to a healthy status.
Summary and wrap-up
As you can see, this is a powerful feature, but simple to configure, monitor and tweak. TSM gives you all the necessary information surfaced for you to view within the UI. I used a little of an extreme example for the policy configuration so that I could show the features working for this blog post.
One of the other areas that I liked, in the documentation VMware also provides you a number of example use-cases and walks you through the configurations and the theory on which metrics to use and when for the policies.
Regards

