
In this blog post, I am going to cover the configuration and consumption of the Tanzu Observability integration with vRealize Operations Cloud.
- As this is blog post is released during VMware Explore, under the announcement of the VMware Aria brand for Cloud Management tooling, these products will become
- vRealize Operations Cloud > VMware Aria Operations
- Tanzu Observability > VMware Aria Operations for Applications
Recording
Below is a recording I put together, covering the same content as this blog post in 10 minutes or less.
Create a Cloud Services Portal API Token
The official documentation for this integration can be found here.
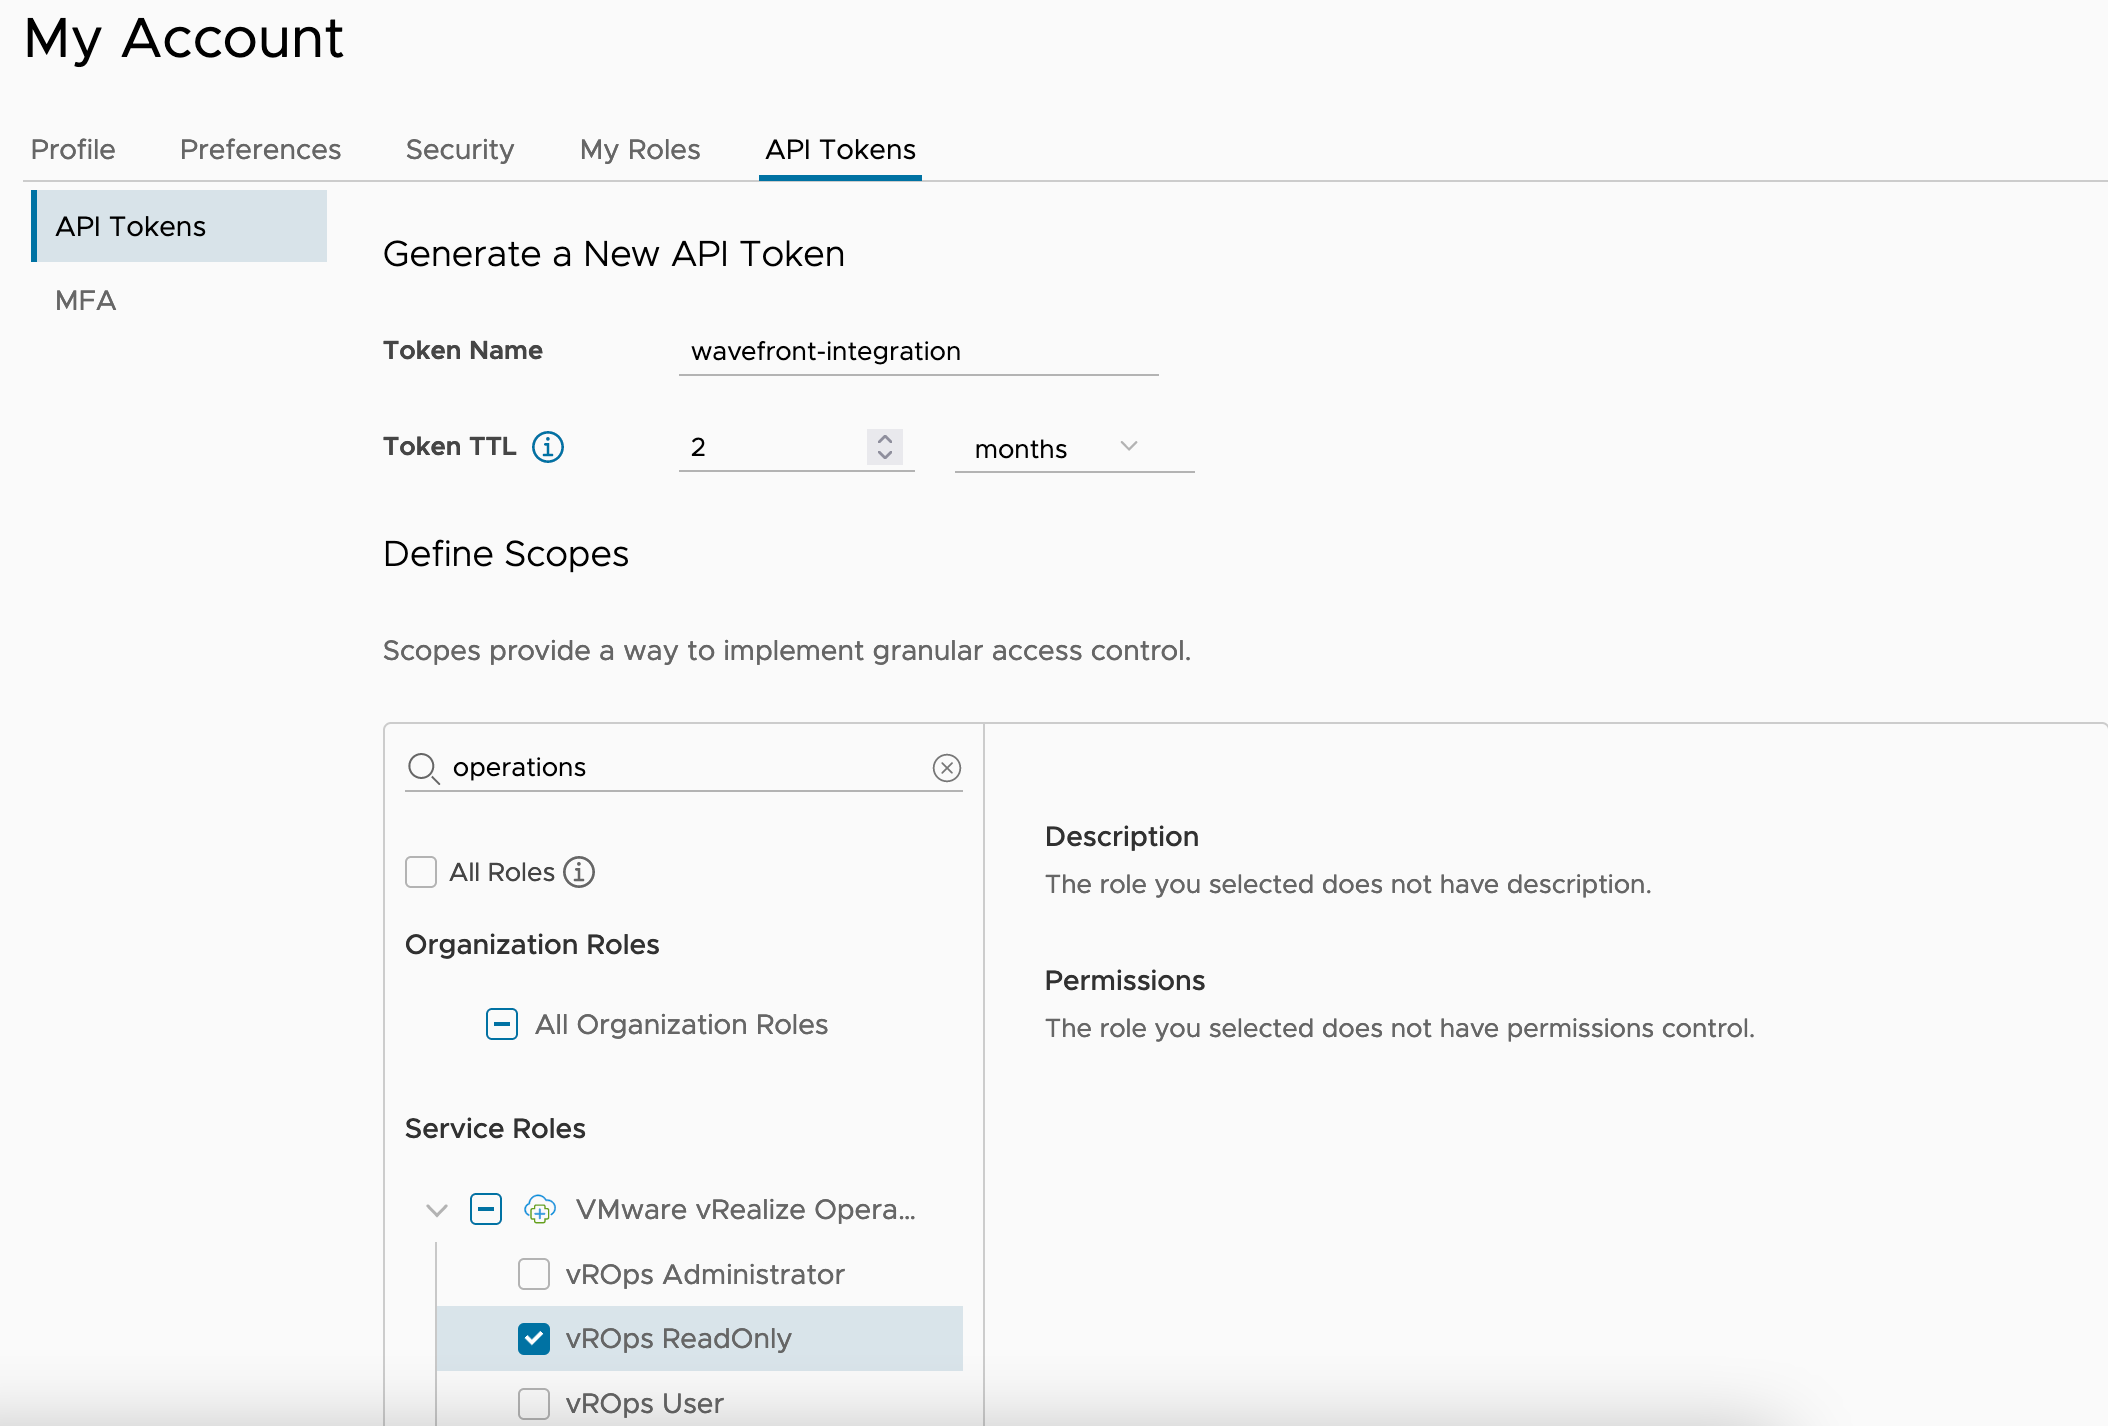
First, we need to create an API token that provides the following access:
- Organisation Member
- vRealize Operations Cloud > vROPs ReadOnly
Go to My Account in the CSP by clicking on your name in the top right-hand corner, then My Account. Select the API Tokens tab and generate an API token.
Save the API Token to a safe space for use in the next step.
Configure the vROPS Cloud integration in Tanzu Observability
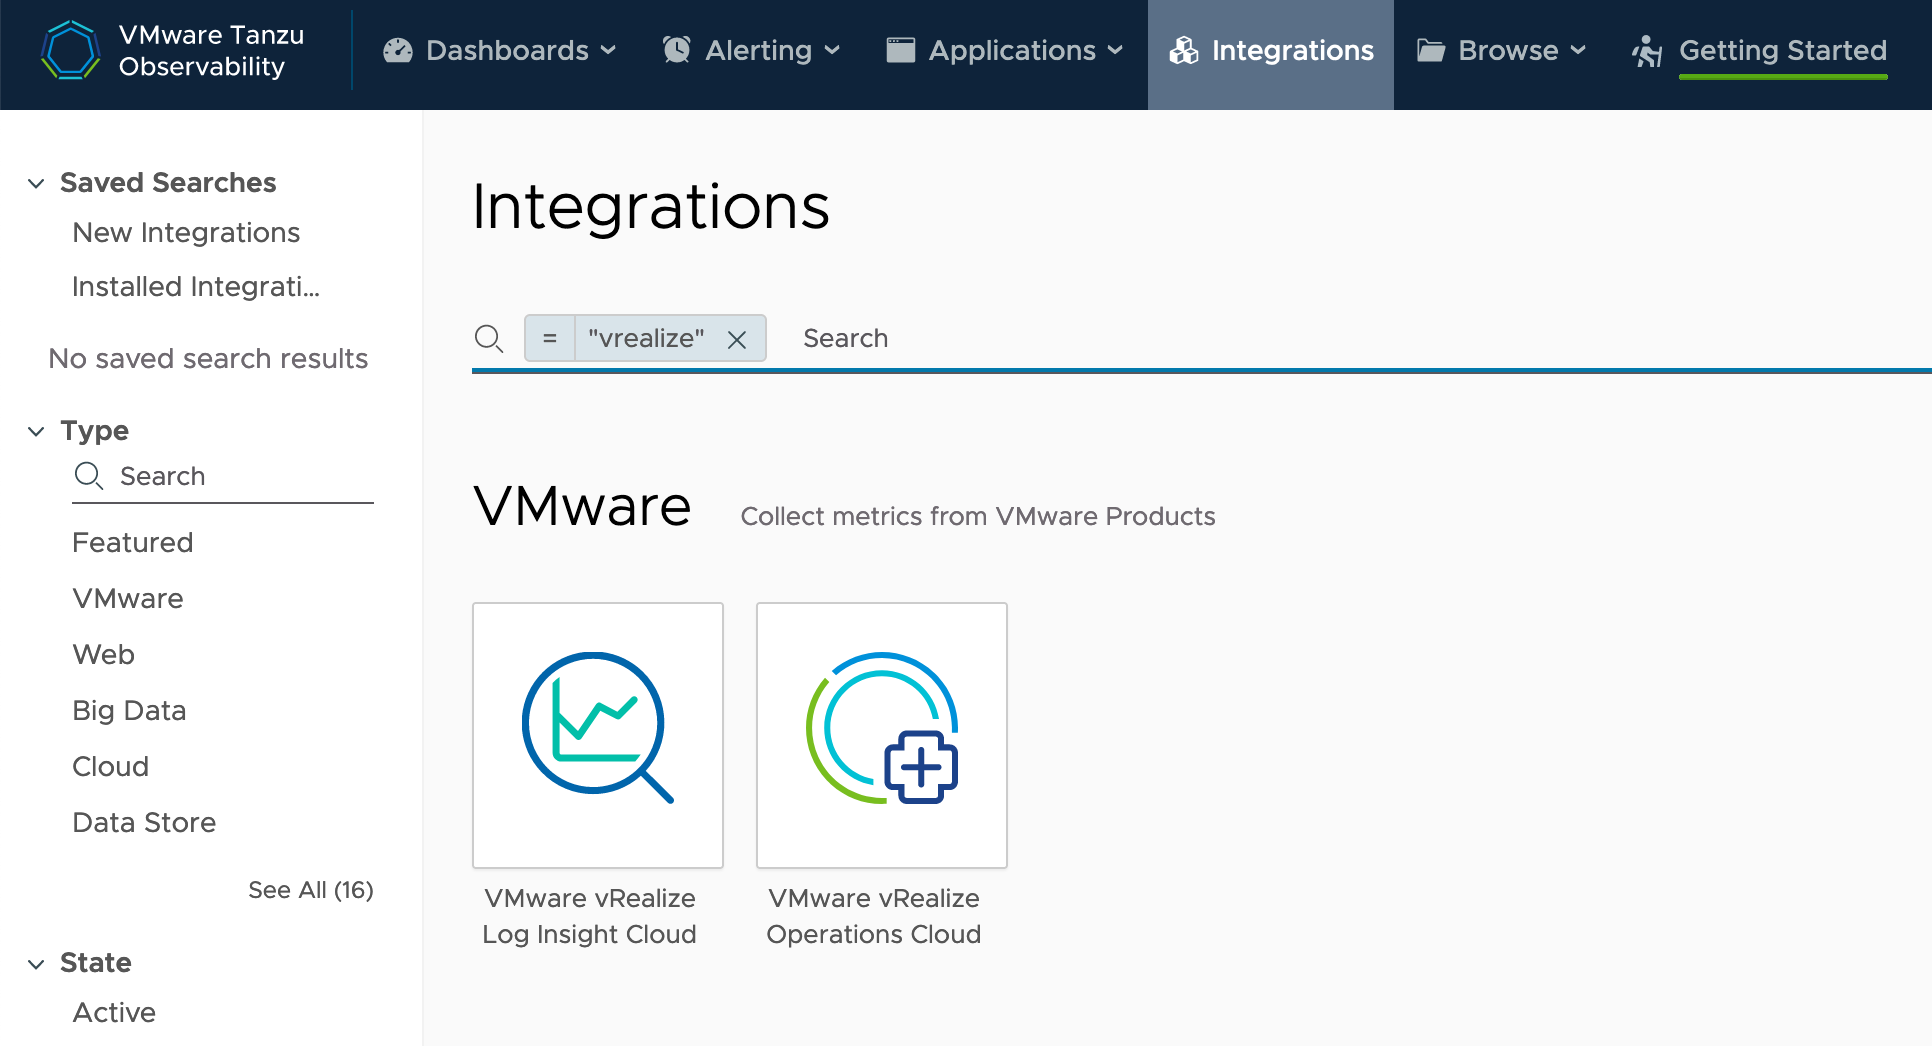
In the Tanzu Observability UI, click the Integrations tab, then search for "vRealize" and select the "VMware vRealize Operations Cloud" Tile.
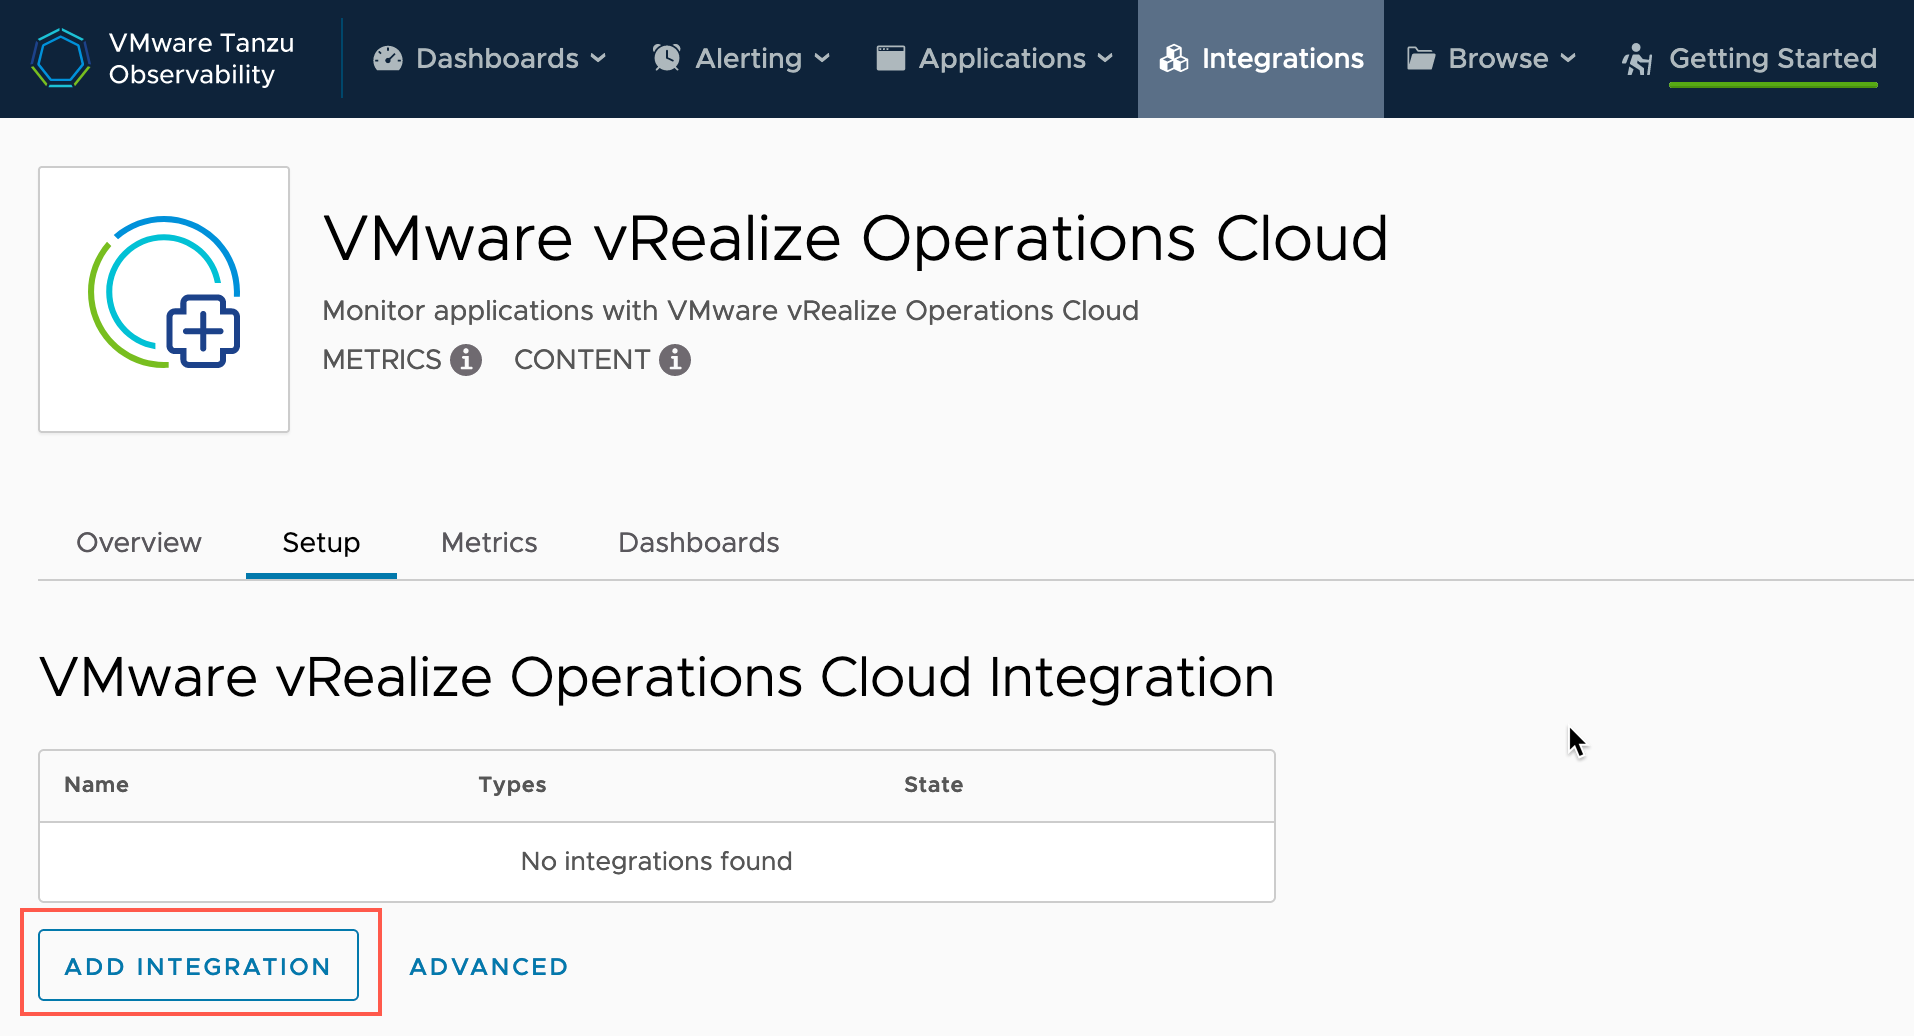
- Click the Setup Tab
- Click the "Add integration" button
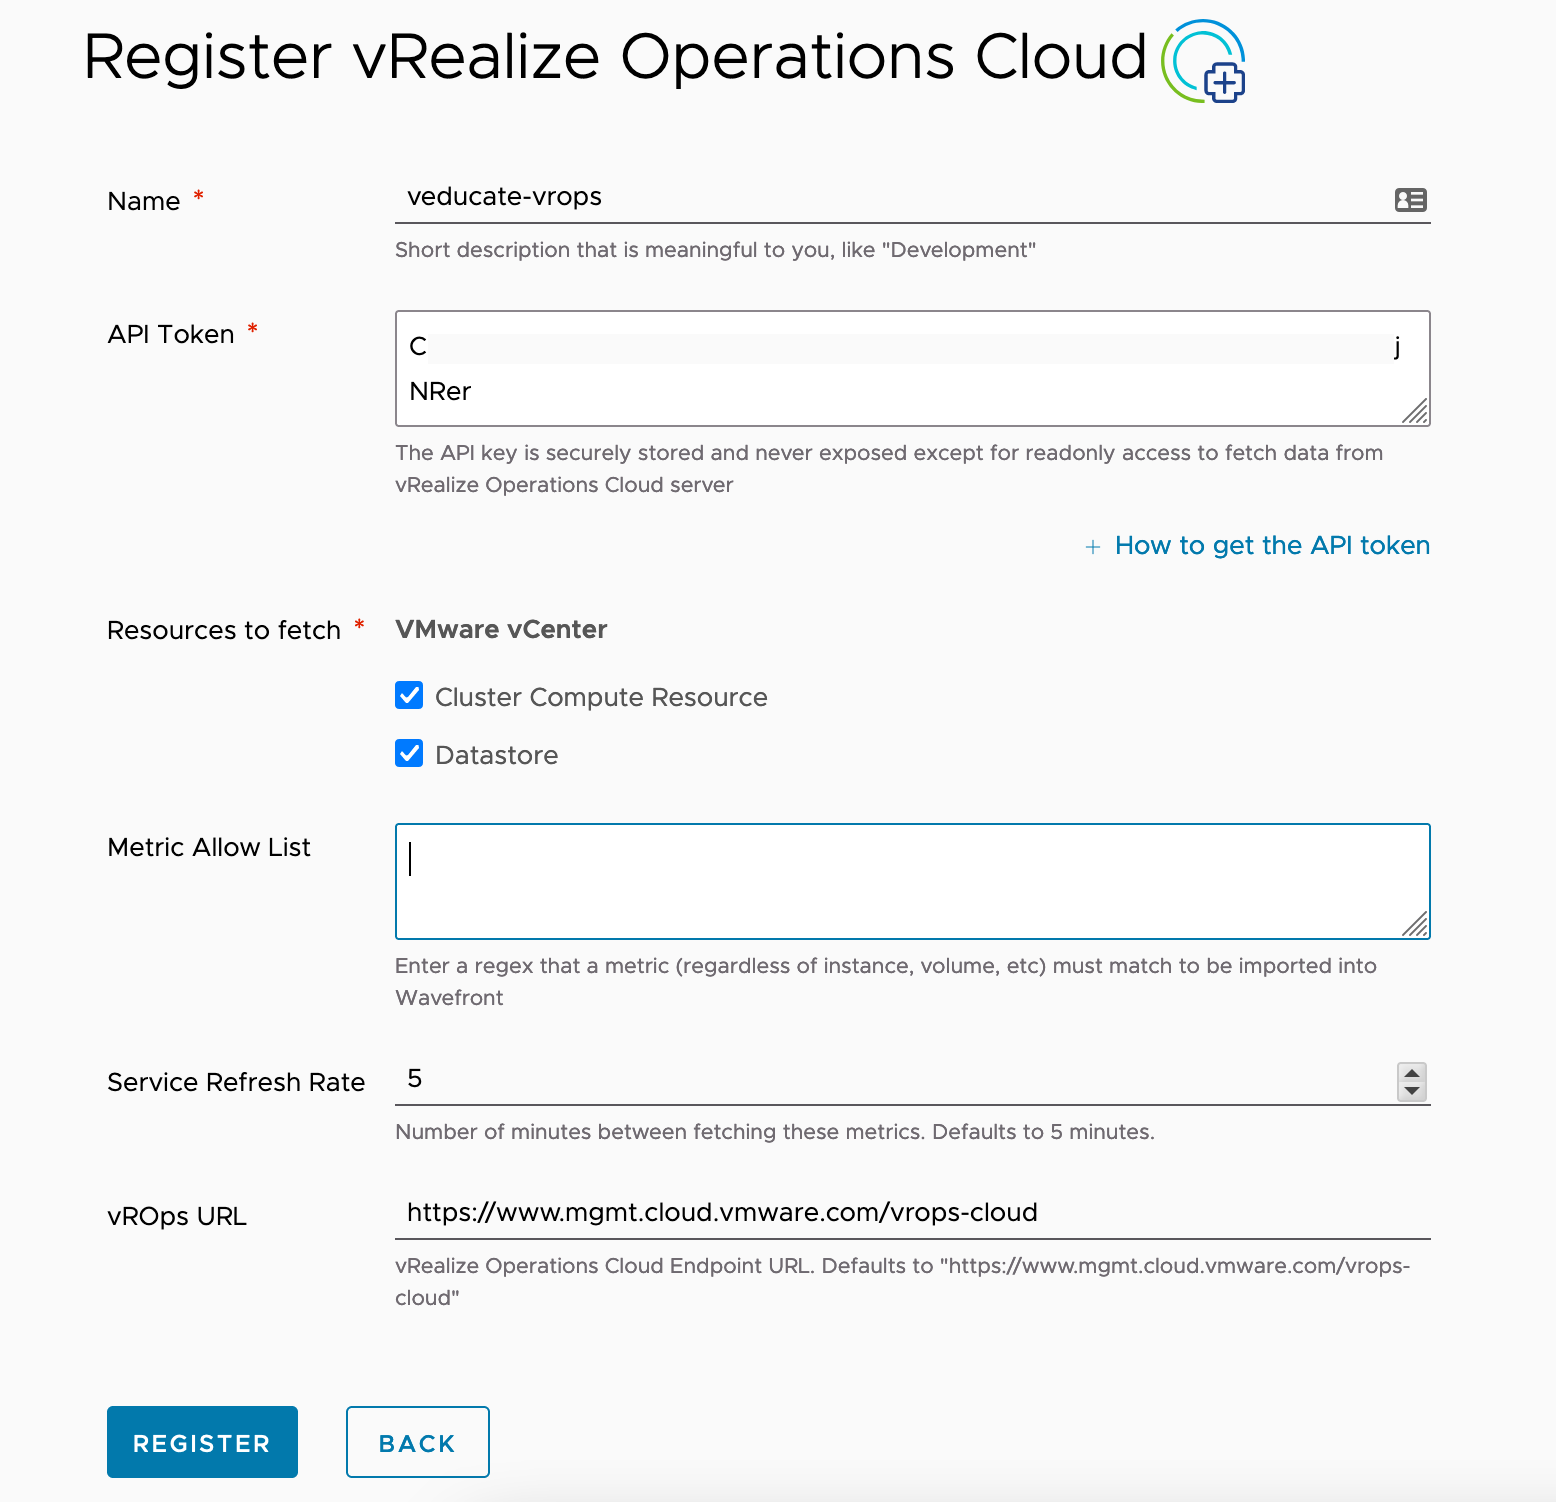
- Provide the name for the integration
- Input the API token generated earlier
- Select which resources to fetch
- Configure which metrics to collect
- An empty configuration, collects all metrics, see the official docs for an example on how to filter the metrics
- Set the refresh rate to pull data - default is 5 minutes
- Set the vROPs Cloud URL
- https://www.mgmt.cloud.vmware.com/vrops-cloud
- I've personally never seen a different URL than this, as your access is governed by the CSP/API token
- Click Register
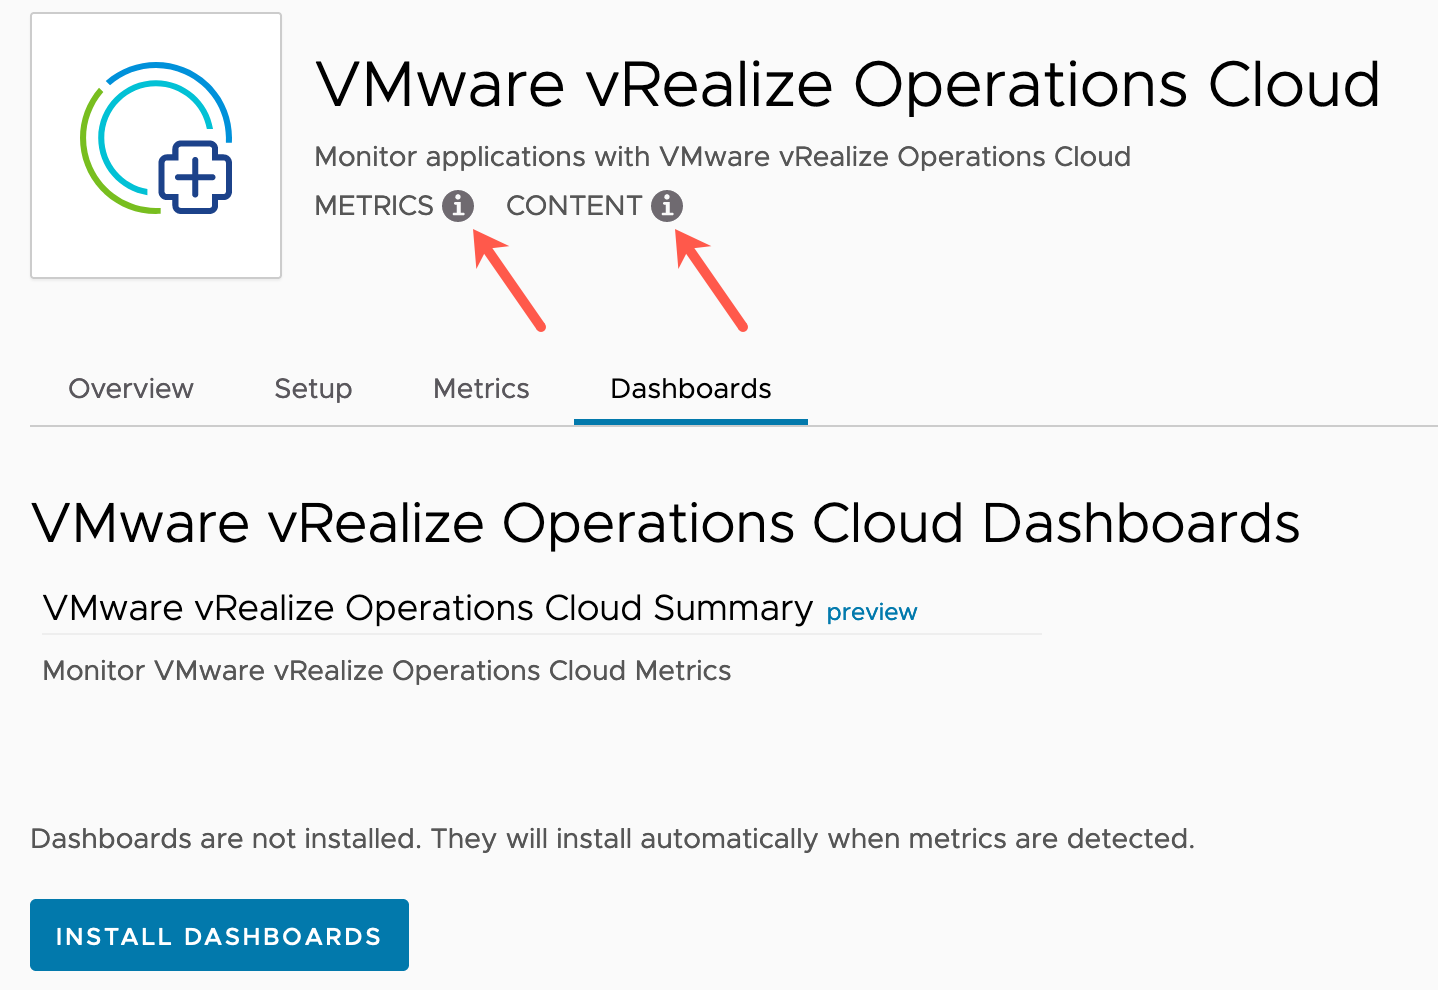
Once configured, you need to wait for the Metrics/Content (red arrows) to change from a grey status to green.
The Dashboards can be installed manually as per the below screenshot, or they will be installed automatically once metrics are received into Tanzu Observability as part of the integration configuration.
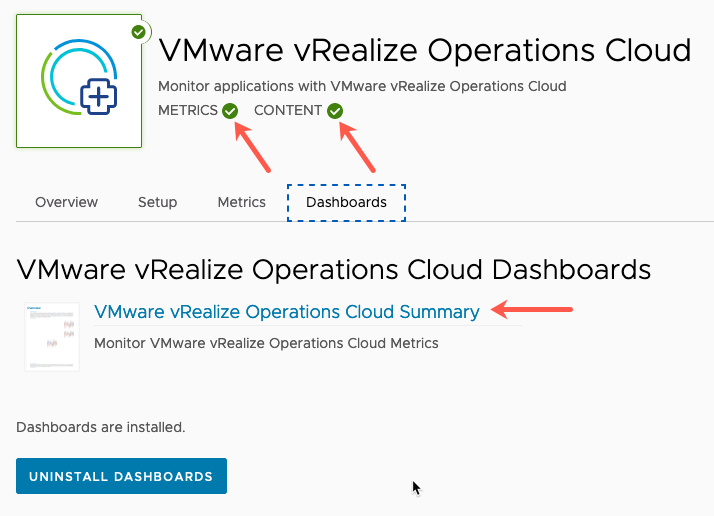
Below you can see the status changing to green ticks, and the dashboard automatically installed.
Viewing the vRealize Operations Cloud Summary Dashboard
Click on the dashboard link in the previous screenshot or find it in the Dashboard list from the Dashboard UI view.
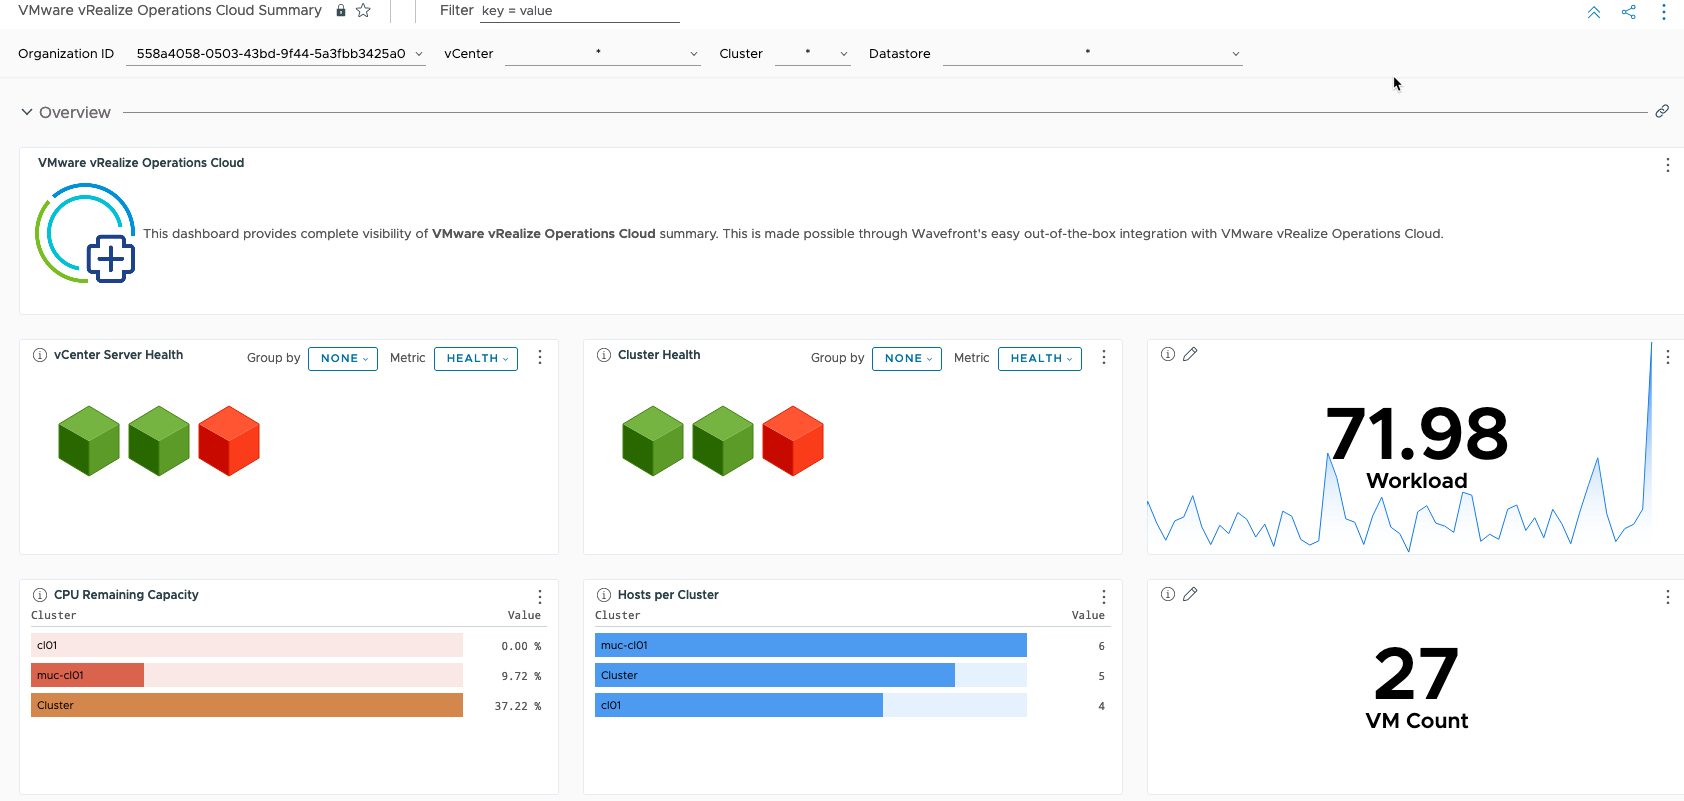
At a high level, you can filter from the top-level options on the dashboard, and set the time for the dashboard (not shown on the below screenshot, it's above the filter).
The overview dashboard shows the health badges from vROPs for vCenters and Clusters, and workloads. Also monitored VM count during the last collection.
Scrolling down the dashboard we can see health of datastores, and cost information as well.
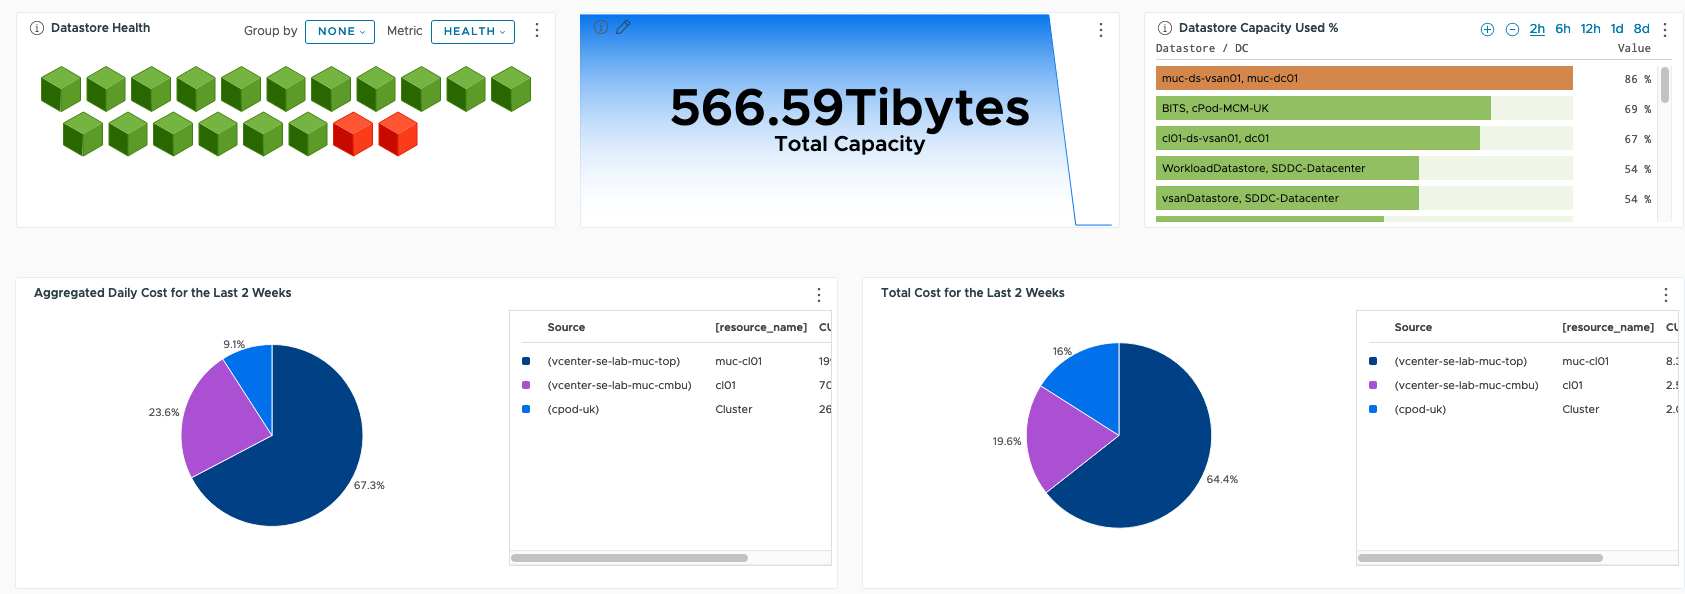
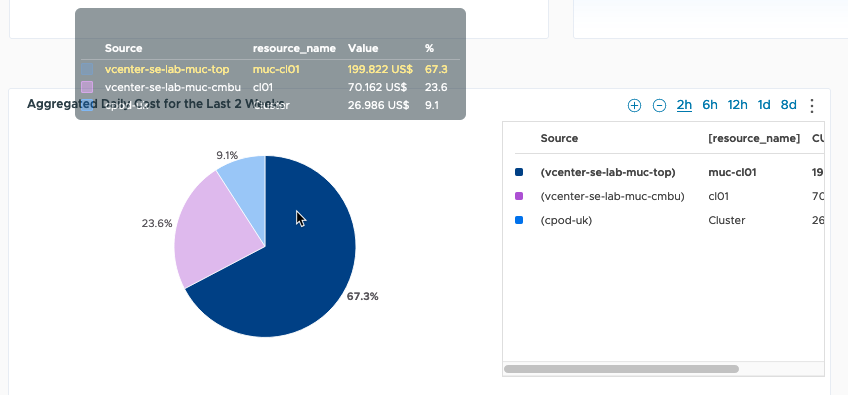
For the charts in Tanzu Observability, you can hover over them to find additional information for the time point (line graphs). In the below, for the pie chart, we can see the chart is based on cost allocation %, hovering over this shows the values of those costs that make up the total. Scrolling on the legend includes this information too.
Cloning and adding charts to a dashboard
The overview dashboard is good. But we know there's over 200 metrics collected by the integration. So now we'll explore how to edit the dashboard to include additional metric data.
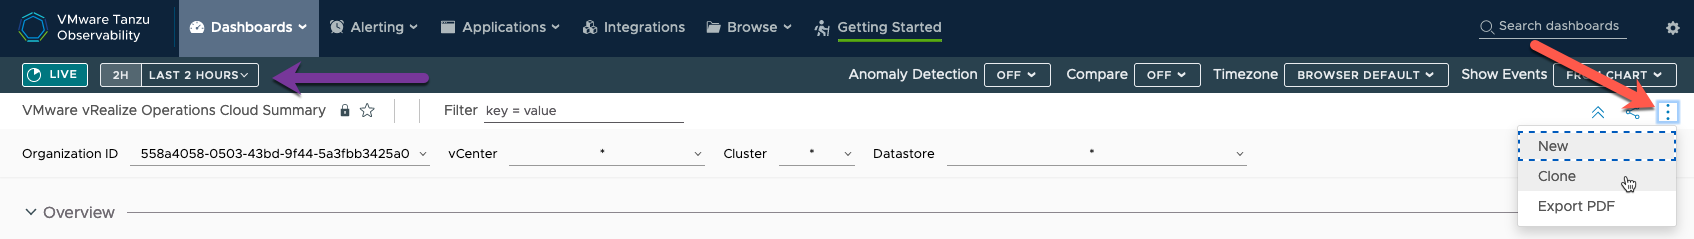
We cannot edit the out of the box dashboards provided by the integration. So instead, we can clone this existing dashboard, by clicking the three dots in the top right hand corner, and clicking clone.
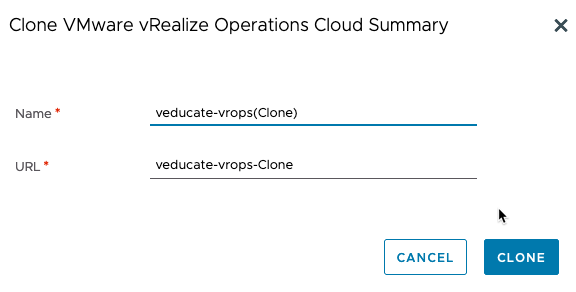
Provide a name for the new dashboard, the URL will autocomplete, you have the ability to edit it. Click Clone.
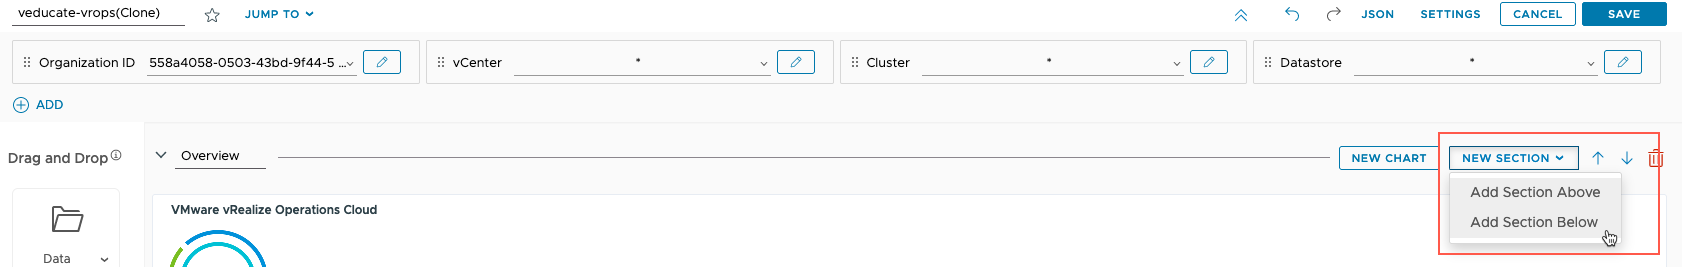
This will take us into the dashboard editing mode for the cloned dashboard.
Tanzu Observability can break a dashboard into sections, with charts as part of a section. This is useful to help organise your dashboards.
Hover over the section and click to add a new section below.
Scroll down and find the new section, on the left side, you can provide a name for the section.
On the right hand side, click to add a new chart.
![]()
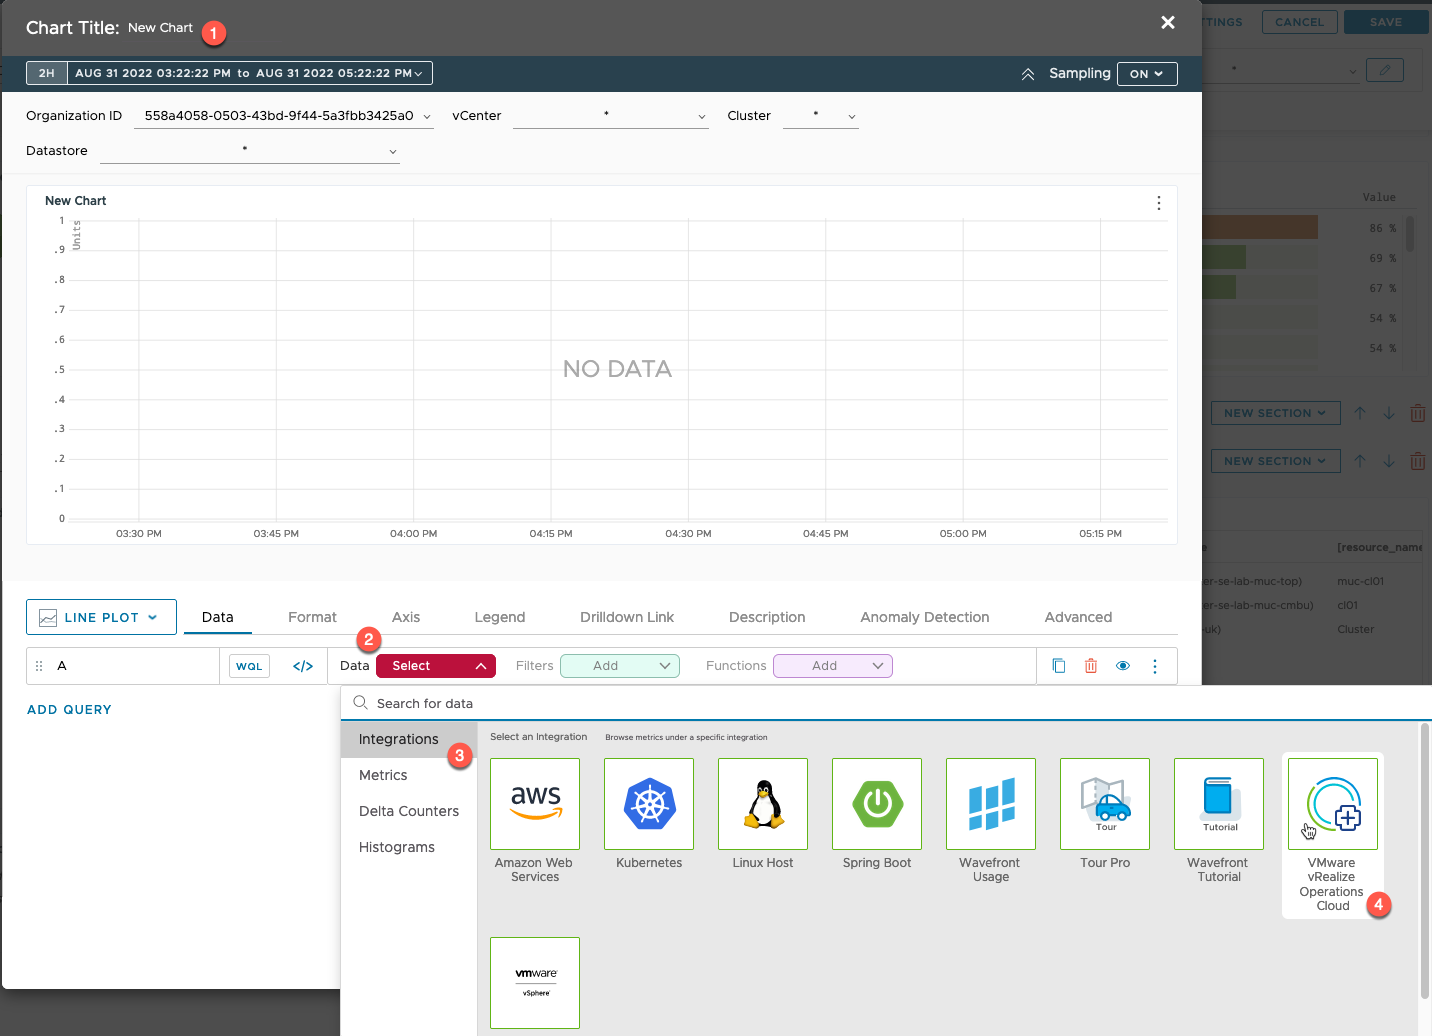
In the Chart Builder view:
- Provide a name
- Select to add the first query by clicking data and the red "select" box
- You can provide a name for the query on the left-hand side where it says "A"
- Select Integrations and then vRealize Operations Cloud
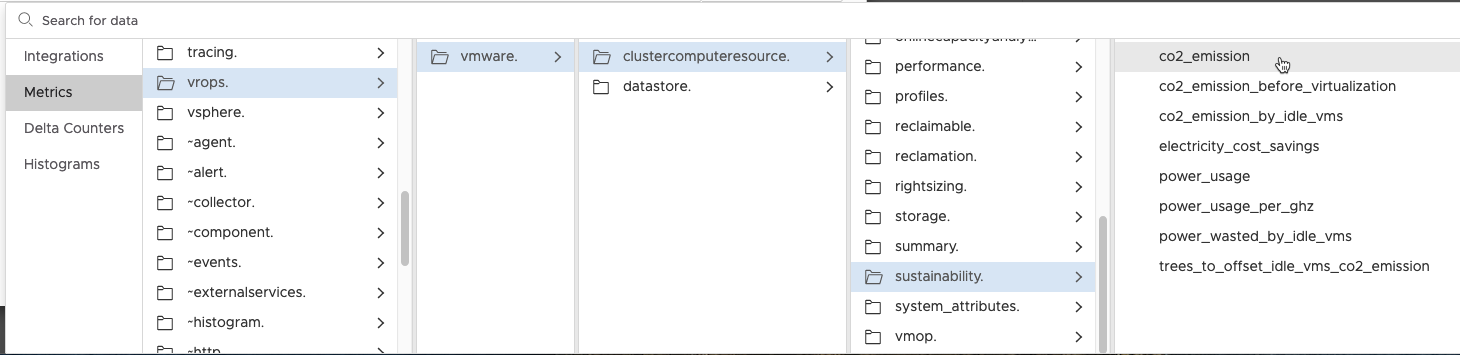
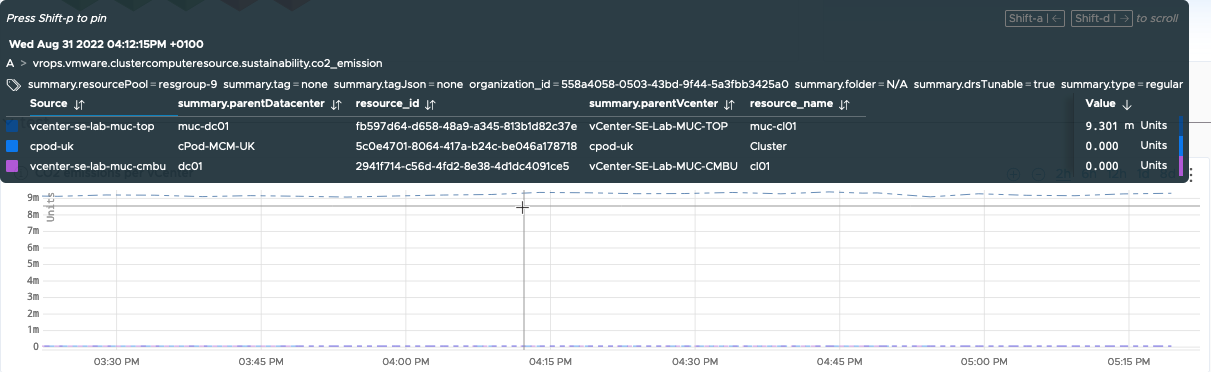
Now browse through the metrics you are interested in. Below I am picking the Sustainability metric "CO2 Emissions".
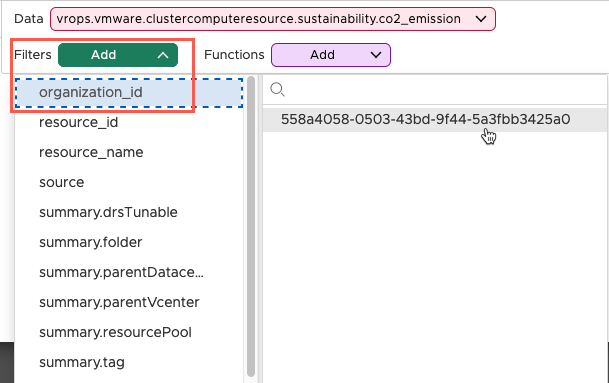
Next, I'll select the filter option (green "add" box), and set the filter to my vROPS Cloud Org ID.
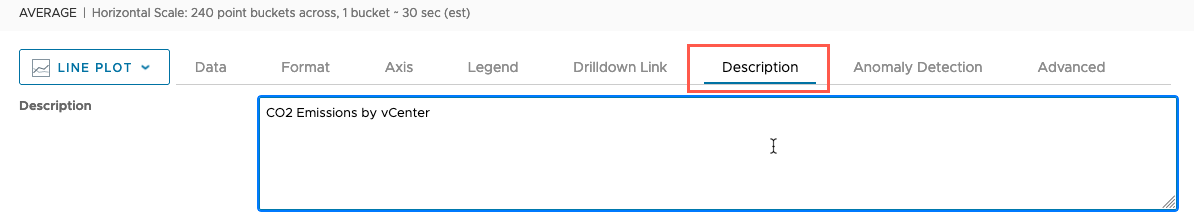
Along the tabs, I'll set a description for the chart. Check out the recording for more information about the other tabs.
Below you can see I've set the name for the chart. And I've finished by clicking save on the chart builder view, then clicking save on the edit dashboard view.

Now we can see on our dashboard the new section with the new chart added.
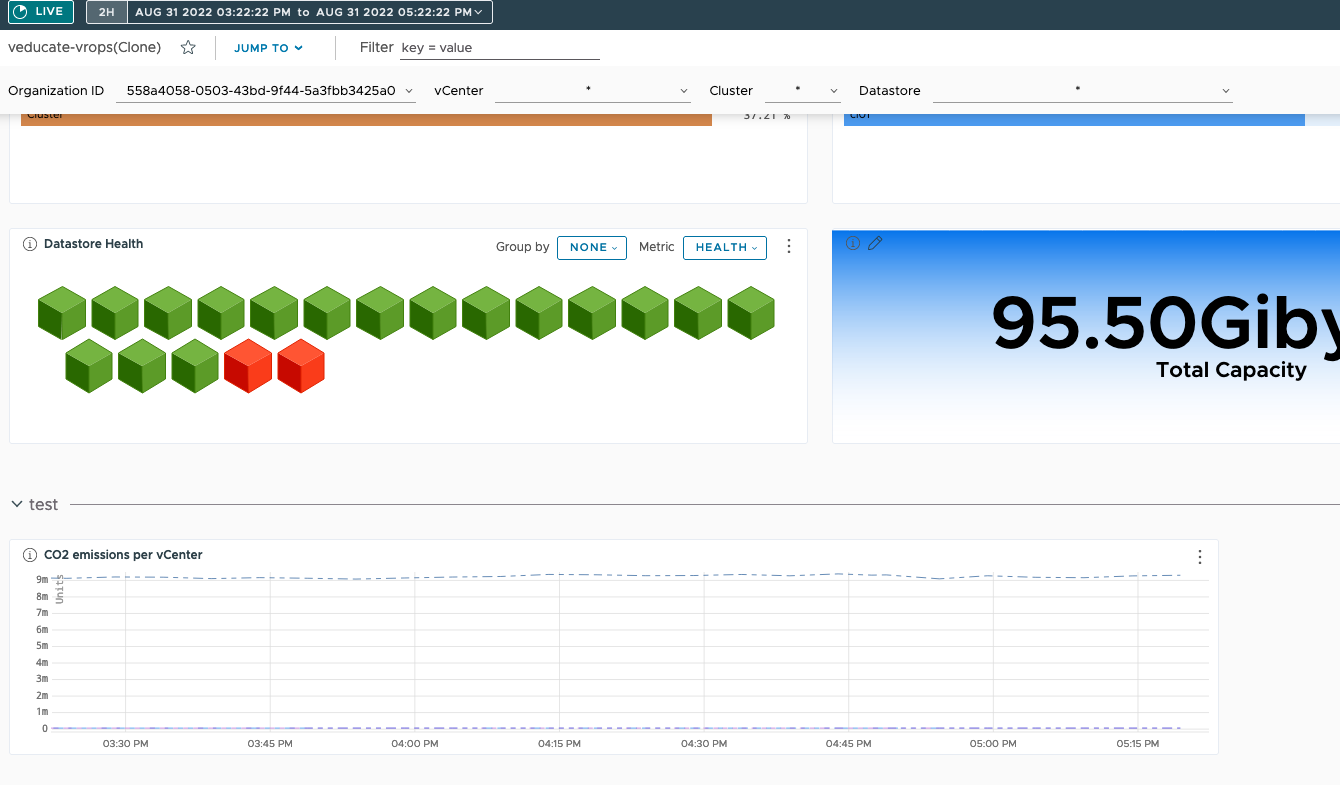
If I hover over the chart, I get more details about the metrics being shown.
A very simple use case, but hopefully you can see how easy it is to get started building your own customized dashboards and charts.
Summary and wrap up
As you can see, the integration is quick and simple, the way it should be. Once completed, additional metrics and contextual data will be available in Tanzu Observability, so that you can chart out metrics for your vSphere platforms alongside your application data.
Regards