Whilst reading some of the older vRealize Operations documentation, I stumbled on something I didn’t think was possible.
- The ability to create interactions between separate dashboards.
At first, I thought could not be correct? I don’t remember seeing this option. But sure enough it’s there. So, I thought I’d write a quick blog about it and share to the world.
- You can apply sections or context from one dashboard to another. You can connect widgets and views to widgets and views in the same dashboard or to other dashboards to investigate problems or better analyze the provided information.
Configuring Interactions between Dashboards
First, I’ve created two dashboards, which are based on the old troubleshooting dashboards. Both dashboards have an Object Picker List to filter the various related objects on each dashboard.
- Dashboard-1 – Troubleshoot Cluster
- Dashboard-2 – Troubleshoot VM
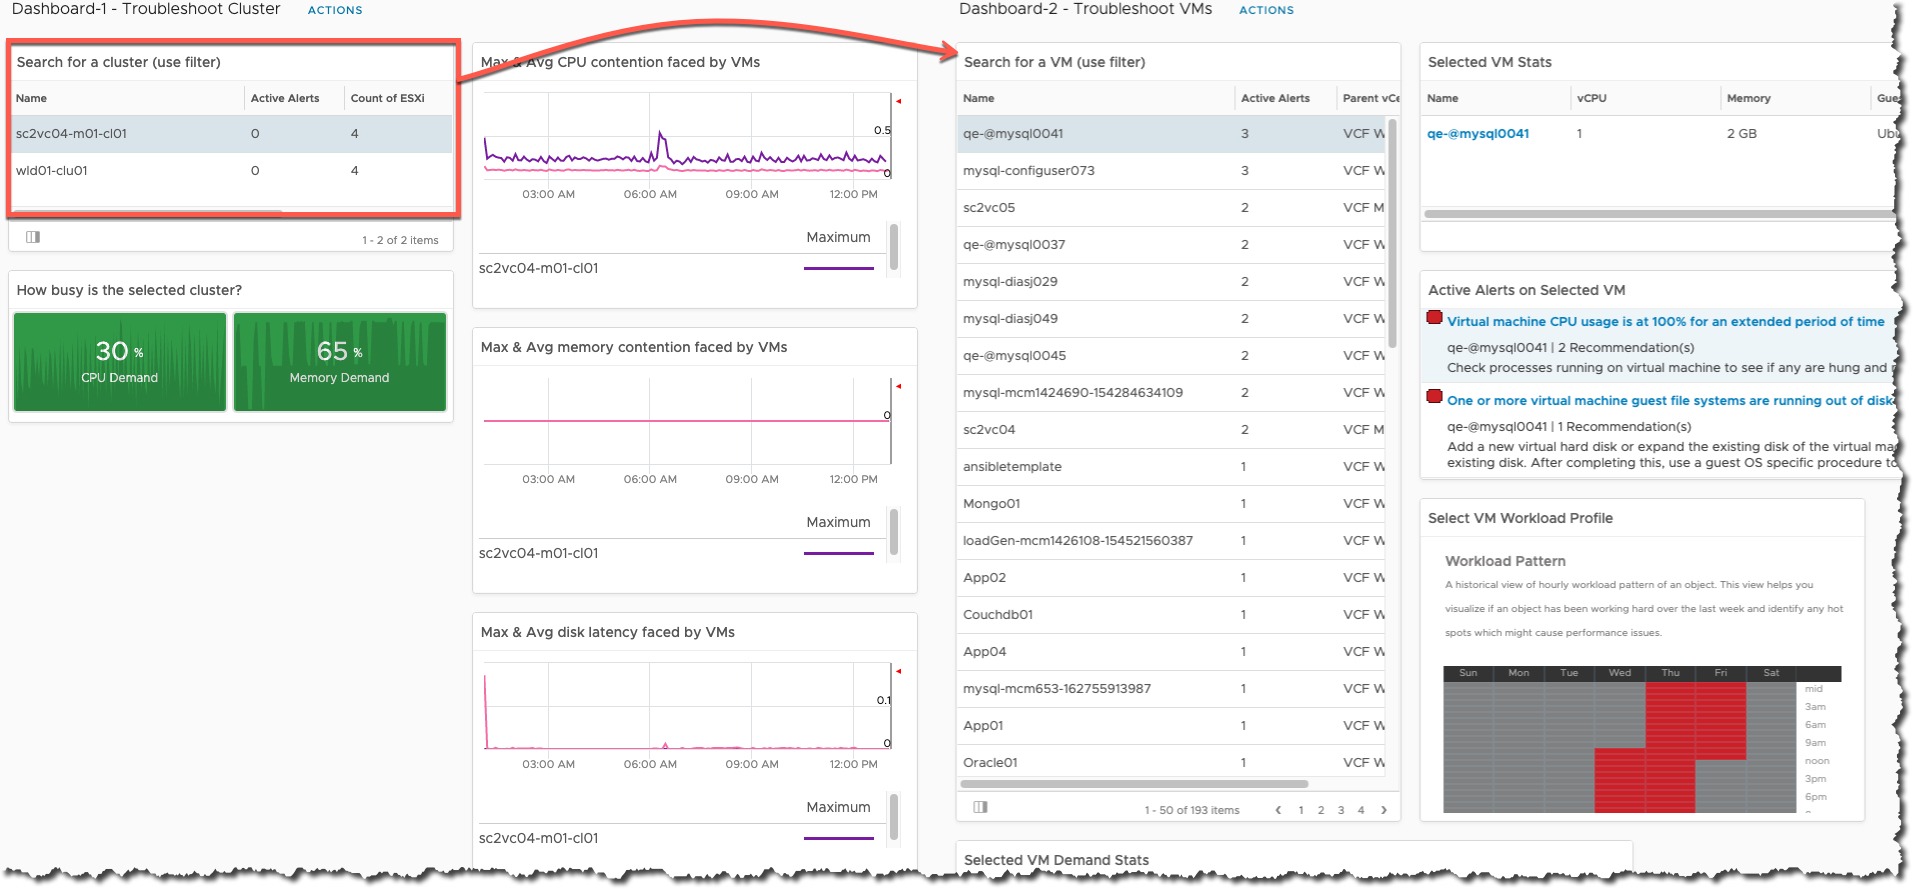
The premise is simple, when I select a Cluster object from Dashboard-1, I want the list of VMs to be filtered in Dashboard-2, to those only in the selected Cluster.
First let’s edit our first Dashboard that we want to be the provider to the second dashboard (Dashboard-1 in my example).
- Click Edit when the dashboard is loaded
- Select “Show Interactions”
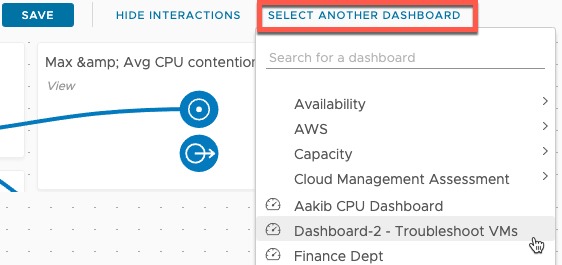
- Click “Select another dashboard” and choose your dashboard from the list
- For my example, it’s Dashboard-2
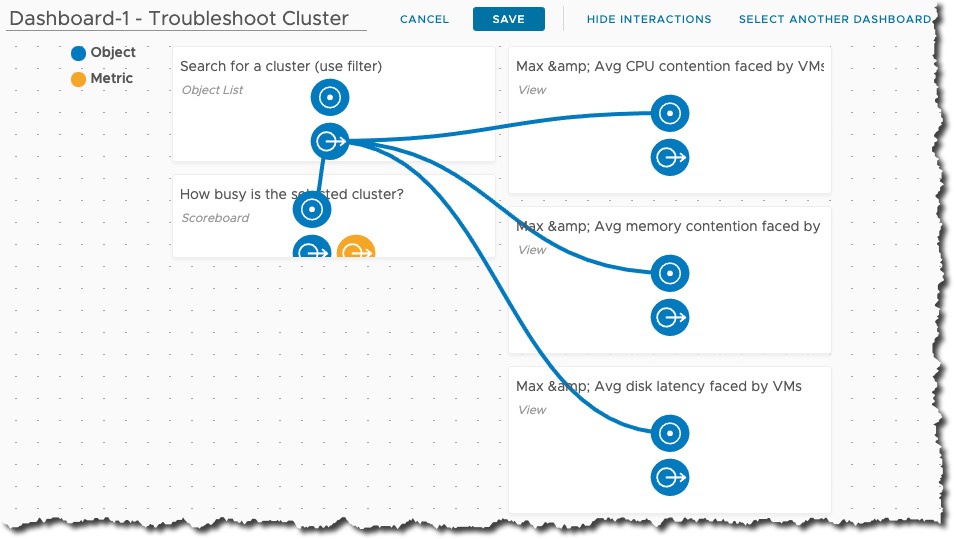
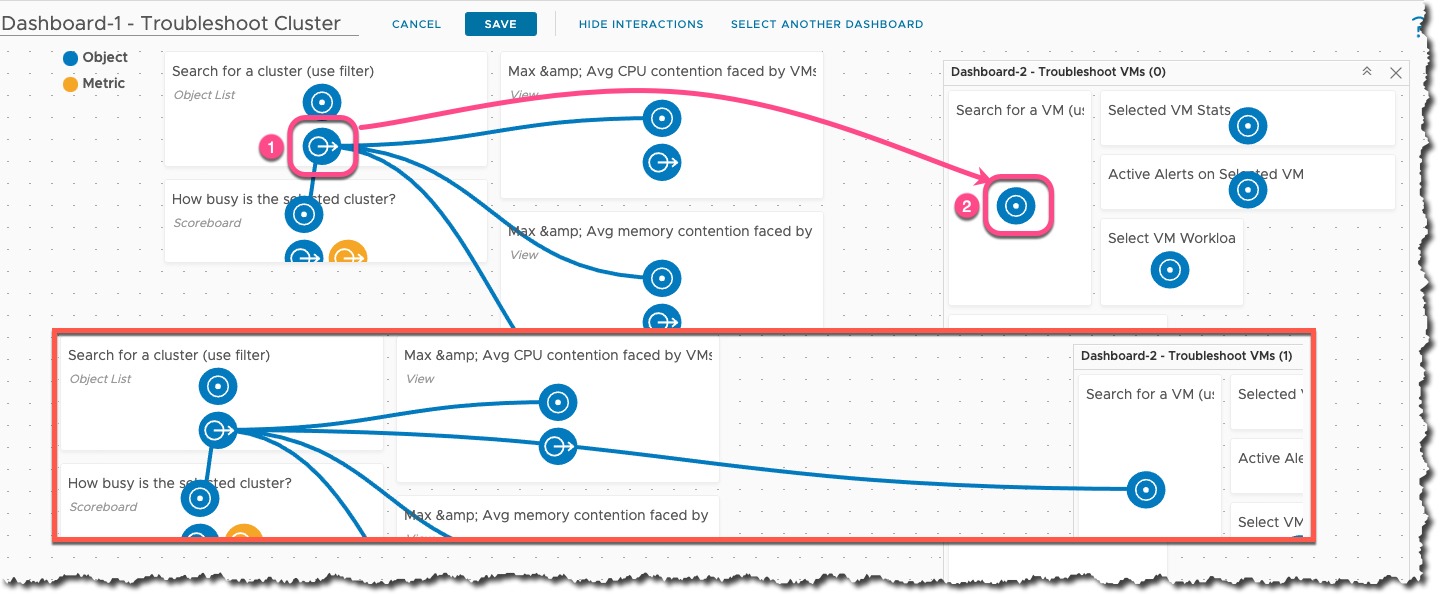
- On the right-hand side you will see a smaller version of your second dashboard and available interaction points.
- Drag and Drop as necessary to create an interaction
- In my example I am dragging from the Object Picker List in Dashboard-1 to the Object Picker list in Dashboard-2 (Pink lines/boxes)
- The red box shows the interaction line (blue) after it’s been created (due to the placement it looks as if it’s going via another dashboard widget, it is not).
- Click save on the dashboard once you are happy.
Now on Dashboard-2, we need to make some changes to the Object Picker List, so that the returned data is filtered correctly.
- Open Dashboard-2
- Hover over the widget
- Edit the Widget
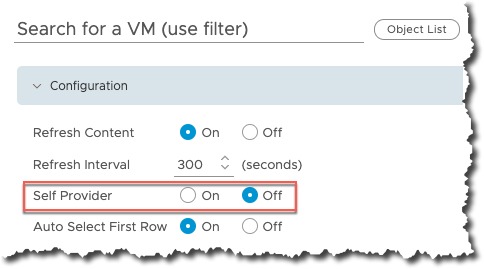
- Under Configuration
- Ensure “Self Provider” is configured as “Off”
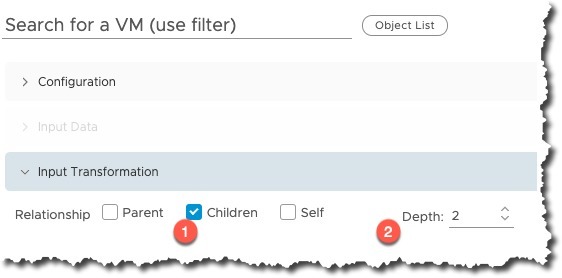
- Under Input Transformation
- Set Relationship to “Children”
- As a Virtual Machine is a Child Object relation to a Cluster
- Set Depth to “2”
- A virtual machine object relation is two levels under a Cluster Object
- Set Relationship to “Children”
- For Output Filter, do not make any changes
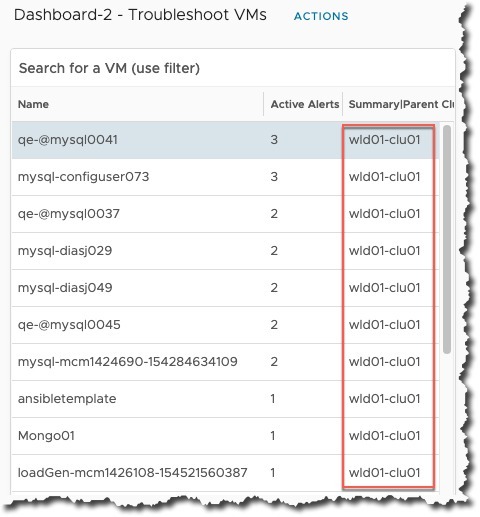
- For Additional Columns, I added a column to show the parent Cluster name for the VM.
- Save the Configuration
Using the Interaction between Dashboards
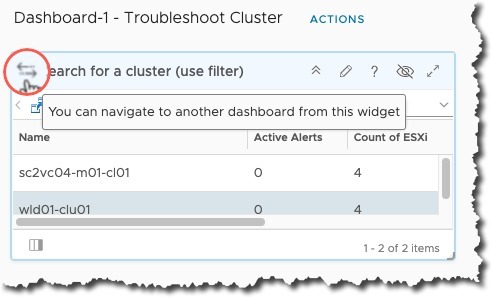
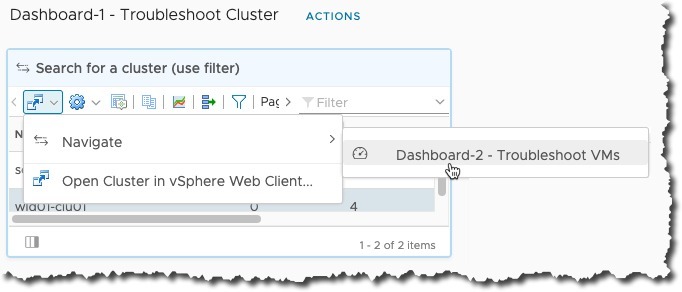
Now when we view Dashboard-1, we can see that the Object Picker List widget now has a blue bar and a symbol of arrows pointing in opposite directions.
- Note that the selected cluster is called “wld01-clu01”
- To navigate to the associated dashboard, either click the arrows above or click the Icon of two windows with a connecting arrow.
- Both will now show you the navigate field and you can select your dashboard.
A single dashboard can interact with multiple dashboards if you’ve configured it as such.
Finally, after selecting the dashboard, we will see the widget has been filtered to only show my selected cluster (wld-clu01). Any other interactions on this dashboard will then be updated as necessary.
There we have it, another powerful feature in vRealize Operations when creating dashboards to provide additional options for filtering the right data. This can help massively when it comes to end users consuming the vRealize Operations platform for tasks such as troubleshooting.
Regards
