Tag Archives: vRealize Operations

vRealize Operations Header

vRealize Operations – Where did my “Object Relationships” view go?

The Issue

From vRealize Operations 8.6.2, it’s been noticed that the “Object Relationships” page has disappeared from the navigation column/settings pages in the product UI.

The Cause

This page is being redesigned by the VMware team, and is hidden from view in current releases.

The Workaround

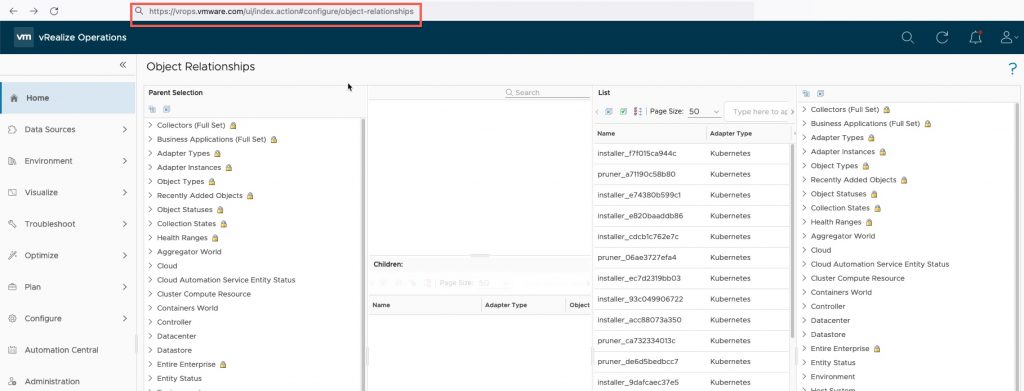
You can manually access the page by going to the following web page suffix:

  • ui/index.action#configure/object-relationships
    • For example
      • https://vrops.vmware.com/ui/index.action#configure/object-relationships

vRealize Operations - Object Relationships


Regards

Dean Lewis

vRealize Operations ElasticStack Header

Sending vRealize Operations Alerts to ElasticStack (ELK)

This blog post is thanks to an internal query, that I thought should be easy enough to complete, however my usage of an ELK environment is limited, so it was a good chance to dig in and learn something new.

In this blog post, I’m going to detail the configurations for pushing vRealize Operations Alert notifications to ElasticStack (aka ElasticSearch, ELK) using the Notification Webhook feature.

Again, I am not an ELK expert here, so there may (read this as probably) better ways to configure this when it comes to the date handling.

Configure an ingestion timestamp in ELK

One of the first issues I hit when testing all of this, is the fact that ELK doesn’t seem to like the date formats that vROPs alerts uses. Once an index (store of data records) is created, the fields are parsed, and the type attributed to a field cannot be changed. I went through various options to remedy this, so that my logs could be searched based on time stamps, but it seemed not easily feasible. If anyone knows of the best way to achieve this, let me know, see the end of this blog post for more details.

For those of you who do know ElasticSearch, vROPs sends the time/date in the notification payload in the following format "EEE LLL dd HH:mm:ss z uuuu"

The best way I found around this, is to add in the ability to create a ingestion timestamp on the data received by Elasticsearch, and add it to the settings of the created index.

To create this ingestion rule, in your Elastic UI, click on Three Lines to open the navigation options, then click on Dev Tools, under Management.
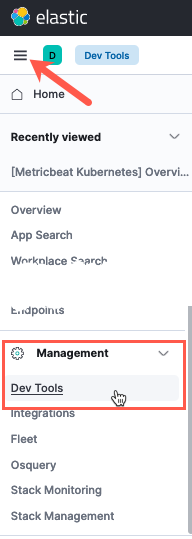
vROPS ELK - Elastic - Management - Dev Tools

This will give you an in-browser console access to send configurations to the Elastic environment. When reading the documentation, you’ll notice that the configuration for Elastic is provided a lot of the time via API commands and payloads. It seems like this is the preferred way to configure the system, with the UI lacking the ability to make these changes for most options.

Paste the content below the screenshot, which creates a pipeline rule to provide processing on the data that comes into the system.

When the syntax is validated, you will see a small Green Arrow appear to apply the configuration. The right-hand side console window shows the output from running the API call and payload.

vROPS ELK - Elastic - Create pipeline - ingestion timestamp

PUT _ingest/pipeline/set-timestamp
{
  "description": "sets the timestamp",
  "processors": [
    {
      "set": {
        "field": "timestamp",
        "value": "{{{_ingest.timestamp}}}"
      }
    }
  ]
}
Create the outbound webhook in vRealize Operations

Continue reading Sending vRealize Operations Alerts to ElasticStack (ELK)

CloudHealth vRealize Operations Header

CloudHealth – Configuring vRealize Operations cost visibility for your private datacenters

In this blog post, we are going to synchronise our vRealize Operations costing information with CloudHealth, to provide the ability to have true multi-cloud cost reporting, that includes our on-premises VMware Datacenter.

Configuring the CloudHeath Integration
Pre-Requisites

Your vRealize Operations instance will need to have the basic cost settings configured, I have written a deep dive post on this here.

  • vROPs no longer has to be set to USD for this integration
    • If you are integrating multiple vROPs instances, and they all have the same currency, this is also supported for non-USD
    • If you are integrating multiple vROPs instances, and they have differing currencies settings, CH will default the platform to the instance that was first configured for integration.
  • vROPs must be version 8.2 of higher
  • vROPS FIPs mode is not supported

Ensure that the vROPs instance (or collector) can reach CloudHealth Graphql endpoint:

You can find the official documentation here and the vROPS Integration FAQ here.

In the CloudHealth interface, when you go to the vRealize Operations Accounts page under setup, you’ll see that this page points you to the documentation and the VMware Marketplace. As this configuration is initiated by the vRealize Operations Management Pack.

  • Data Center Tab > Setup > Accounts > vRealize Operations

vRealize Operations - CloudHealth Integration - CloudHealth vRealize Operations Account Page

Download the Management Pack

Start by downloading the management pack from the VMware Marketplace.

vRealize Operations - CloudHealth Integration - Download Management Pack

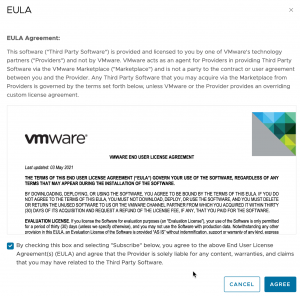
  • Accept the EULA

vRealize Operations - CloudHealth Integration - Download Management Pack - Accept EULA

Your download will start.

Generating a CloudHealth API Key

We need to generate an API key from our CloudHealth account, that will be used by vROPs to send data to CloudHealth. These APIs are generated against your account.

  • Log into your CloudHealth Account.
  • Click your username in the top right-hand corner
  • Click your username on the navigation pane that appears
  • At the bottom of your profile information, copy the API Access Key for later use
    • by default an API key will not be present, they can generate one (or a new key) by clicking Generate New API Key

Continue reading CloudHealth – Configuring vRealize Operations cost visibility for your private datacenters

vROPs Header

vRealize Operations – Costing Setup and Configuration Deep Dive

In years gone by, costing of your technology platforms was covered in a product called vRealize Business for Cloud. Since the move to the 8.x code based, this product was EOL’d.

The main functions where customers saw value, to provide costings for your datacenter and virtual machines, was wrapped up into vRealize Operations.

This blog post is going to deep dive into the costing capabilities within vRealize Operations across your on-premises datacenters, and what happens when you start to consume VMware on Hyperscaler solutions, such as VMware Cloud on AWS (VMC).

Configure the Global Currency Setting

The first action is setting the global currency for the vRealize Operations instance. There are two important things to note when undertaking this configuration:

  • This can only be set once
  • This setting cannot be changed once it is set

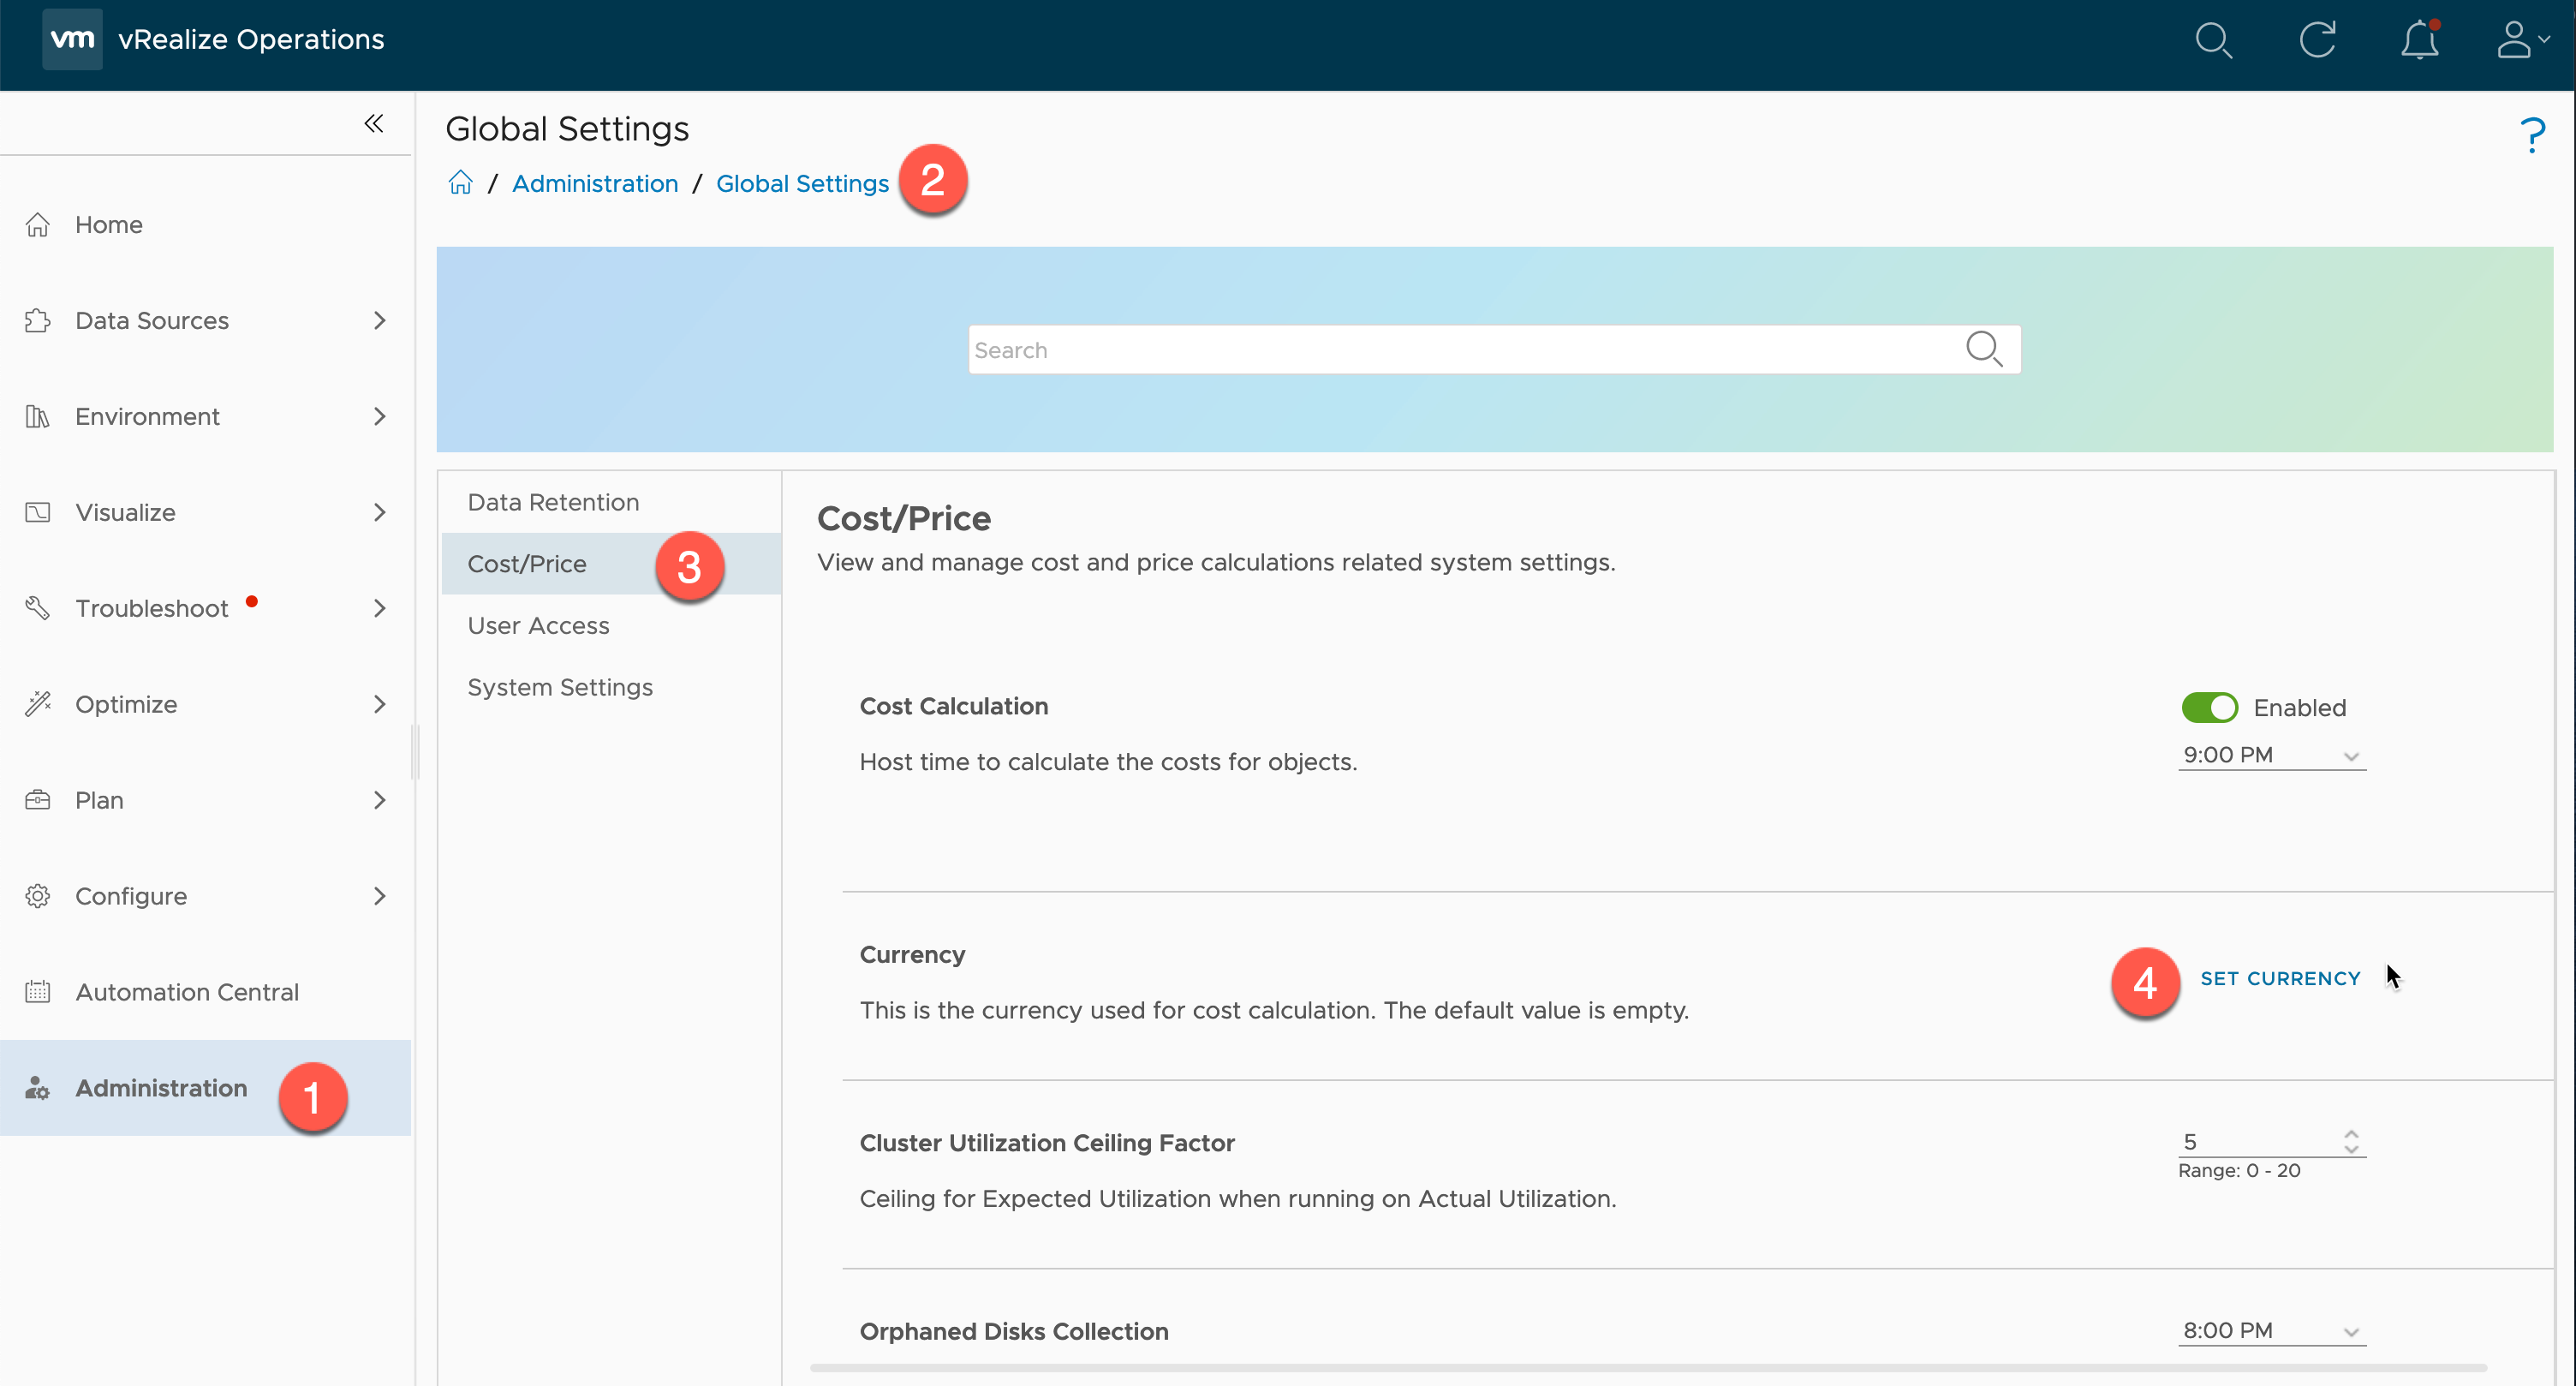
To configure:

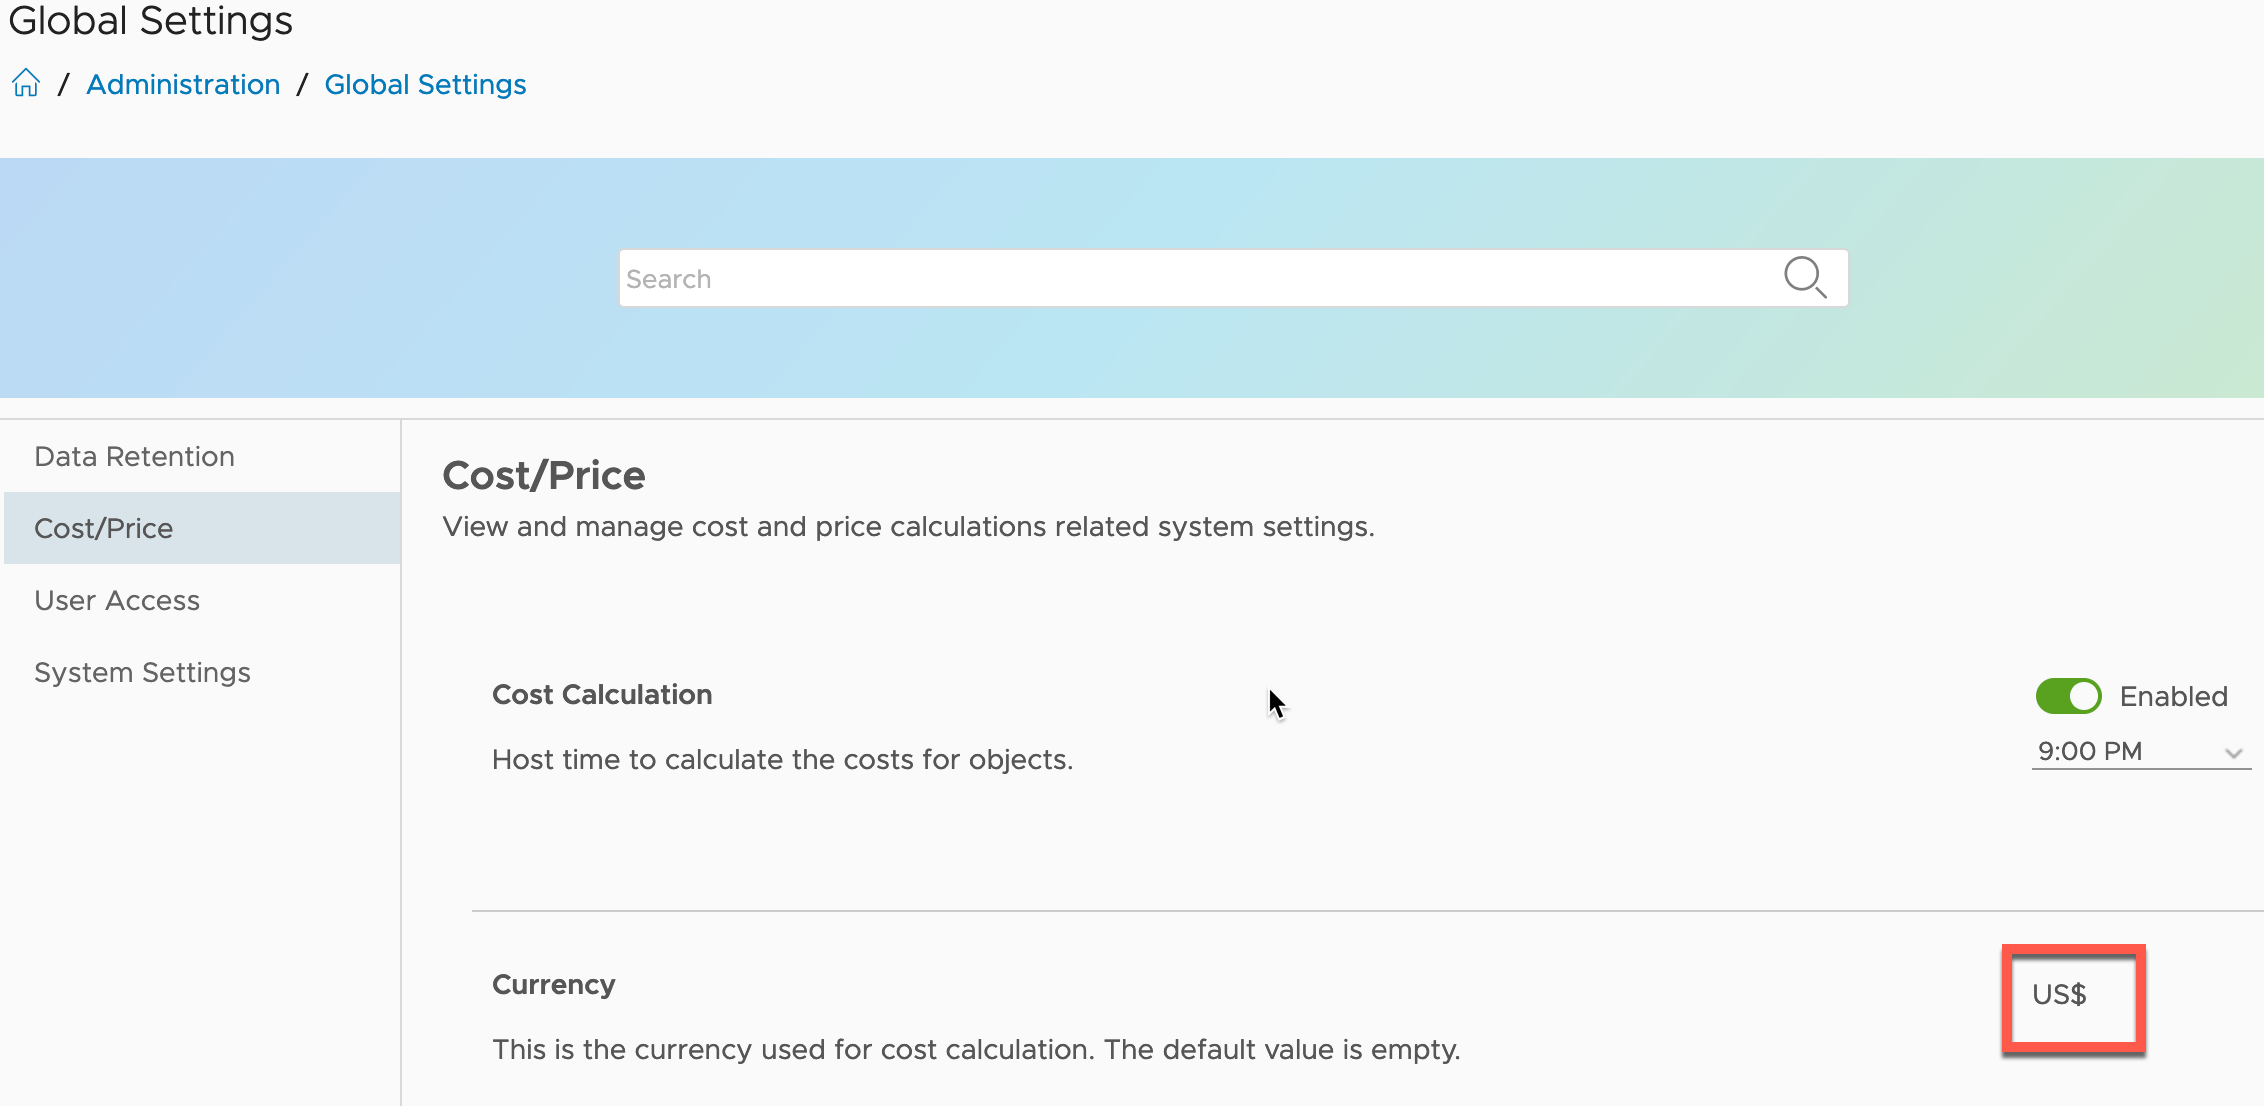
  • Click on Administration
  • Click on the Global Settings Tile
  • Click on the Cost/Price heading
  • Click to “Set currency”

vRealize Operations - Costing - Administration - Global Settings - Cost Price - Set Currency

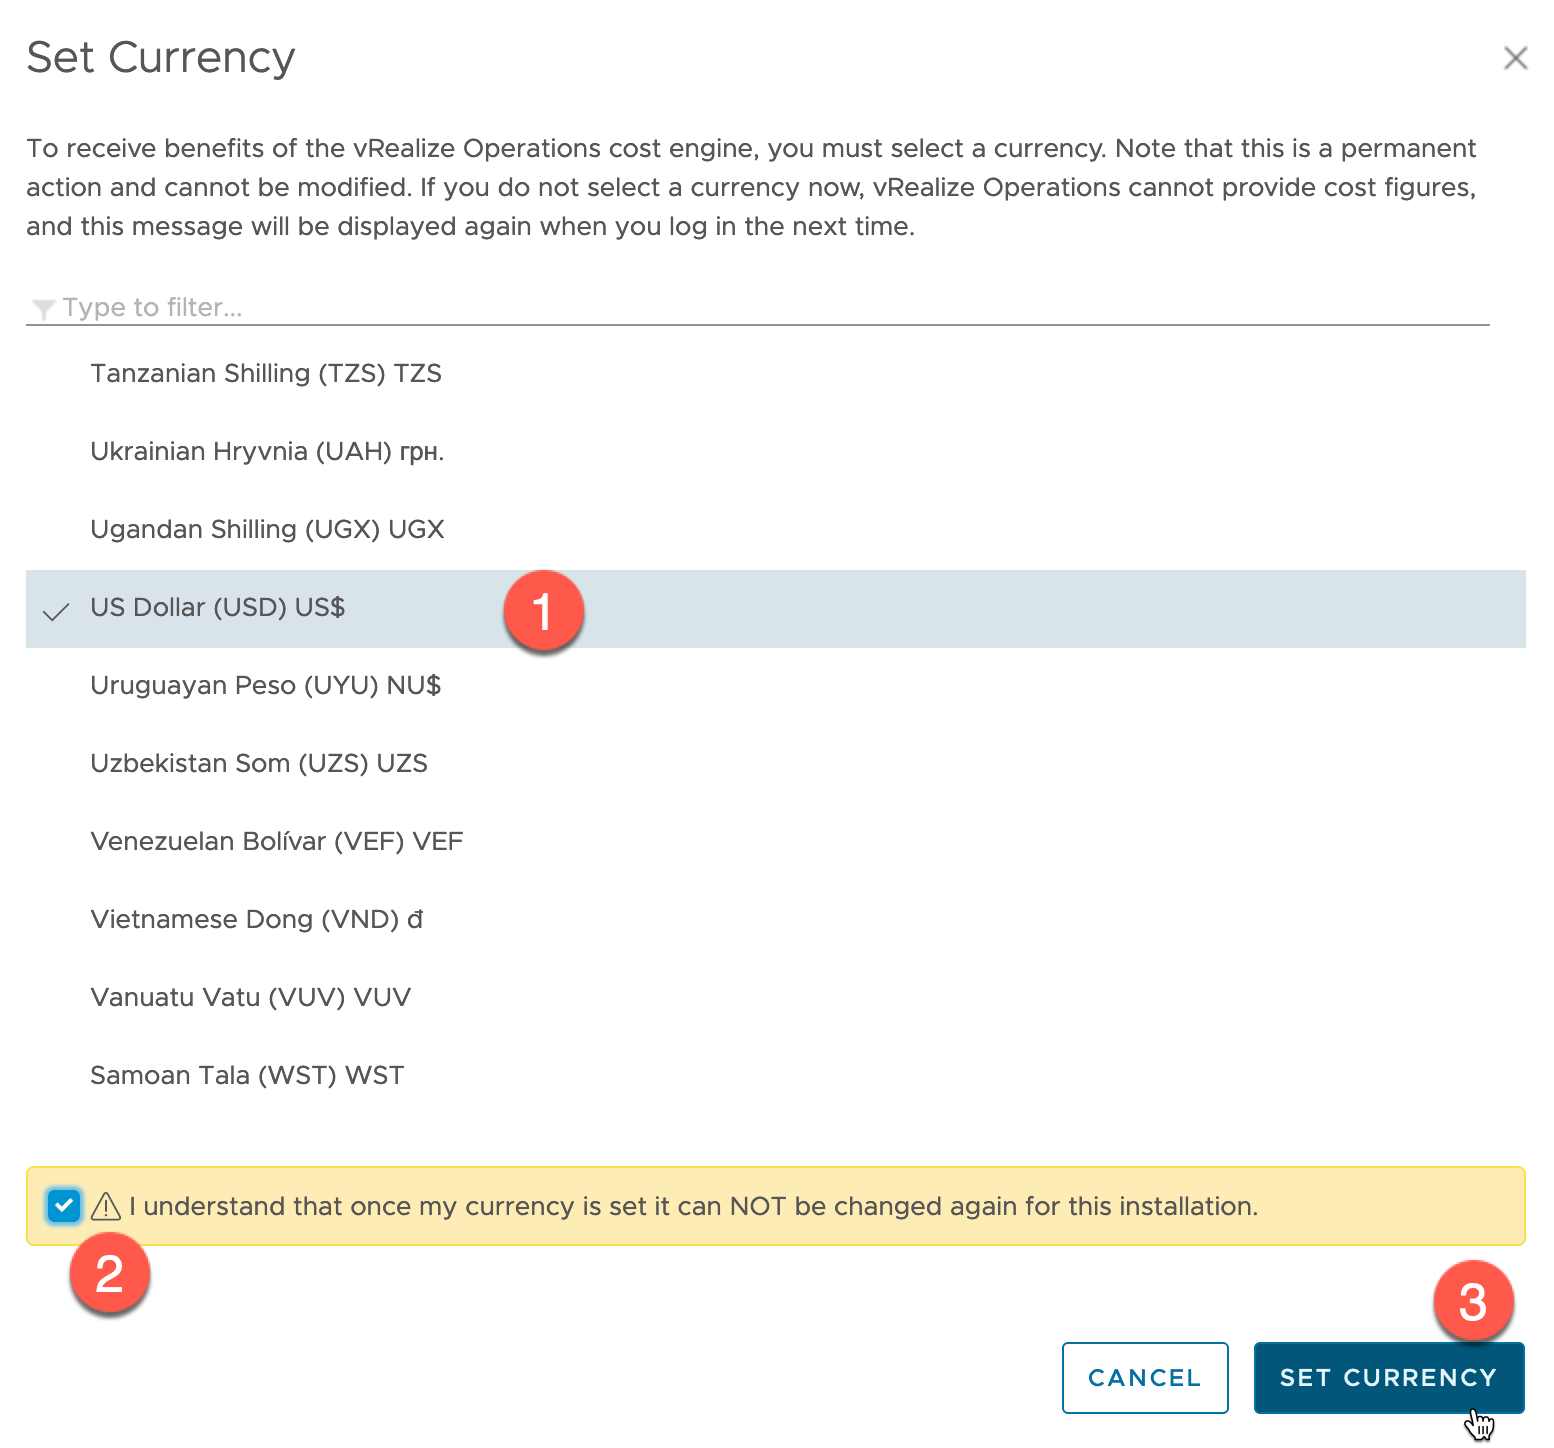
Select your currency from the list and click “Set Currency”.

vRealize Operations - Costing - Administration - Global Settings - Cost Price - Set Currency 2

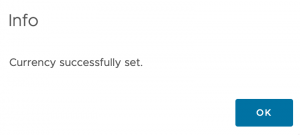
You will get a dialog to say the configuration has taken place.

vRealize Operations - Costing - Administration - Global Settings - Cost Price - Set Currency - Currency Successfully Set

Now below you can see that this setting is in place and there is no button/clickable option to change it.

vRealize Operations - Costing - Administration - Global Settings - Cost Price - Set Currency - Currency Successfully Set 2

Configuring Cost Settings

Now that the global currency is configured, we can start configuring all the cost settings for our Datacenter platforms.

Financial Account Model

Continue reading vRealize Operations – Costing Setup and Configuration Deep Dive

vROPs - Kubernetes - Prometheus - Telegraf - Header

vRealize Operations – Monitoring Kubernetes with Prometheus and Telegraf

In this post, I will cover how to deploy Prometheus and the Telegraf exporter and configure so that the data can be collected by vRealize Operations.

Overview

Delivers intelligent operations management with application-to-storage visibility across physical, virtual, and cloud infrastructures. Using policy-based automation, operations teams automate key processes and improve the IT efficiency.

Is an open-source systems monitoring and alerting toolkit. Prometheus collects and stores its metrics as time series data, i.e. metrics information is stored with the timestamp at which it was recorded, alongside optional key-value pairs called labels.

There are several libraries and servers which help in exporting existing metrics from third-party systems as Prometheus metrics. This is useful for cases where it is not feasible to instrument a given system with Prometheus metrics directly (for example, HAProxy or Linux system stats).

Telegraf is a plugin-driven server agent written by the folks over at InfluxData for collecting & reporting metrics. By using the Telegraf exporter, the following Kubernetes metrics are supported:

Why do it this way with three products?

You can actually achieve this with two products (vROPs and cAdvisor for example). Using vRealize Operations and a metric exporter that the data can be grabbed from in the Kubernetes cluster. By default, Kubernetes offers little in the way of metrics data until you install an appropriate package to do so.

Many customers have now decided upon using Prometheus for their metrics needs in their Modern Applications world due to the flexibility it offers.

Therefore, this integration provides a way for vRealize Operations to collect the data through an existing Prometheus deploy and enrich the data further by providing a context-aware relationship view between your virtualisation platform and the Kubernetes platform which runs on top of it.

vRealize Operations Management Pack for Kubernetes supports a number of Prometheus exporters in which to provide the relevant data. In this blog post we will focus on Telegraf.

You can view sample deployments here for all the supported types. This blog will show you an end-to-end setup and deployment.

Prerequisites
  • Administrative access to a vRealize Operations environment
  • Access to a Kubernetes cluster that you want to monitor
  • Install Helm if you have not already got it setup on the machine which has access to your Kubernetes cluster
  • Clone this GitHub repo to your machine to make life easier
git clone https://github.com/saintdle/vrops-prometheus-telegraf.git
vrops - git clone saintdle vrops-prometheus-telegraf.git
Information Gathering

Note down the following information:

  • Cluster API Server information
kubectl cluster-info

vROPs - kubectl cluster-info

  • Access details for the Kubernetes cluster
    • Basic Authentication – Uses HTTP basic authentication to authenticate API requests through authentication plugins.
    • Client Certification Authentication – Uses client certificates to authenticate API requests through authentication plugins.
    • Token Authentication – Uses bearer tokens to authenticate API requests through authentication plugin

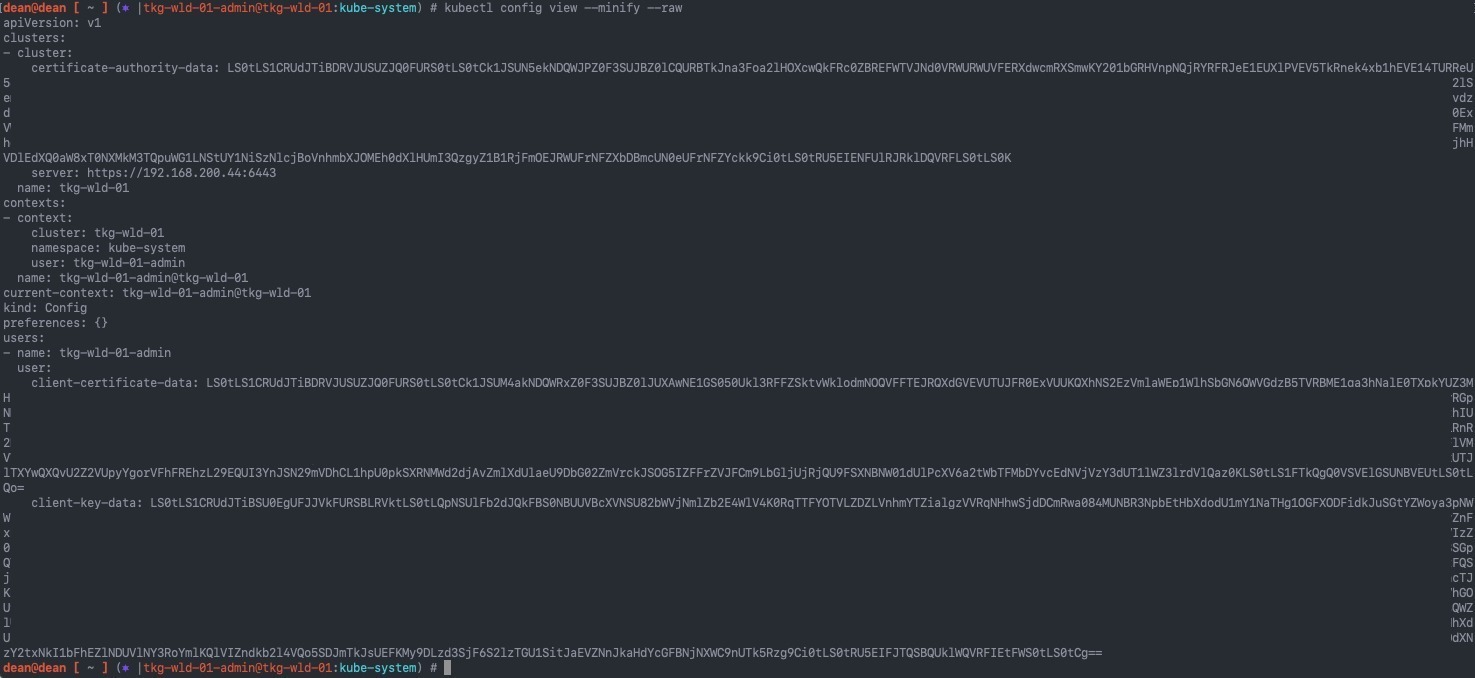
In this example I will be using “Client Certification Authentication” using my current authenticated user by running:

kubectl config view --minify --raw

vROPs - kubectl config view --minify --raw

  • Get your node names and IP addresses
kubectl get nodes -o wide

vROPs - kubectl get nodes -o wide

Install the Telegraf Kubernetes Plugin

Continue reading vRealize Operations – Monitoring Kubernetes with Prometheus and Telegraf