Tag Archives: vRealize Operations

vRealize Operations Header

vRealize Operations – Creating interactions between separate dashboards

Whilst reading some of the older vRealize Operations documentation, I stumbled on something I didn’t think was possible.

  • The ability to create interactions between separate dashboards.

At first, I thought could not be correct? I don’t remember seeing this option. But sure enough it’s there. So, I thought I’d write a quick blog about it and share to the world.

  • You can apply sections or context from one dashboard to another. You can connect widgets and views to widgets and views in the same dashboard or to other dashboards to investigate problems or better analyze the provided information.
Configuring Interactions between Dashboards

First, I’ve created two dashboards, which are based on the old troubleshooting dashboards. Both dashboards have an Object Picker List to filter the various related objects on each dashboard.

  • Dashboard-1 – Troubleshoot Cluster
  • Dashboard-2 – Troubleshoot VM

The premise is simple, when I select a Cluster object from Dashboard-1, I want the list of VMs to be filtered in Dashboard-2, to those only in the selected Cluster.
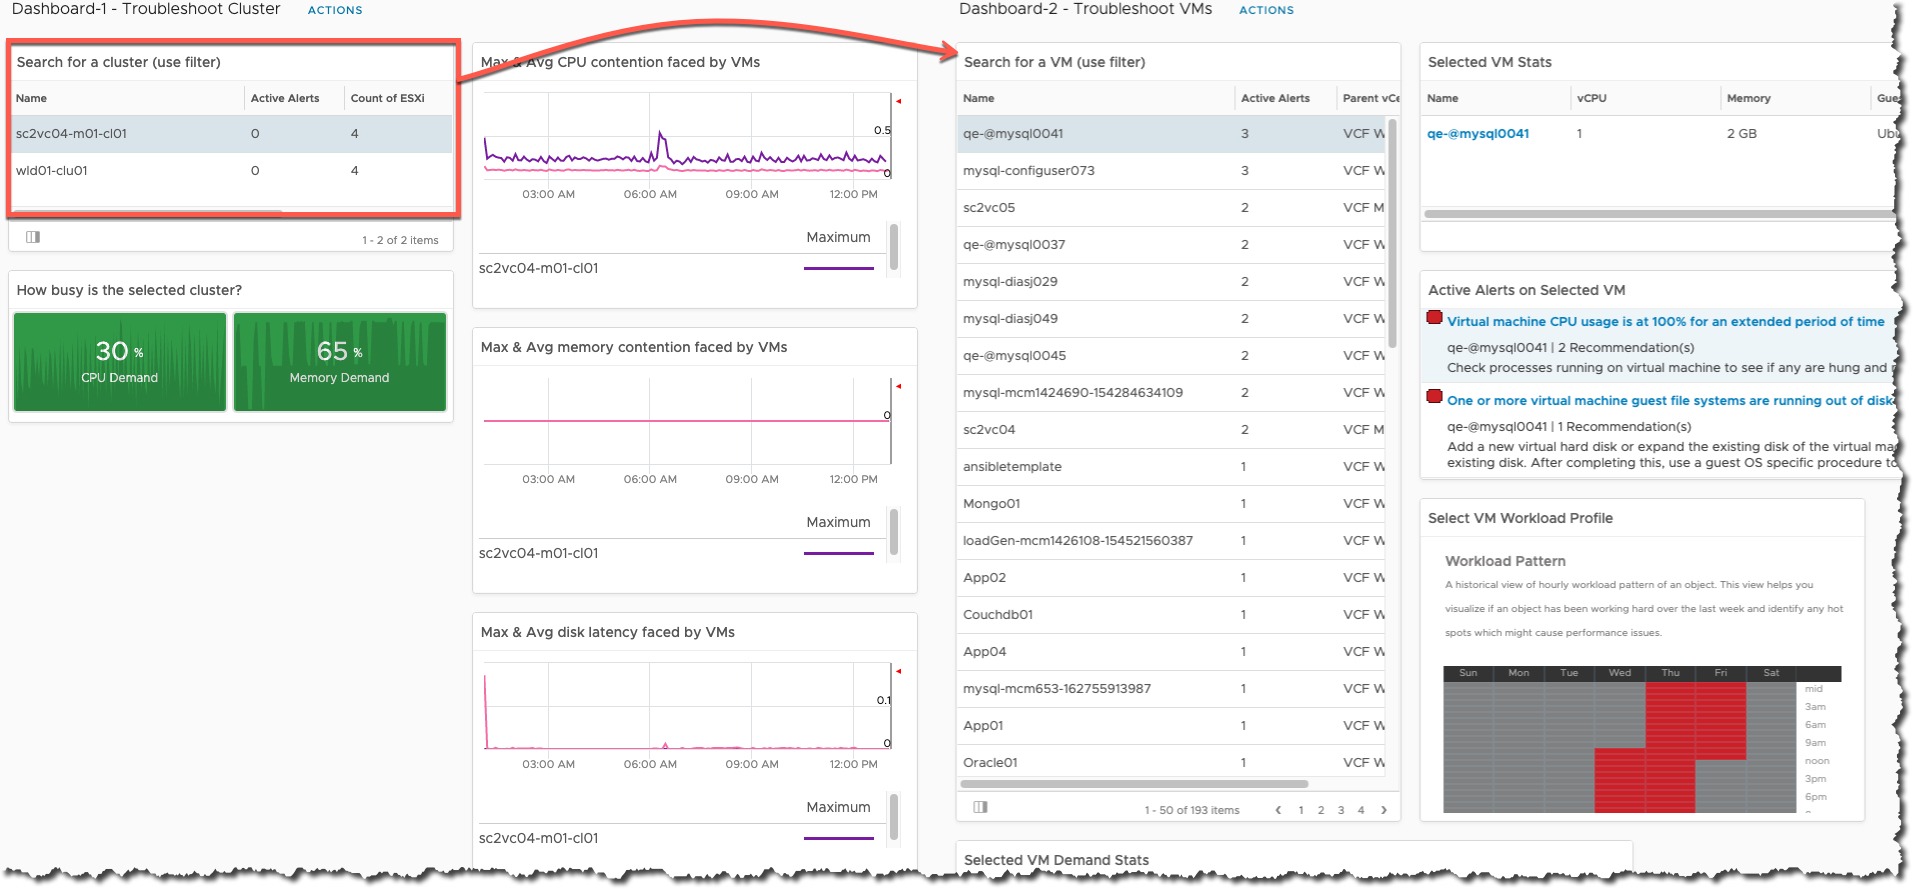
vROPs - Dashboard Interaction - example dashboards Continue reading vRealize Operations – Creating interactions between separate dashboards

vRealize Operations Header

How to build a vROPs dashboard for tracking Total VMs deployed and Growth Trend

In this Blog post I am going to detail how I created a vROPs dashboard based on a customer’s request.

Can we track how many VMs have been created in the past week and track if the number increases or decreases in each cluster?

If you want to just get the dashboard, see directly below, if you want to learn how it was created, keep reading further.

Installing Dashboard
  1. Download the files from code.vmware.com sample page.
  2. Import the files appended with “view” under the view’s in vROPs
  3. Import the file appended with “Dashboard” under the dashboard section in vROPs.
Dashboard Breakdown
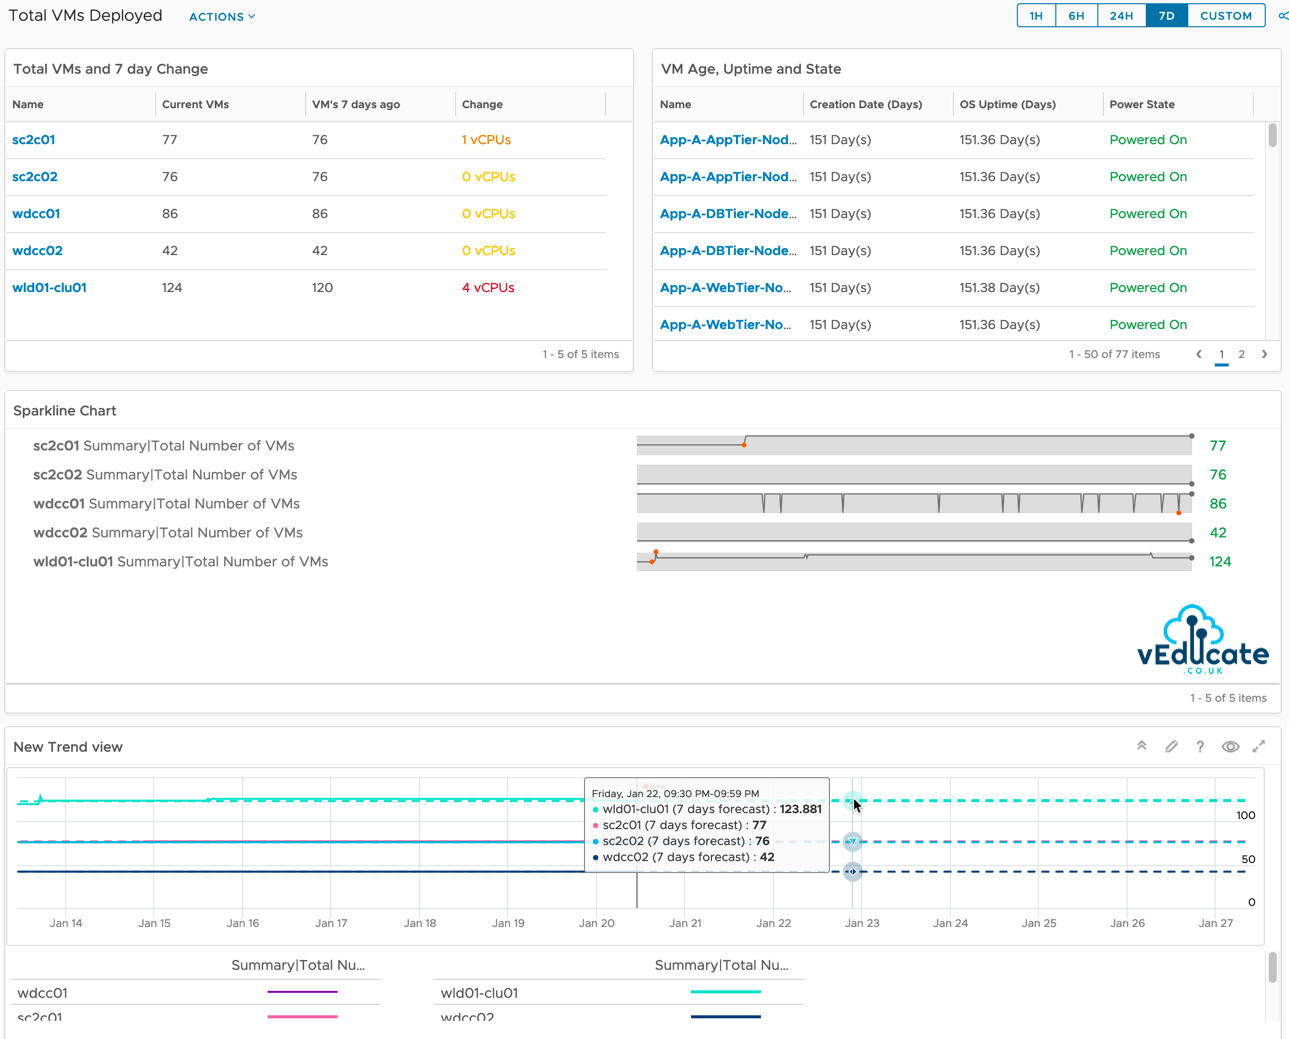
  • First Item – This is a list which I’ve created to show each cluster, the total VM metric with some expressions attached, the timescale here is fixed by the list view and not affected by the dashboard timeframe. The change is an expression of the count of VMs at the start and end of the timeframe. I’ve added in some basic colouring to alert at thresholds.
    • Why does it say vCPUs? When using expressions, it requires a Unit to be affixed. This doesn’t work if you’re counting something, so in our next release, this issue should be addressed. It’s purely a vanity thing.
  • Second Item – This shows the VMs attached to the cluster you select on the left-hand side, showing you how old that VM is, its uptime and current power state.
  • Third is a Sparkline – Showing an easy view of the changes in total VMs per cluster over a 7-day period (as defined by the dashboards time scale)
  • Forth item is a trend graph, where we are showing date of the changes in the Total VM metric based on the data we have, and the trend/forecast. This trend into the future is set within the item itself. Currently we can set this to show the forecast for the next 366 days in the future.

vROPS - Total VMs Deployed and Growth Trend

vROPs versions

To show the VM creation date, this metric is available in vROPs 8.2 and later. This dashboard/view should work with older versions of vROPs but omit the data for the missing metric.

How was the dashboard created?

First, we need to create three views. Continue reading How to build a vROPs dashboard for tracking Total VMs deployed and Growth Trend

vRealize Operations Header

vRealize Operations – What is the Guest|Page In/Out Rate Metric?

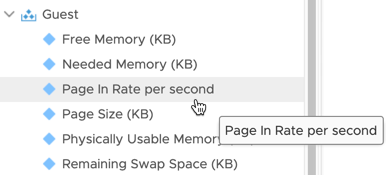
In vRealize Operations 6.3, we added the following Guest Metrics, some of which we require VMware Tools 10.3.X or higher to be present for us to pull the data.

  • Guest|Active File Cache Memory (KB)
  • Guest|Context Swap Rate per second
  • Guest|Free Memory (KB)
  • Guest|Huge Page Size (KB)
  • Guest|Needed Memory (KB)
  • Guest|Page In Rate per second
  • Guest|Page Out Rate per second
  • Guest|Page Size (KB)
  • Guest|Physically Usable Memory (KB)
  • Guest|Remaning Swap Space (KB)
  • Guest|Total Huge Pages

I had someone query the below metrics, and the answer although easy to assume, is not clearly written down and within vROPs you don’t get a description either, so I thought I’d also publish it, in case any inquisitive minds go googling.

vRealize Operations page in rate metric

Guest|Page In Rate

The Rate the Guest OS brings memory back from disk to DIMM per second. Basically, the rate of reads going through paging/cache system.

It includes not just swapfile I/O, but cacheable reads as well (double pages/s). A page that was paged out earlier, has to be brought back first before it can be used. This creates performance issue as the application is waiting longer, as disk is much slower than RAM.
The unit is in number of pages, not MB. It’s not possible to convert due to mix use of Large Page (2 MB) and Page (4 KB).

A process can have concurrent mixed usage of Large and non-Large page in Windows. The page size isn’t a system-wide setting that all processes use. The same is likely true for Linux Huge Pages.

Windows

  • Page Input/sec counter
    • Pages Input/sec is the rate at which pages are read from disk to resolve hard page faults. Hard page faults occur when a process refers to a page in virtual memory that is not in its working set or elsewhere in physical memory, and must be retrieved from disk. When a page is faulted, the system tries to read multiple contiguous pages into memory to maximize the benefit of the read operation. Compare the value of Memory\\Pages Input/sec to the value of Memory\\Page Reads/sec to determine the average number of pages read into memory during each read operation.
    • Windows: Win32_PerfFormattedData_PerfOS_Memory::PagesInputPersec
      https://msdn.microsoft.com/en-us/ie/aa394268(v=vs.94)

Linux

  • Pages Swapped In counter
$ cat /proc/vmstat | grep pgpgin

pgpgin 604222959257
Guest|Page Out Rate

The opposite of the above. This is not as important as the above. Just because a block of memory is moved to disk that does not mean the application experiences memory problem. In many cases, the page that was moved out is the idle page. Windows does not page out any Large Pages.

Windows

  • Page Output/sec counter
    • Pages Output/sec is the rate at which pages are written to disk to free up space in physical memory. Pages are written back to disk only if they are changed in physical memory, so they are likely to hold data, not code. A high rate of pages output might indicate a memory shortage. Windows writes more pages back to disk to free up space when physical memory is in short supply.  This counter shows the number of pages, and can be compared to other counts of pages, without conversion.

Linux

  • Pages Swapped Out counter

Final notes

Page in/out rate includes pages written/read to/from swap file as well as other system files.

It is important to remember these metrics are populated by pulling the data from the performance counters of the Guest OS, hence the need for VMTools. These metrics should not be confused with virtual machine metrics, which are based on the activity of the VM at the vSphere level. Therefore not taking into account what is going on inside the guest itself.

Thanks to Iwan “E1” Rahbook blog post here for helping me figure this out as well.

Regards

vRealize Operations Header

How to build vROPs dashboard for tracking VM Growth over X days

I came across an interesting query on Reddit regarding vRealize Operations Manager (vROPs), summarised the query;

“Can I have a vROPs report/dashboard which shows me the storage usage by VMs over the past 3 days”

The short answer is yes, and I produced the following dashboard, views and report and uploaded to code.vmware.com for the post author to use.

Basic VM Growth Sparkline Dashboard VM Growth List

My dashboard has two elements to keep things simple;

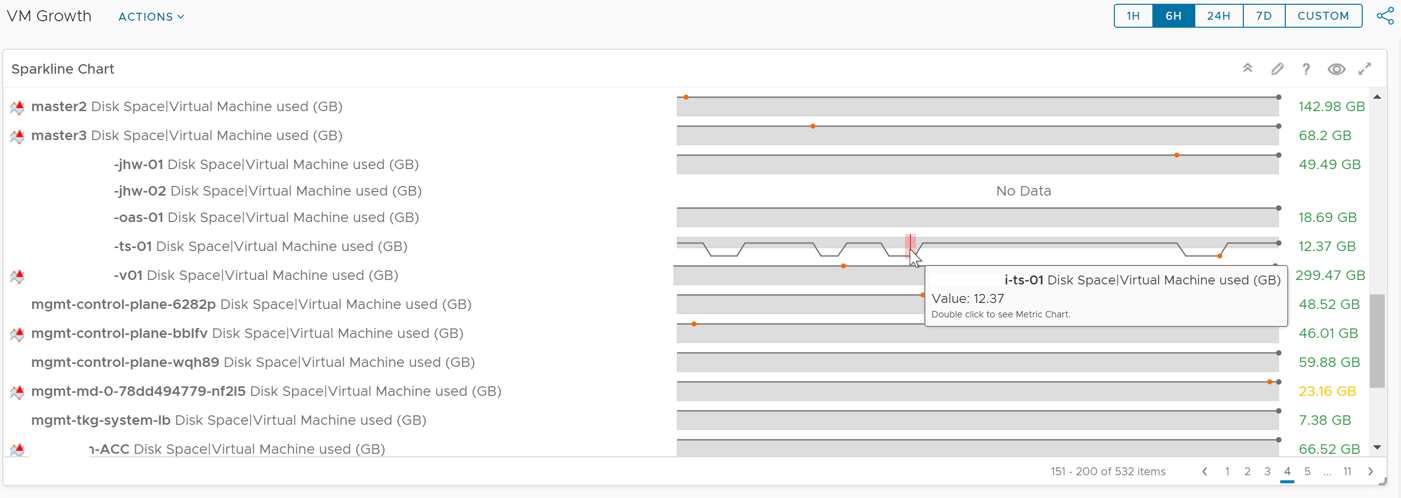
  • A sparkline widget of VM’s storage used, the time frame show can be controlled in the dashboard view in the top-right hand corner
  • A list view of the VMs storage used covering a few metrics
    • Current Disk used
    • Disk Used (3 days ago)
    • Change of disk used (in GB)
    • Change of disk used (in %)

So, let’s look at how I created this.

Creating a Sparkline widget in the Dashboard

Create your dashboard, which will show you a blank canvas. Set the Dashboard name.

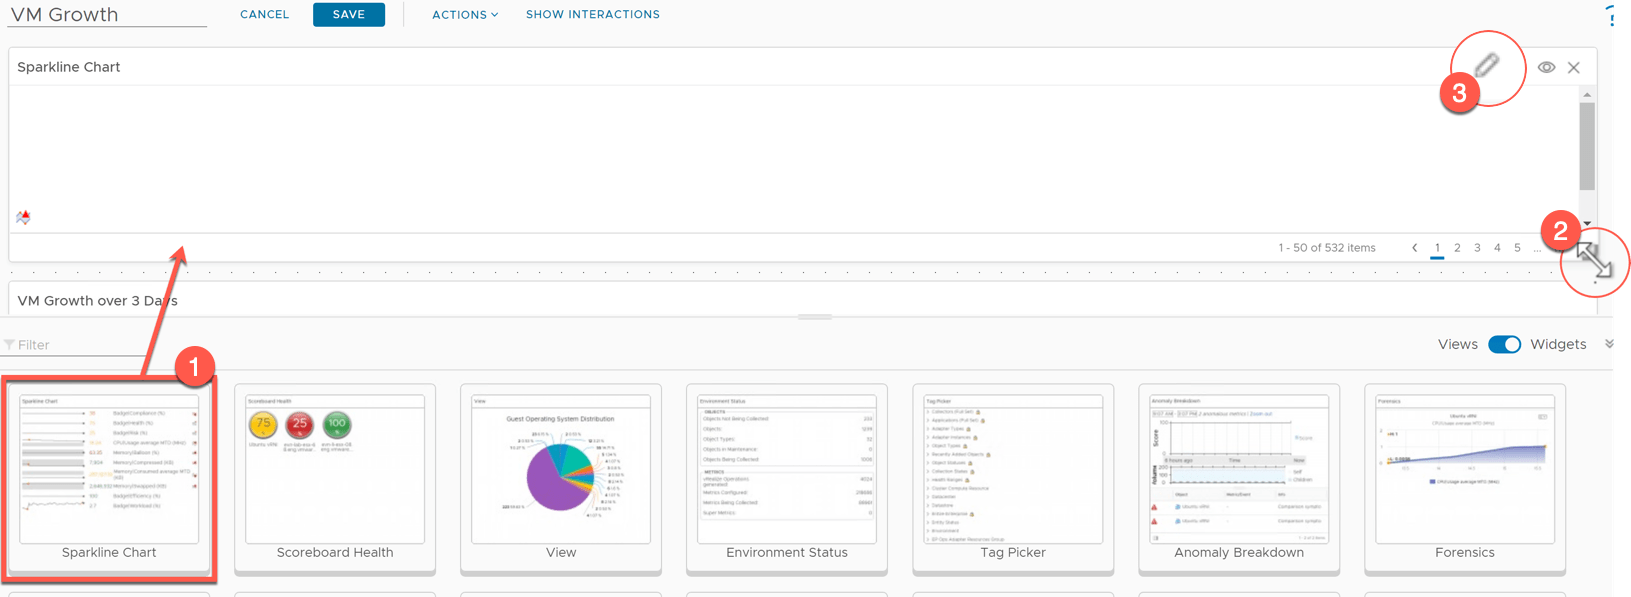
  • Drag the Sparkline Chart widget onto the canvas and resize as needed, you’ll see this option appear by hovering over the edge of the widget.
  • Click the pencil icon to edit the widget settings.

VM Growth Sparkline Chart Widget

Configure the Widget configuration. The most important options here are;

  • Self Provider – On
  • Show Object Name – On
  • Column Sequence – Label First

This means the widget will provide its own metric data to be displayed. It is not linked to other objects on the dashboard, as we are keeping this as a simple view. Continue reading How to build vROPs dashboard for tracking VM Growth over X days