Tag Archives: Metric

vRealize Operations Header

vRealize Operations – What is the Guest|Page In/Out Rate Metric?

In vRealize Operations 6.3, we added the following Guest Metrics, some of which we require VMware Tools 10.3.X or higher to be present for us to pull the data.

  • Guest|Active File Cache Memory (KB)
  • Guest|Context Swap Rate per second
  • Guest|Free Memory (KB)
  • Guest|Huge Page Size (KB)
  • Guest|Needed Memory (KB)
  • Guest|Page In Rate per second
  • Guest|Page Out Rate per second
  • Guest|Page Size (KB)
  • Guest|Physically Usable Memory (KB)
  • Guest|Remaning Swap Space (KB)
  • Guest|Total Huge Pages

I had someone query the below metrics, and the answer although easy to assume, is not clearly written down and within vROPs you don’t get a description either, so I thought I’d also publish it, in case any inquisitive minds go googling.
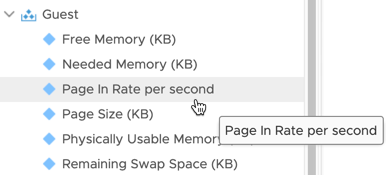
vRealize Operations page in rate metric

Guest|Page In Rate

The Rate the Guest OS brings memory back from disk to DIMM per second. Basically, the rate of reads going through paging/cache system.

It includes not just swapfile I/O, but cacheable reads as well (double pages/s). A page that was paged out earlier, has to be brought back first before it can be used. This creates performance issue as the application is waiting longer, as disk is much slower than RAM.
The unit is in number of pages, not MB. It’s not possible to convert due to mix use of Large Page (2 MB) and Page (4 KB).

A process can have concurrent mixed usage of Large and non-Large page in Windows. The page size isn’t a system-wide setting that all processes use. The same is likely true for Linux Huge Pages.

Windows

  • Page Input/sec counter
    • Pages Input/sec is the rate at which pages are read from disk to resolve hard page faults. Hard page faults occur when a process refers to a page in virtual memory that is not in its working set or elsewhere in physical memory, and must be retrieved from disk. When a page is faulted, the system tries to read multiple contiguous pages into memory to maximize the benefit of the read operation. Compare the value of Memory\\Pages Input/sec to the value of Memory\\Page Reads/sec to determine the average number of pages read into memory during each read operation.
    • Windows: Win32_PerfFormattedData_PerfOS_Memory::PagesInputPersec
      https://msdn.microsoft.com/en-us/ie/aa394268(v=vs.94)

Linux

  • Pages Swapped In counter
$ cat /proc/vmstat | grep pgpgin

pgpgin 604222959257
Guest|Page Out Rate

The opposite of the above. This is not as important as the above. Just because a block of memory is moved to disk that does not mean the application experiences memory problem. In many cases, the page that was moved out is the idle page. Windows does not page out any Large Pages.

Windows

  • Page Output/sec counter
    • Pages Output/sec is the rate at which pages are written to disk to free up space in physical memory. Pages are written back to disk only if they are changed in physical memory, so they are likely to hold data, not code. A high rate of pages output might indicate a memory shortage. Windows writes more pages back to disk to free up space when physical memory is in short supply.  This counter shows the number of pages, and can be compared to other counts of pages, without conversion.

Linux

  • Pages Swapped Out counter

Final notes

Page in/out rate includes pages written/read to/from swap file as well as other system files.

It is important to remember these metrics are populated by pulling the data from the performance counters of the Guest OS, hence the need for VMTools. These metrics should not be confused with virtual machine metrics, which are based on the activity of the VM at the vSphere level. Therefore not taking into account what is going on inside the guest itself.

Thanks to Iwan “E1” Rahbook blog post here for helping me figure this out as well.

Regards

vROPs – What is the “IsGreenForPlacement” Metric + Dashboard

A customer of mine queried the details of a metric available in vROPs “IsGreenForPlacement”

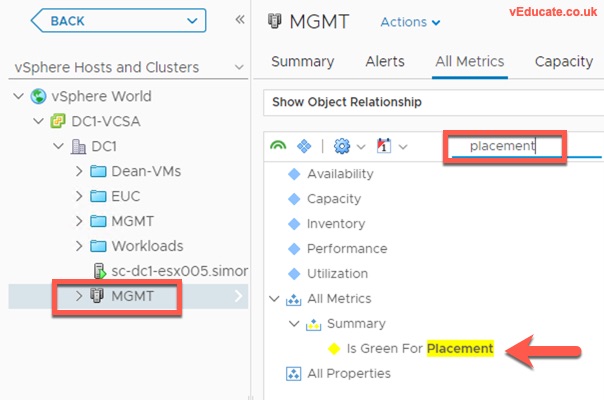
You can find this by selecting a cluster in vROPs, go to All Metrics, and just search placement.

vrops IsGreenForPlacement 1

And here is a screenshot of the Metric in a sparkline.vrops IsGreenForPlacement 2

The customer uses this metric to give a signal (Green/Red Button on a vROPs Dashboard) if a vSphere cluster can be used for on-going deployments.

Unfortunately there’s not much documented information publicly. And we ran into an  issue where the metric stayed positive (yes you can deploy), but the Storage datastore had run out of space. So I went off to dig out what this metric actually does.

IsGreenForPlacement – details

After speaking to the internal teams on vROPs I found the answer;

“Regarding IsGreenForPlacement metric, only CPU and Memory participates on calculation of this metric, by default if CPU and MEM workload is less than 80% it is green.”

So storage is not taken into account.

Creating a Dashboard

This one will be really simple. Continue reading vROPs – What is the “IsGreenForPlacement” Metric + Dashboard