A customer of mine queried the details of a metric available in vROPs “IsGreenForPlacement”
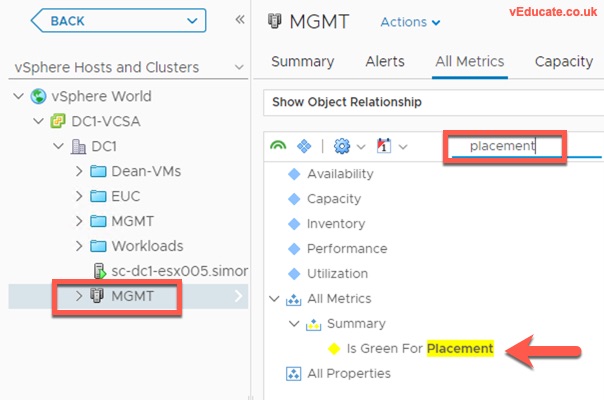
You can find this by selecting a cluster in vROPs, go to All Metrics, and just search placement.
And here is a screenshot of the Metric in a sparkline.
The customer uses this metric to give a signal (Green/Red Button on a vROPs Dashboard) if a vSphere cluster can be used for on-going deployments.
Unfortunately there’s not much documented information publicly. And we ran into an issue where the metric stayed positive (yes you can deploy), but the Storage datastore had run out of space. So I went off to dig out what this metric actually does.
IsGreenForPlacement – details
After speaking to the internal teams on vROPs I found the answer;
“Regarding IsGreenForPlacement metric, only CPU and Memory participates on calculation of this metric, by default if CPU and MEM workload is less than 80% it is green.”
So storage is not taken into account.
Creating a Dashboard
This one will be really simple.
1. Create a new dashboard, or Edit an existing dashboard.
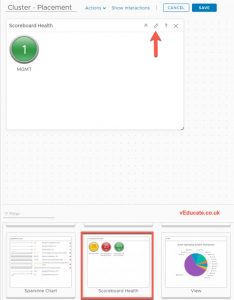
2. Add the Scoreboard Health widget
3. Edit this widget
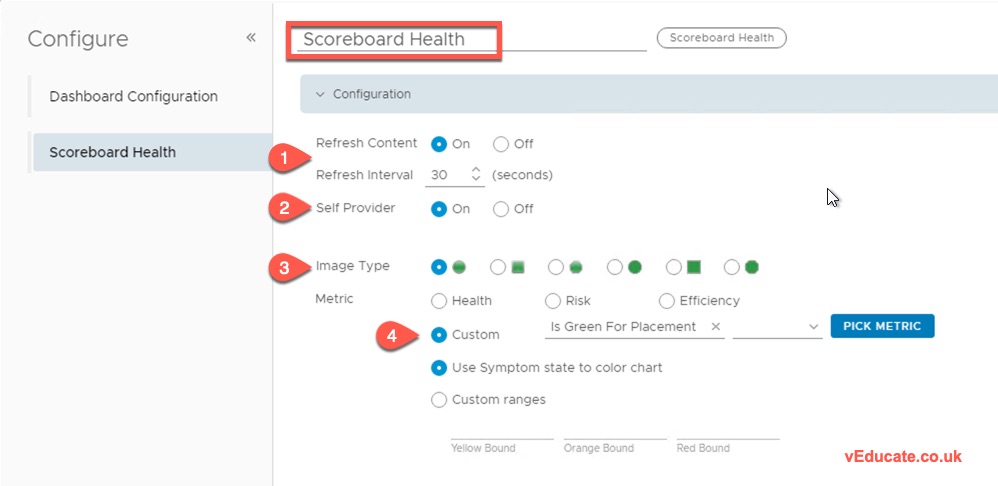
4. Configure the following
- Widget Name
- Set your content refresh settings
- Self provider – Set to ON
- Image type = Whatever you like
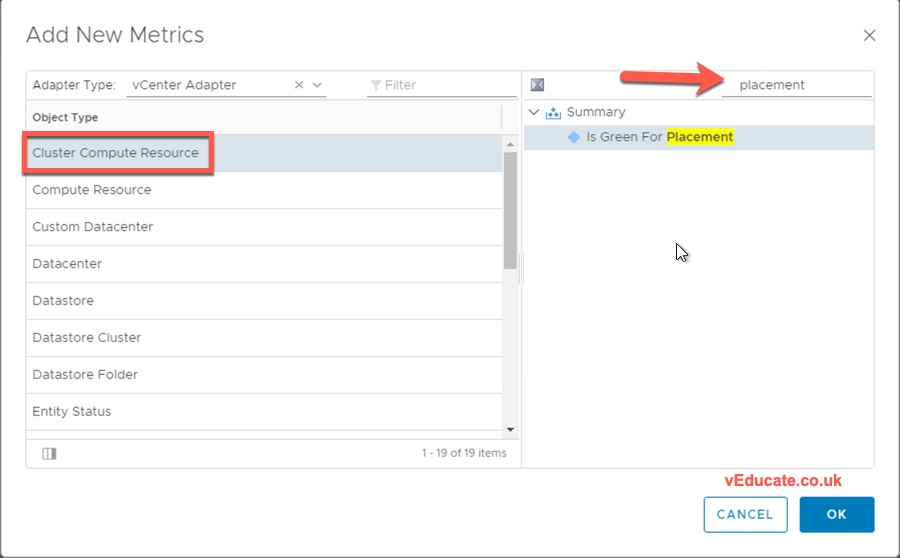
- Metric = Select custom > pick metric and search as in the below screenshot
- Adapter Type = vCenter Adapter
- Object Type = Cluster Compute Resource
- Search for the “Is Green For Placement” metric (or filter like I have)
5. Click the Input Data bar at the bottom of the configuration dialog
- Click the green +
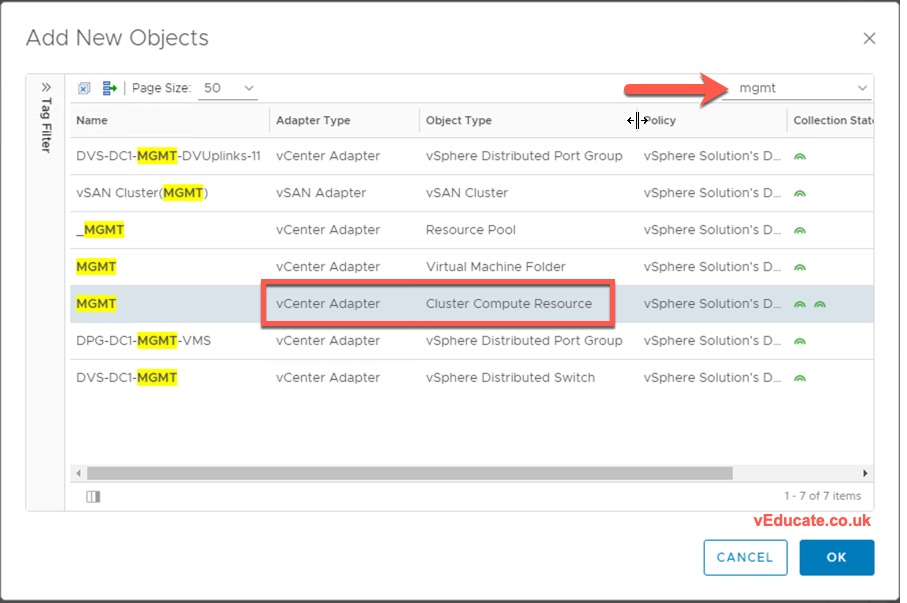
6. Search for your chosen vSphere Cluster
- Make sure you select the object type = Cluster Compute Resource
Save the dashboard configuration.
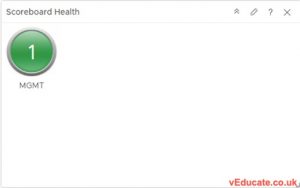
And now you have a nice widget that will turn Red when your cluster CPU or RAM hits 80%+
You can download the dashboard I created for this Blog Post at the VMware {code} website.
Regards
Dean
