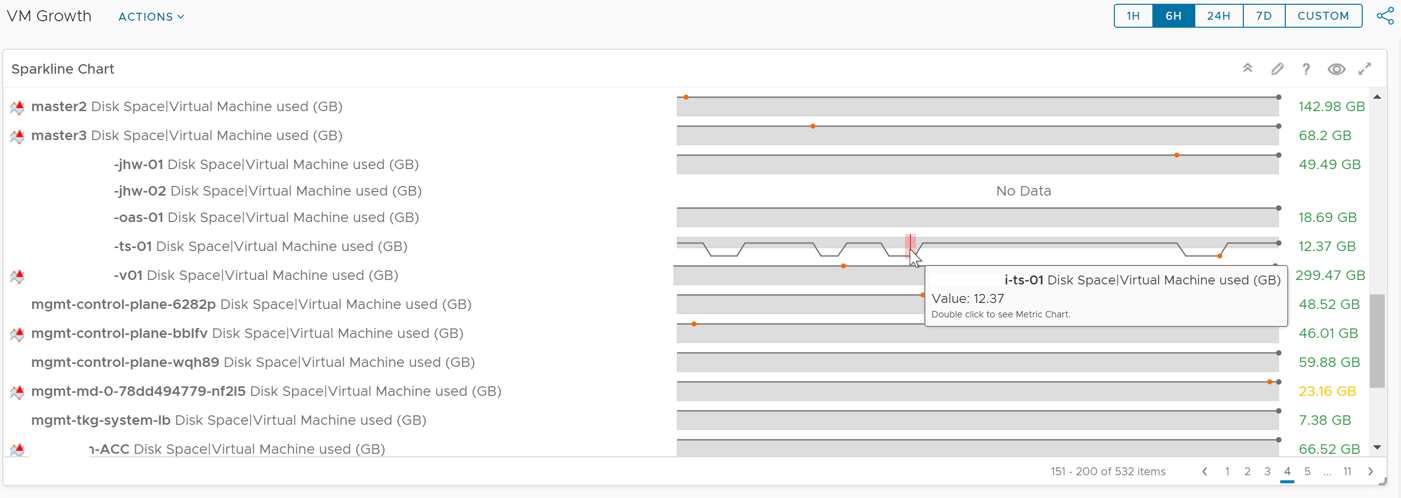
I came across an interesting query on Reddit regarding vRealize Operations Manager (vROPs), summarised the query;
“Can I have a vROPs report/dashboard which shows me the storage usage by VMs over the past 3 days”
The short answer is yes, and I produced the following dashboard, views and report and uploaded to code.vmware.com for the post author to use.
My dashboard has two elements to keep things simple;
- A sparkline widget of VM’s storage used, the time frame show can be controlled in the dashboard view in the top-right hand corner
- A list view of the VMs storage used covering a few metrics
- Current Disk used
- Disk Used (3 days ago)
- Change of disk used (in GB)
- Change of disk used (in %)
So, let’s look at how I created this.
Creating a Sparkline widget in the Dashboard
Create your dashboard, which will show you a blank canvas. Set the Dashboard name.
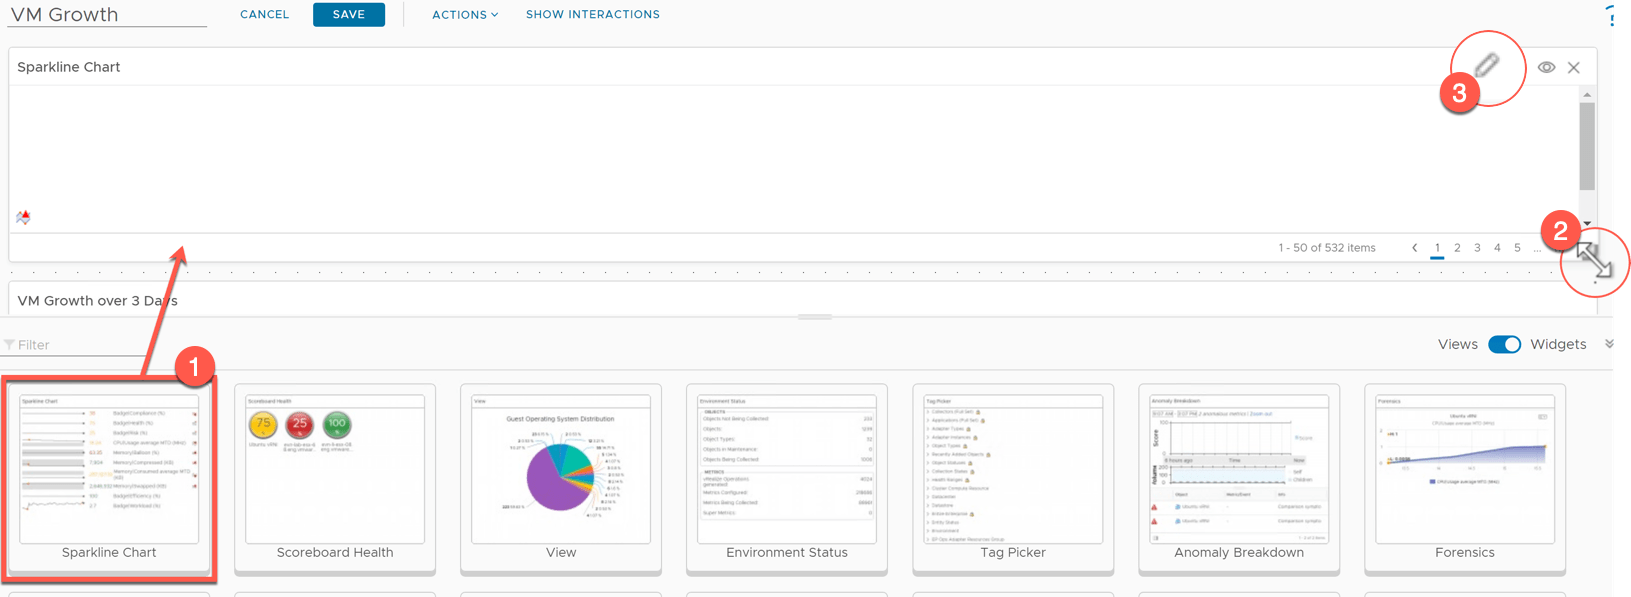
- Drag the Sparkline Chart widget onto the canvas and resize as needed, you’ll see this option appear by hovering over the edge of the widget.
- Click the pencil icon to edit the widget settings.
Configure the Widget configuration. The most important options here are;
- Self Provider – On
- Show Object Name – On
- Column Sequence – Label First
This means the widget will provide its own metric data to be displayed. It is not linked to other objects on the dashboard, as we are keeping this as a simple view. Continue reading How to build vROPs dashboard for tracking VM Growth over X days


