In this Blog post I am going to detail how I created a vROPs dashboard based on a customer’s request.
Can we track how many VMs have been created in the past week and track if the number increases or decreases in each cluster?
If you want to just get the dashboard, see directly below, if you want to learn how it was created, keep reading further.
Installing Dashboard
- Download the files from code.vmware.com sample page.
- Import the files appended with “view” under the view’s in vROPs
- Import the file appended with “Dashboard” under the dashboard section in vROPs.
Dashboard Breakdown
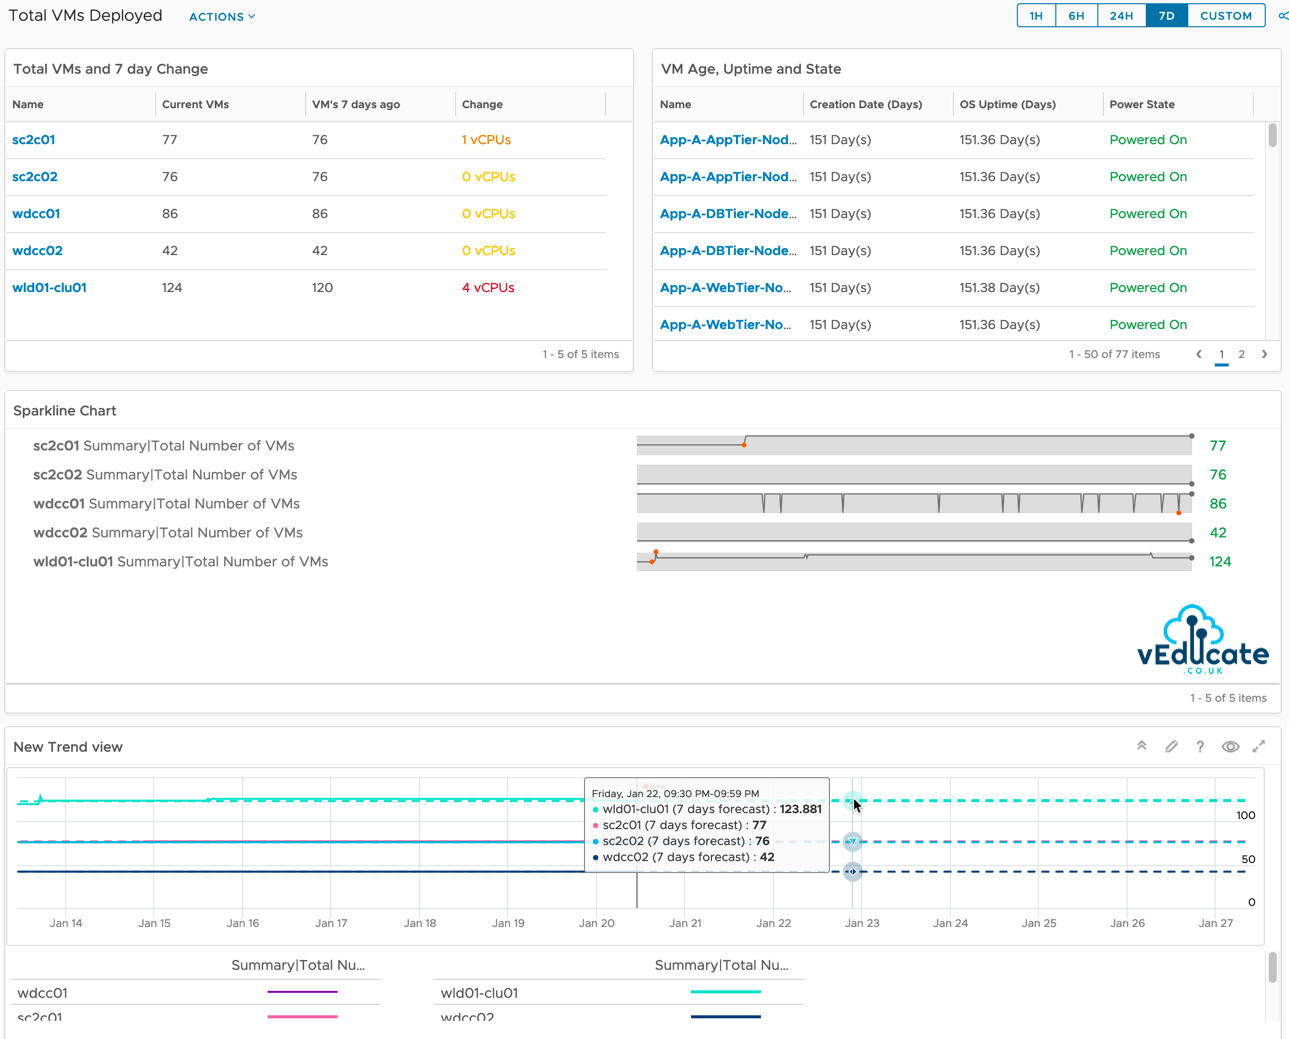
- First Item – This is a list which I’ve created to show each cluster, the total VM metric with some expressions attached, the timescale here is fixed by the list view and not affected by the dashboard timeframe. The change is an expression of the count of VMs at the start and end of the timeframe. I’ve added in some basic colouring to alert at thresholds.
- Why does it say vCPUs? When using expressions, it requires a Unit to be affixed. This doesn’t work if you’re counting something, so in our next release, this issue should be addressed. It’s purely a vanity thing.
- Second Item – This shows the VMs attached to the cluster you select on the left-hand side, showing you how old that VM is, its uptime and current power state.
- Third is a Sparkline – Showing an easy view of the changes in total VMs per cluster over a 7-day period (as defined by the dashboards time scale)
- Forth item is a trend graph, where we are showing date of the changes in the Total VM metric based on the data we have, and the trend/forecast. This trend into the future is set within the item itself. Currently we can set this to show the forecast for the next 366 days in the future.

vROPs versions
To show the VM creation date, this metric is available in vROPs 8.2 and later. This dashboard/view should work with older versions of vROPs but omit the data for the missing metric.
How was the dashboard created?
First, we need to create three views. Continue reading How to build a vROPs dashboard for tracking Total VMs deployed and Growth Trend
