Tag Archives: How to

Helm Pac-Man Header

Creating and hosting a Helm Chart package to install Pac-Man on Kubernetes

If you’ve have been following any of my blogs that relate to Kubernetes, I am sure that you will have seen the use of my demo application Pac-Man, designed to replicate a small production application with a front end UI service, DB back end service and load balancing service.

If not, you can find it here:

In this blog post, I am going to cover how I create a Helm Chart package to install the application on a Kubernetes cluster, and then host it on GitHub so that it can be re-used as necessary between different clusters.

This was on my to-do list for quite a while, as I wanted to explore Helm in more detail and understand how the charts work. What better way to do this than create my own?

What is Helm and why use it?

Helm is a tool that simplifies the installation and lifecycle of Kubernetes applications. As an example, it is a little bit like Brew or Yum for Linux.

Helm uses a package format called charts; these charts are a collection of files that describe a related set of Kubernetes resources. These charts can range from the simple, deploy a single pod, deployment set, etc, to the complex, deploy a full application made up of Deployments, StatefulSets, PVCs, Ingress, etc.

Helm has become over the years one of the defacto client tools to use for simplification of deploying an application to your Kubernetes environment. Take Kasten for example, to deploy their K10 software, their guide gives you only the Helm commands to do so.

You can install Helm from the below script, for other methods please see their official documentation.

curl -fsSL -o get_helm.sh https://raw.githubusercontent.com/helm/helm/main/scripts/get-helm-3

chmod 700 get_helm.sh

./get_helm.sh
Creating a template Helm Chart

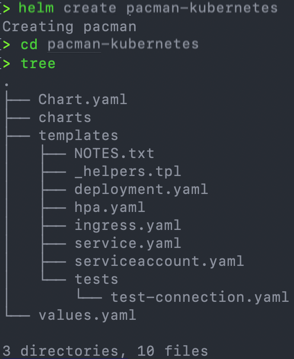
The Helm Client makes it easy to get started from scratch, you can create a template chart by running the following command, which creates a folder of the name you specify, with a number of example files you can use.

helm create {name}

# For this blog post I ran the following

helm create pacman-kubernetes

helm create pacman-kubernetes

In more detail, this structure offers the following: Continue reading Creating and hosting a Helm Chart package to install Pac-Man on Kubernetes

kasten vmware red hat openshift header

How to install and configure Kasten to protect container workloads on Red Hat OpenShift and VMware vSphere

In this blog post I’m going to cover deploying and configuring Kasten, the container based enterprise backup software now owned by Veeam Software.

This deployment will be inside my Red Hat OpenShift Environment which is running on top of VMware vSphere.

I’ll be protecting a cool gaming application that has data persistence using MongoDB.

Installing Kasten on Red Hat OpenShift

In this guide, I am going to use Helm, you can learn how to install it here.

Create a OpenShift project (Kubernetes namespace) called “kasten-io”

oc new-project kasten-io

oc new project kasten-io

Next we are going to use Helm to install the Kasten software into our OpenShift cluster.

helm install k10 kasten/k10 --namespace=kasten-io --set scc.create=true --set route.enabled=true --set route.path="/k10" --set auth.tokenAuth.enabled=true

Breaking down the command arguments;

  • –set scc.create=true
    • This creates the correct Security Contexts against the users created by the install. This is needed in OpenShift as the security context stance is higher OOTB than that of a vanilla Kubernetes install.
  • –set route.enabled=true
    • This creates a route in OpenShift using the default ingress, so that the Kasten dashboard is accessible externally. This will use the default cluster ID domain name.
  • –set route.path=”/k10″
    • This sets the route path for the redirection of the dashboard. Without this, your users will need to go to http://{FQDN}/ and append the path to the end (k10).
  • –set auth.tokenAuth.enabled=true

helm install k10 kasten kasten-io Continue reading How to install and configure Kasten to protect container workloads on Red Hat OpenShift and VMware vSphere

vRealize Operations Header

How to build a vROPs dashboard for tracking Total VMs deployed and Growth Trend

In this Blog post I am going to detail how I created a vROPs dashboard based on a customer’s request.

Can we track how many VMs have been created in the past week and track if the number increases or decreases in each cluster?

If you want to just get the dashboard, see directly below, if you want to learn how it was created, keep reading further.

Installing Dashboard
  1. Download the files from code.vmware.com sample page.
  2. Import the files appended with “view” under the view’s in vROPs
  3. Import the file appended with “Dashboard” under the dashboard section in vROPs.
Dashboard Breakdown
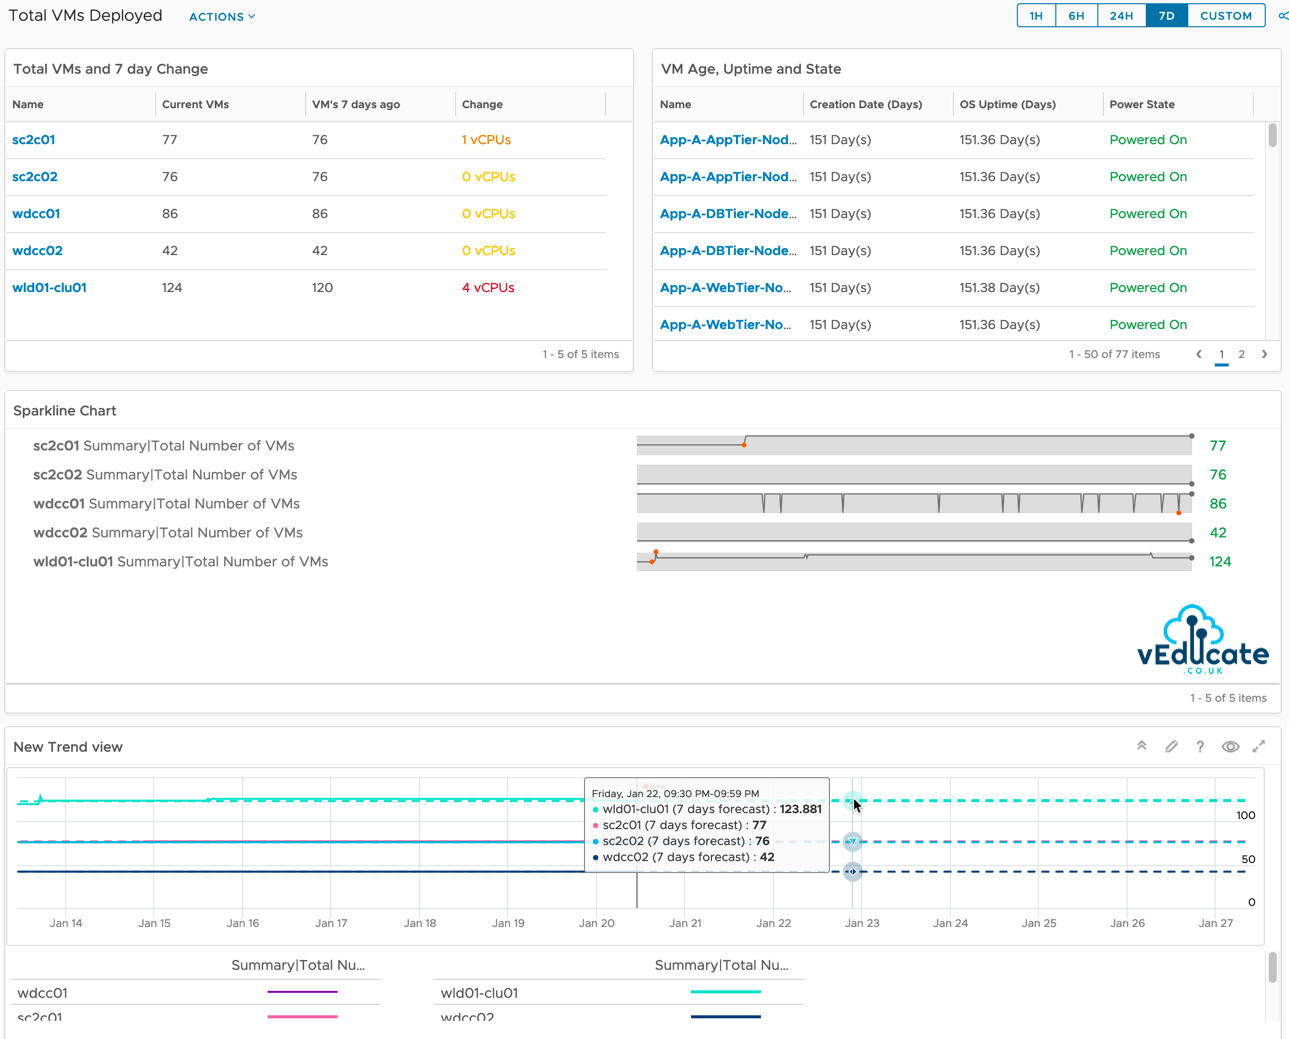
  • First Item – This is a list which I’ve created to show each cluster, the total VM metric with some expressions attached, the timescale here is fixed by the list view and not affected by the dashboard timeframe. The change is an expression of the count of VMs at the start and end of the timeframe. I’ve added in some basic colouring to alert at thresholds.
    • Why does it say vCPUs? When using expressions, it requires a Unit to be affixed. This doesn’t work if you’re counting something, so in our next release, this issue should be addressed. It’s purely a vanity thing.
  • Second Item – This shows the VMs attached to the cluster you select on the left-hand side, showing you how old that VM is, its uptime and current power state.
  • Third is a Sparkline – Showing an easy view of the changes in total VMs per cluster over a 7-day period (as defined by the dashboards time scale)
  • Forth item is a trend graph, where we are showing date of the changes in the Total VM metric based on the data we have, and the trend/forecast. This trend into the future is set within the item itself. Currently we can set this to show the forecast for the next 366 days in the future.

vROPS - Total VMs Deployed and Growth Trend

vROPs versions

To show the VM creation date, this metric is available in vROPs 8.2 and later. This dashboard/view should work with older versions of vROPs but omit the data for the missing metric.

How was the dashboard created?

First, we need to create three views. Continue reading How to build a vROPs dashboard for tracking Total VMs deployed and Growth Trend

backup header

How to produce good documentation – Part 5 – Diagraming your (Veeam) Backups

So it’s just been a little over a year since Part 4 of my how to document series was posted. I hoped to keep adding to the series, but at the same time, only do it when I felt I had relevant content to share. So this post is to show how I have documented some recent backup configurations. Note: I mainly work with Veeam, but hopefully this will give you idea’s of how to present the setup of your other backup software

Below are the previous posts;

The challenge

Note: The Visio file for these examples can be found at the end of the blog post.

Your backups evolve over time, as does your environment. Your backup schedules become more complex, and its hard to remember, what does what.

As past of my job, I setup backup solutions for customers, and then have the task of documenting how they are setup. I used to do this in a table format. It was quite simple

  • Backup/replication job name
    • Services backed up
    • Job settings
      • Storage/environment used

When you have a number of backup jobs, you have a lot of jobs and information to dig through. Its not user friendly.

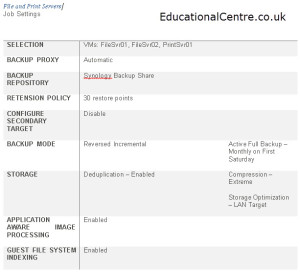
Veeam backup job settings table 1 Veeam backup job settings table 2

So I re-visualised the way to present the data, I still have the detailed tables, however I also have three Visio diagrams

  • Backup Architecture setup
  • Backup and Replication jobs – Servers/services included
  • Backup and Replication job settings – high level

Continue reading How to produce good documentation – Part 5 – Diagraming your (Veeam) Backups

visio networks

How to produce good documentation – Part 4 – Diagraming a network

So in my last post, I looked at how to record the logical information about your IP addresses and switchport locations, making it easier for troubleshooting in the future.

Now lets tackle the big one, how to produce good documentation when diagraming your network.

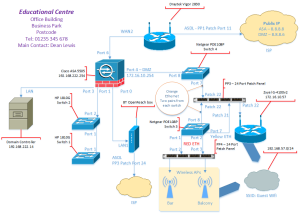
For this, I am going to use a real world example of a network I audited, and then made a visio diagram. Personally, I don’t believe this is one of the best visio diagram’s I have produced, however it includes a lot of various parts which I think are useful.

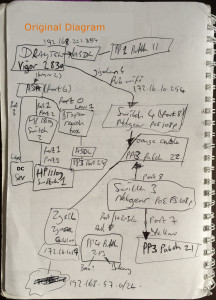
So below, you find the original hand drawn diagram as I was tracing cables and devices, and then the final product.

Note: Unfortunately I do not have the Visio file available for distribution used in this post.

The diagram

original diagramNetwork Diagram

Starting off

Continue reading How to produce good documentation – Part 4 – Diagraming a network