So it’s just been a little over a year since Part 4 of my how to document series was posted. I hoped to keep adding to the series, but at the same time, only do it when I felt I had relevant content to share. So this post is to show how I have documented some recent backup configurations. Note: I mainly work with Veeam, but hopefully this will give you idea’s of how to present the setup of your other backup software
Below are the previous posts;
- Part 1 – The foundation of any IT infrastructure
- Part 2 – Rack and Server Diagrams
- Part 3 – Network IP’s & Interfaces
- Part 4 – Diagramming a network
The challenge
Note: The Visio file for these examples can be found at the end of the blog post.
Your backups evolve over time, as does your environment. Your backup schedules become more complex, and its hard to remember, what does what.
As past of my job, I setup backup solutions for customers, and then have the task of documenting how they are setup. I used to do this in a table format. It was quite simple
- Backup/replication job name
- Services backed up
- Job settings
- Storage/environment used
When you have a number of backup jobs, you have a lot of jobs and information to dig through. Its not user friendly.
So I re-visualised the way to present the data, I still have the detailed tables, however I also have three Visio diagrams
- Backup Architecture setup
- Backup and Replication jobs – Servers/services included
- Backup and Replication job settings – high level
This then gives you a quick snapshot.
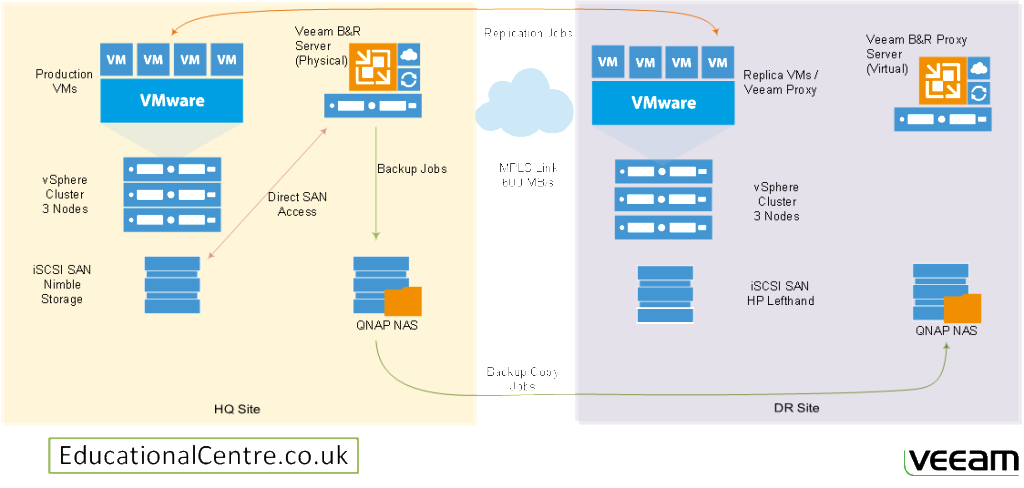
Backup Architecture Diagram
So this is the conceptual overview, for me, its easy, I setup Veeam in supported configurations, taking advantage of its many features, such as direct SAN backups.
So here I am essentially re-working Veeam’s own diagrams of how they show their software working. At this level, I do not bother with server names and IP addresses, but there is nothing stopping you from doing that.
I find this diagram is helpful for support engineers to quickly understand the environment when troubleshooting issues. But at the same time, when Veeam has issues, they have done a good job of providing meaningful error messages (unlike Backup exec).
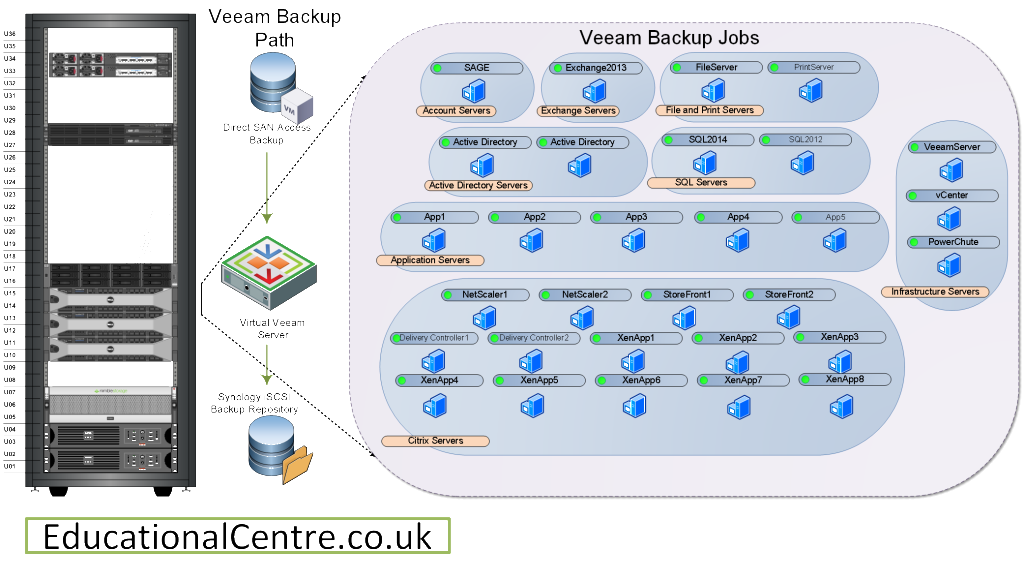
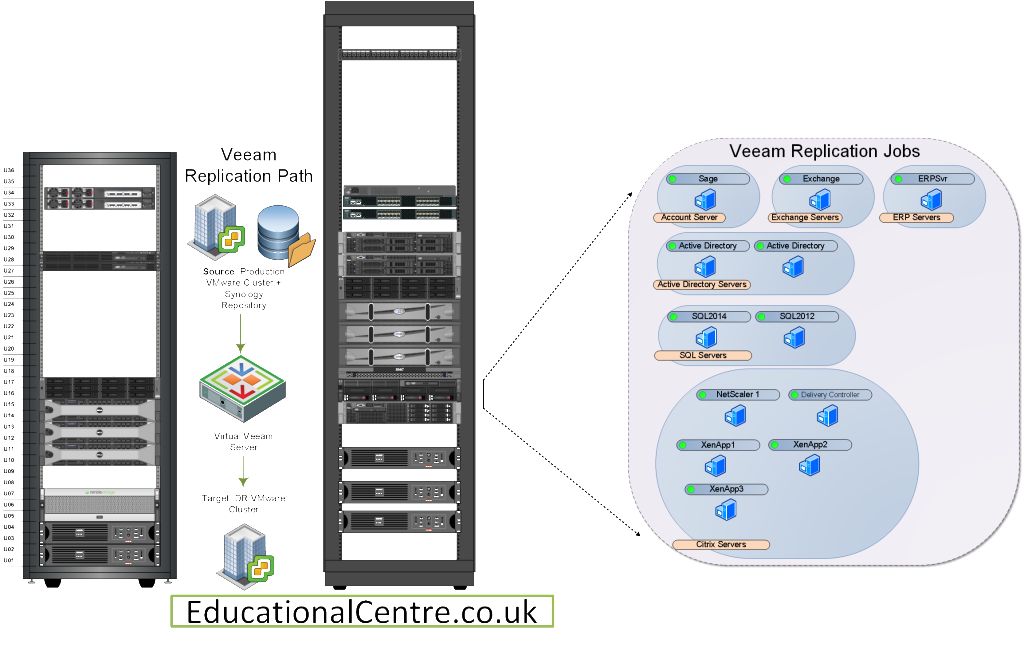
Now onto visualising each backup and replication job, and more importantly, which servers/services are included in each job.
To complete the visualisation, I decided to included the rack diagrams, which I covered in Part 2 of this series. As well as showing the architectural components involved.
It’s quite simple, a container for each job, and the name of each server/service included in the job.
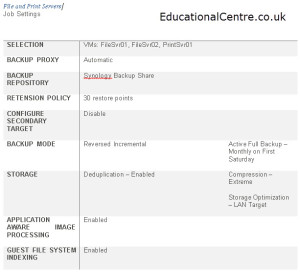
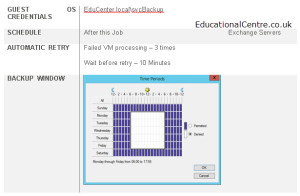
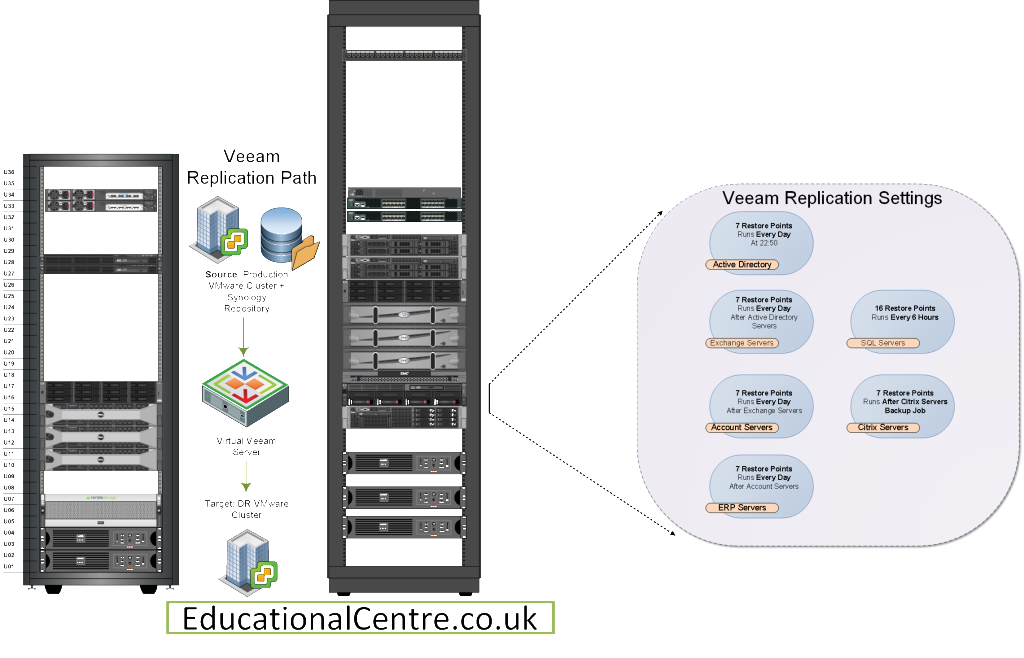
Backup and Replication Jobs – Settings
So this is pretty simple, a copy and paste of the above, then remove the server icons, and insert the headline job settings that you need to know.
Here in this example I’ve used;
- Restore points to keep
- How often does it run
- When does it run / Linked to any jobs?
Visio File – Dropbox Link
I hope this helps, if anyone has any suggestions on how to improve the above, or wants to chat about how they document their environment, either online or offline, let me know. For now, I’ll leave you with one of my favourite Dilbert sketches.
Regards
Dean
Follow @saintdle



Finally something simple and practical to allow me to finish off my documentation of our backup environment. I really appreciate this. thanks a lot.
Thank you for your comment! Really appreciate it!