- Part 1 – The foundation of any IT infrastructure
- Part 2 – Rack and Server Diagrams
- Part 3 – Network IP’s & Interfaces
- Part 4 – Diagraming a network
- Part 5 – Diagraming your (Veeam) Backups
So in my last post, I looked at how to record the logical information about your IP addresses and switchport locations, making it easier for troubleshooting in the future.
Now lets tackle the big one, how to produce good documentation when diagraming your network.
For this, I am going to use a real world example of a network I audited, and then made a visio diagram. Personally, I don’t believe this is one of the best visio diagram’s I have produced, however it includes a lot of various parts which I think are useful.
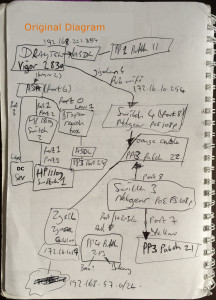
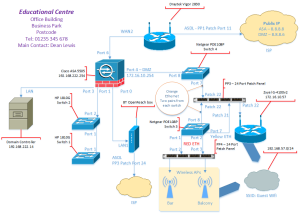
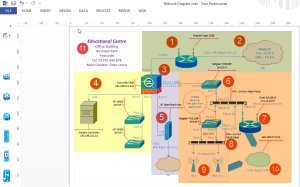
So below, you find the original hand drawn diagram as I was tracing cables and devices, and then the final product.
Note: Unfortunately I do not have the Visio file available for distribution used in this post.
The diagram
Starting off
I used Microsoft Visio to create the diagram, and the stencil was the Cisco Network Topology Icons.
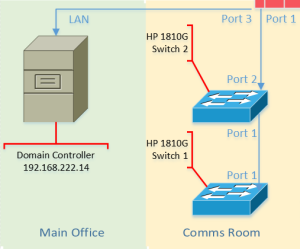
Most of the equipment displayed in the diagram was in the same server room, which made it easy for me. If equipment was located in different rooms, I could have used the containers within visio show where devices are located. As below;
When manually drawing my diagram, I started from the edge of the network, which in this case was the Draytek vigor, where the main internet line is connected. From here, I have listed all the connections from this device, and essentially followed the daisy chain.
Putting pen to paper
As this is a remote site we need to support, I marked down which ports are used to link the device, and made sure this corresponds with any markings on the device, and thats why in the full diagram, you will see a mix of terms used for the ports between devices, such as WAN Port, and just simply “Port”.
Each device is listed with any applicable IP address, which in a troubleshooting situation can be used for tracing failed devices, such as can you ping this device……
So here is a quick checklist of the information I was trying to capture;
Device Make and Model- IP address
- Connections
- To Patch ports (inc Patch Number)
- To other devices (Port name on both sides)
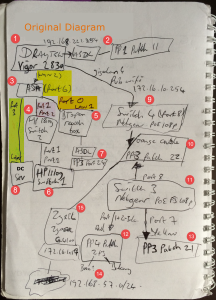
Below I’ve numbered in order how I drew out the diagram, starting from the internet edge device, and then down into each strand of the network.
Also highlighted is that of the ports in use between connections, that way in the future, if someone goes and unplugs it all, we know roughly where it all went.
The better your paper diagram, the better your visio diagram will be. You can see that on here I haven’t been able to trace everything, so I’ve listed other information such as the patch panel number and the patch port which the device goes to. In the future I can then do some more investigation work, as needed.
You’ll also notice if you look closely at the paper diagram to the Visio diagram, I slightly changed the topology, as once on site and understanding how things worked, I connected the Netgear POE switch, listed as Switch 4, directly into the ASA, where it previously connected to the vigor. Rather than try to redo my diagram, or cross things out, I simply wrote a note of where it was and where it is now.
From paper to Visio
This is the easy bit, but time consuming.
I started from the edge device again, and built out the diagram from the connections around the Draytek.
I split the network up into multiple area’s, which made the positioning of devices much easier, and meant wasn’t constantly moving icons around.
- Primary Internet Connection (Green)
- Client Access Devices and Servers (Yellow)
- Backup Internet Connection (Purple)
- Wireless Infrastructure (Orange)
Once the icon’s are down, I’ve just inserted the information captured, as bullet pointed earlier, such as the connections and device information.
In the top left hand corner, I’ve added basic details about the Site where this network is, such as address, the telephone number and main contact for that site.
Something which basic, however can save a few minutes hunting around.
It’s also advised to add your details as the author to the document, for me, we use sharepoint for document version and tracking, so my information is kept alongside the document once it is uploaded.
Looking at the different network “Areas”
Lets look at these areas in a bit more detail;
Primary Internet Connection
Here I’ve recorded additional information such as the static IP addresses in use, it’s not uncommon for ISP’s to go and change these without warning, it also saves you looking through configuration of a router or firewall as well.
The draytek connects to the internal via ASDL line, which is not located in the server room, I couldn’t find exactly where it went to, so I made sure I listed the patch port in use, and in the future myself or another colleague can go and trace that port.
Client Access Devices
Pretty basic here, no need to list every workstation connection, however more important devices such as Servers have been listed. I have included the switch names used, as physically they are labelled in numerical order, however you’ll see that the way they are connected is actually back to front.
Wasn’t me who did that I’m afraid.
Backup Internet Connection
Nice and simple, just how the modem device connects to/from the network
Wireless infrastructure
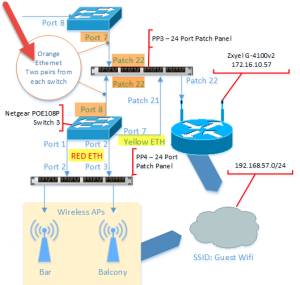
This was the one which was a bit more complicated, mainly because a custom cable was used to connect both POE switches to ONE patch panel port, to provide power to the Zyxel Wireless controller.
To so this, I used basic shapes and lines with annotation in the middle of the bubble. I also capture the cable colours in use, as it was clear that someone had made an effort to standardise when cabling.
From here, I then inserted the connections to the AP’s and listed physically where they are, and used the cloud icon to show the wireless SSID configured on the Controller and broadcasted by the AP’s. I also listed the Network ranges used for the wireless infrastructure management, and the network range for the wireless SSID.
Funnily enough, I have realised whilst writing this blog post I never listed the connection from the Wifi Controller to the LAN, it’s actually connected on the opposite end of patch port 21, with patch 22 going to the controllers POE port for power.
Told you it wasn’t perfect.
Summary
My aim here isn’t to teach you how to use visio, but how to get the correct information down so you can build a meaningful and useful visio diagram.
My top tips are to start at the edge of the network, if it’s a small one, if the network is large, then start at the core devices and build your way out, think of a kind of spiral motion.
List the connections between devices, and patch ports, if they go off to a special connection, such as in my case, ASDL lines.
When producing your visio diagram, build it out in area’s if there are multiple components. And in the case of those large networks, don’t try to squeeze all the different infrastructures into one visio diagram, split it out, concentrating on the different technologies and infrastructures per diagram. There is no reason why they cannot cross over and reference one another.
If this post is useful to you, and you’d like to see more in this area around creating diagrams, please let me know in the comments below or on twitter.
Regards
Dean
Follow @saintdle

Great post ever use cisco packet tracer
For testing the configuration of cisco features only,
not for network design
Thanks. That was really helpful.
Thank you!
Great post. Couldn’t agree more with your approach of sketching it out first before committing to visio. This approach has always helped me develop my understanding of the network as well, sketching while speaking to myself, thinking out loud. Great psot