In this post, I will cover how to deploy Prometheus and the Telegraf exporter and configure so that the data can be collected by vRealize Operations.
Overview
Delivers intelligent operations management with application-to-storage visibility across physical, virtual, and cloud infrastructures. Using policy-based automation, operations teams automate key processes and improve the IT efficiency.
Is an open-source systems monitoring and alerting toolkit. Prometheus collects and stores its metrics as time series data, i.e. metrics information is stored with the timestamp at which it was recorded, alongside optional key-value pairs called labels.
There are several libraries and servers which help in exporting existing metrics from third-party systems as Prometheus metrics. This is useful for cases where it is not feasible to instrument a given system with Prometheus metrics directly (for example, HAProxy or Linux system stats).
Telegraf is a plugin-driven server agent written by the folks over at InfluxData for collecting & reporting metrics. By using the Telegraf exporter, the following Kubernetes metrics are supported:
Why do it this way with three products?
You can actually achieve this with two products (vROPs and cAdvisor for example). Using vRealize Operations and a metric exporter that the data can be grabbed from in the Kubernetes cluster. By default, Kubernetes offers little in the way of metrics data until you install an appropriate package to do so.
Many customers have now decided upon using Prometheus for their metrics needs in their Modern Applications world due to the flexibility it offers.
Therefore, this integration provides a way for vRealize Operations to collect the data through an existing Prometheus deploy and enrich the data further by providing a context-aware relationship view between your virtualisation platform and the Kubernetes platform which runs on top of it.
vRealize Operations Management Pack for Kubernetes supports a number of Prometheus exporters in which to provide the relevant data. In this blog post we will focus on Telegraf.
You can view sample deployments here for all the supported types. This blog will show you an end-to-end setup and deployment.
Prerequisites
- Administrative access to a vRealize Operations environment
- Install the “vRealize Operations Management Pack for Kubernetes”
- Official Documentation
- Marketplace Download Page (sign in required for free download)
- Install the “vRealize Operations Management Pack for Kubernetes”
- Access to a Kubernetes cluster that you want to monitor
- Install Helm if you have not already got it setup on the machine which has access to your Kubernetes cluster
- Clone this GitHub repo to your machine to make life easier
git clone https://github.com/saintdle/vrops-prometheus-telegraf.git
Information Gathering
Note down the following information:
- Cluster API Server information
kubectl cluster-info
- Access details for the Kubernetes cluster
- Basic Authentication – Uses HTTP basic authentication to authenticate API requests through authentication plugins.
- Client Certification Authentication – Uses client certificates to authenticate API requests through authentication plugins.
- Token Authentication – Uses bearer tokens to authenticate API requests through authentication plugin
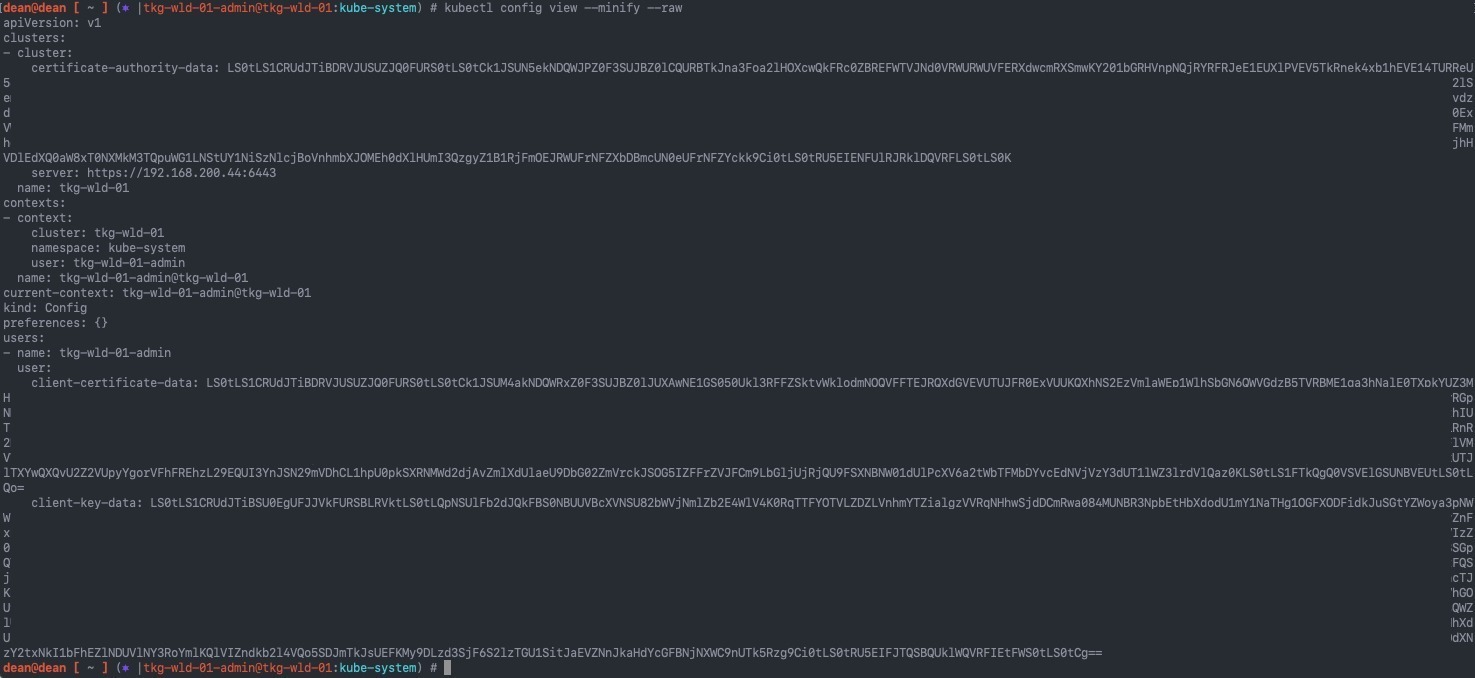
In this example I will be using “Client Certification Authentication” using my current authenticated user by running:
kubectl config view --minify --raw
- Get your node names and IP addresses
kubectl get nodes -o wide
Install the Telegraf Kubernetes Plugin
Copy the correct Linux or Windows (depending on your container node OS) Telegraf plugin from the vRealize Management pack documentation page, to your machine:
- Telegraf Kubernetes Plugin Setup for Windows And Linux
- Backup copy here for the linux version
Alternatively, you should have cloned my repo, and it will be there too.
The reason why I ask you to copy this down locally is because of the use of variables in the YAML file, if you paste these into the interpreter to create the Kubernetes config using something like:

    kubectl create -f << EOF -
    something
    EOF

The linux interpreter replaces these values with input from the environment, if there is no matching input, the value is returned as Null, so $NODE_IP for example gets wiped out.
Apply the configuration:
kubectl create -f Telegraf\ Kubernetes\ Plugin\ for\ Linux.yaml
You can then monitor the pods with the command, as this installs a DaemonSet, a pod will run on each node in the cluster:
kubectl get pods -n kube-system -l app=vrops-telegraf-k8s
If you need to troubleshoot the Telegraf Kubernetes plugin you can run the following command:
kubectl logs {pod_name} -n kube-system
# Example
kubectl logs vrops-telegraf-k8s-4wrvt -n kube-system
Install Prometheus Server and configure the exporter
Now we are going to install Prometheus into our Kubernetes cluster, it is also supported to deploy this on a virtual machine outside of your Kubernetes cluster instead, in a larger environment this might be preferable.
I have provided a cut down helm values file in my GitHub Repo which configures the following:
- Install only “Prometheus Server”
- Configure service using a Load Balancer
- Setup config map that creates “prometheus.yaml” file with the correct scraper configuration
You will need to edit this file to include your node details we collected earlier; this allows Prometheus to scrape the data from the Telegraf exporter.
- Official documentation – Add Telegraf Exporter
Alternatively, you can update the Config Map after Prometheus is deployed using the following command:
kubectl edit configmap prometheus-server -n {namespace}
The below way allows you to setup this configuration as part of the Helm install command, I personally think this makes life easier.
# Under the scrape_configs block
    scrape_configs:

# if you want to use the node-exporter default plugin, you need one of these blocks for each node in your cluster
    - job_name: 'node-exporter'
      static_configs:
      - targets: ['node_ip:9100' ]
        labels:
          nodename: 'nodename'

# Job to scrape the telegraf exporter, you can add multiple values to the targets block, port 31196 for Linux. port 31197 for Windows
    - job_name: 'telegraf-exporter'
      static_configs:
      - targets: ['node_ip_01:31196', 'node_ip_02:31196', 'node_ip_03:31196' ]
Here is my example config from line 509 in my example values file, based on the information collected at the start of the blog post:
  prometheus.yml:
    scrape_configs:
    - job_name: 'node-exporter'
      static_configs:
      - targets: ['192.168.200.176:9100' ]
        labels:
          nodename: 'tkg-wld-01-control-plane-2f7bt'
      - targets: ['192.168.200.180:9100' ]
        labels:
          nodename: 'tkg-wld-01-md-0-696f98994f-4bjv6'
      - targets: ['192.168.200.184:9100' ]
        labels:
          nodename: 'tkg-wld-01-md-0-696f98994f-h7ks5'
      - targets: ['192.168.200.185:9100' ]
        labels:
          nodename: 'tkg-wld-01-md-0-696f98994f-zhscz'
      - targets: ['192.168.200.187:9100' ]
        labels:
          nodename: 'tkg-wld-01-md-0-696f98994f-v56p9'
    - job_name: 'telegraf-exporter'
      static_configs:
      - targets: ['192.168.200.177:31196', '192.168.200.174:31196', '192.168.200.186:31196' ]
Now to install Prometheus using the provided values file.
# Add the Prometheus Community Repo to helm

helm repo add prometheus-community https://prometheus-community.github.io/helm-charts

# Create a namespace to install Prometheus into

kubectl create namespace monitoring

# Install Prometheus, this example uses my cut down values file

helm install prometheus prometheus-community/prometheus -n monitoring --values prometheus_values.yaml
You can watch the pods come up with the command:
kubectl get pods -n monitoring
You can get the external address with the below commands which are outputted by the Helm Install.
You will need this address for vRealize Operations Kubernetes adapter configuration.
Get the Prometheus server URL by running these commands in the same shell:

NOTE: It may take a few minutes for the LoadBalancer IP to be available.
You can watch the status of by running 'kubectl get svc --namespace monitoring -w prometheus-server'

export SERVICE_IP=$(kubectl get svc --namespace monitoring prometheus-server -o jsonpath='{.status.loadBalancer.ingress[0].ip}')
echo http://$SERVICE_IP:80
To validate everything has come up, go to the Prometheus Address, in my configuration there is no authentication.
In my below screenshot, you can see I have 3 of 3 targets reporting into Prometheus, this is because I forgot to add in my other two node IP addresses in the config map scraper details.
I can correct that as mentioned above by running the below command, I also fixed my node-exporter, by removing it, as it needs additional configuration in the environment for a control-plane node. In this article we are only concerned with the Telegraf Exporter:
kubectl edit configmap prometheus-server -n monitoring
Configure vRealize Operations to monitor Kubernetes via Prometheus
Log into your vRealize Operations environment.
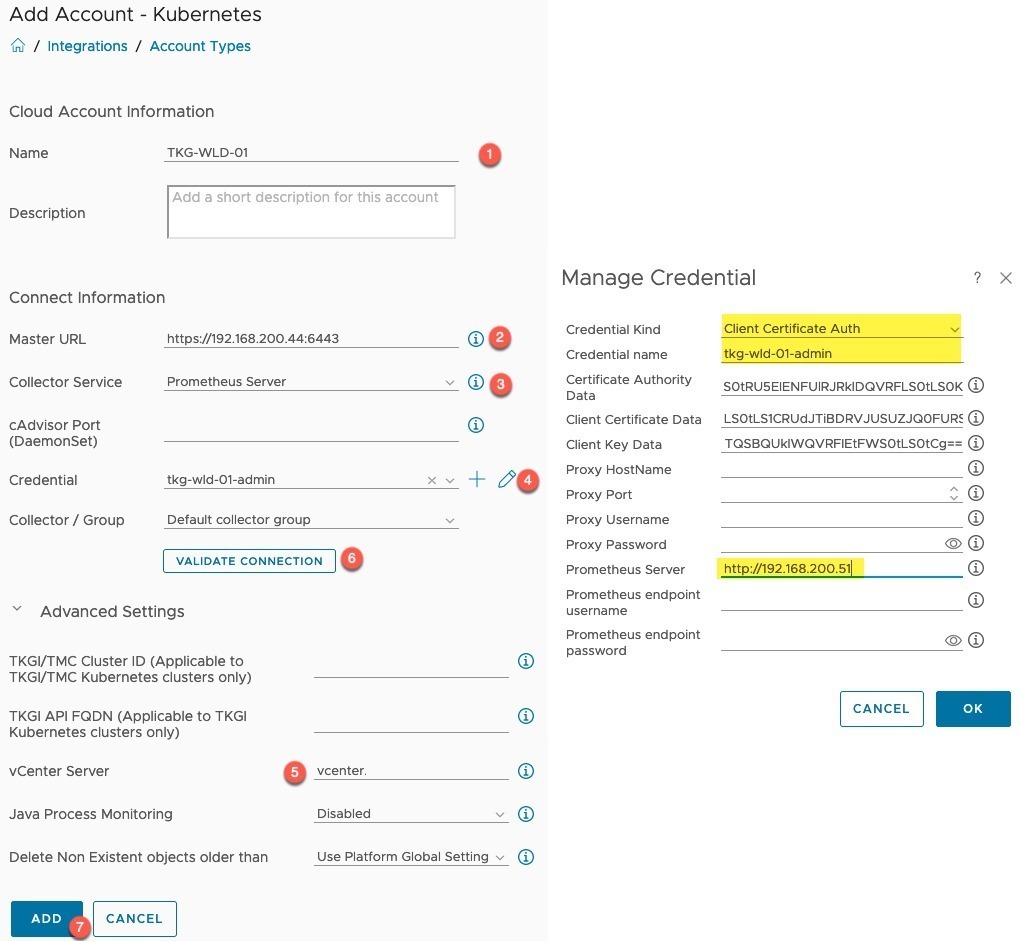
Now let’s configure the adapter.
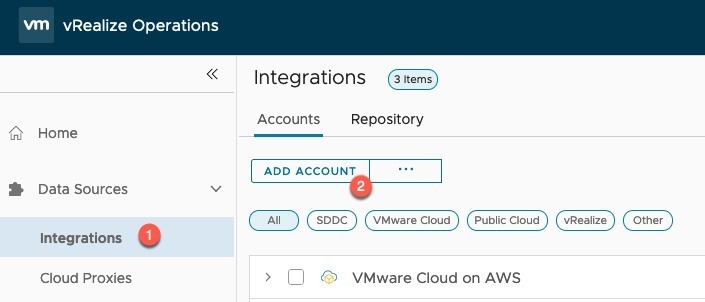
- Click on Integrations (if using the older vROPs you’ll need to click on Administration first)
- Click Add Account
- Select Kubernetes
- Set the name for the adapter
- Set Clusters API address you collected at the information gathering stage
- Set the Collector Service to Prometheus
- Click the “+” symbol to create a new credential
- Select the Credential Type
- Set a credential name
- Set the authentication details for the selected credential type
- Set the Prometheus Server address using either HTTP or HTTPS and the associated port
- Provide any necessary authentication with Prometheus
- Open the Advance settings, set the vCenter server to map the Kubernetes cluster objects to your virtual infrastructure.
- Validate your connection, you will be asked to accept the SSL from the Kubernetes API.
- Click Add adapter
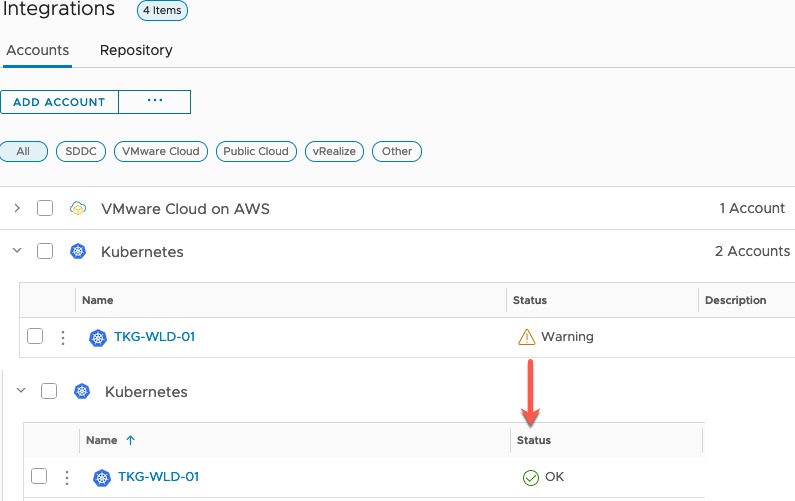
You may see the adapter sit in a warning status for a while whilst the initial data collection is running. After a few minutes my environment turned to OK.
Viewing Kubernetes Telegraf Metrics in vRealize Operations
I won’t go into massive detail about all of the views and dashboards, I covered most of this in an earlier blog post. However, the power of the Telegraf exporter is getting the ability to have Container metrics, from CPU/Memory/Network and Storage resource usage.
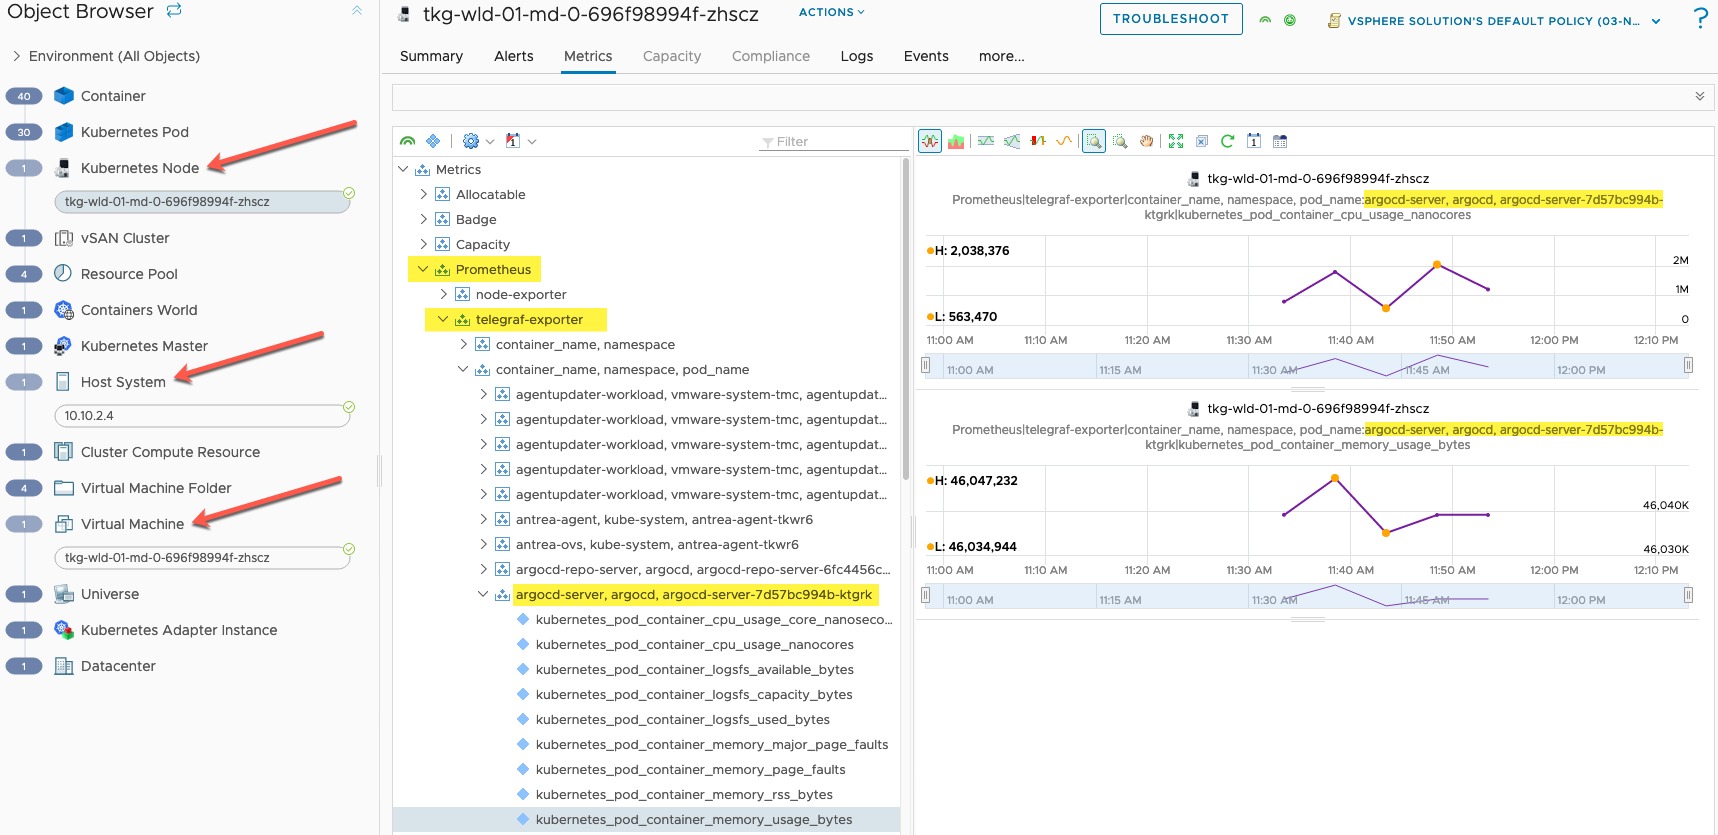
Below you can see on the left-hand navigation pane the mapping of all the Kubernetes objects through to the virtualisation components where they run (mapped to a virtual machine, host etc etc).
In the main metrics screen, I can see Prometheus as a heading, then Telegraf Exporter. I’ve charted out some metrics from the “ArgoCD Server” container for CPU and Memory usage.
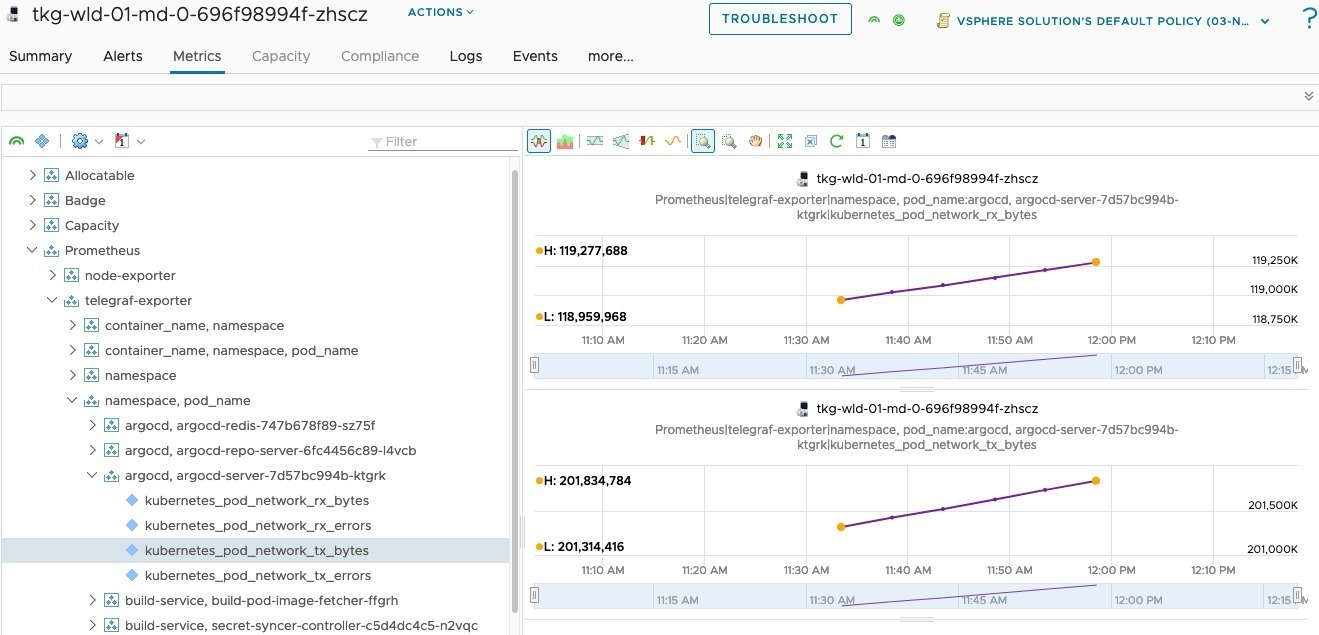
And looking at the same container for networking metrics as well.
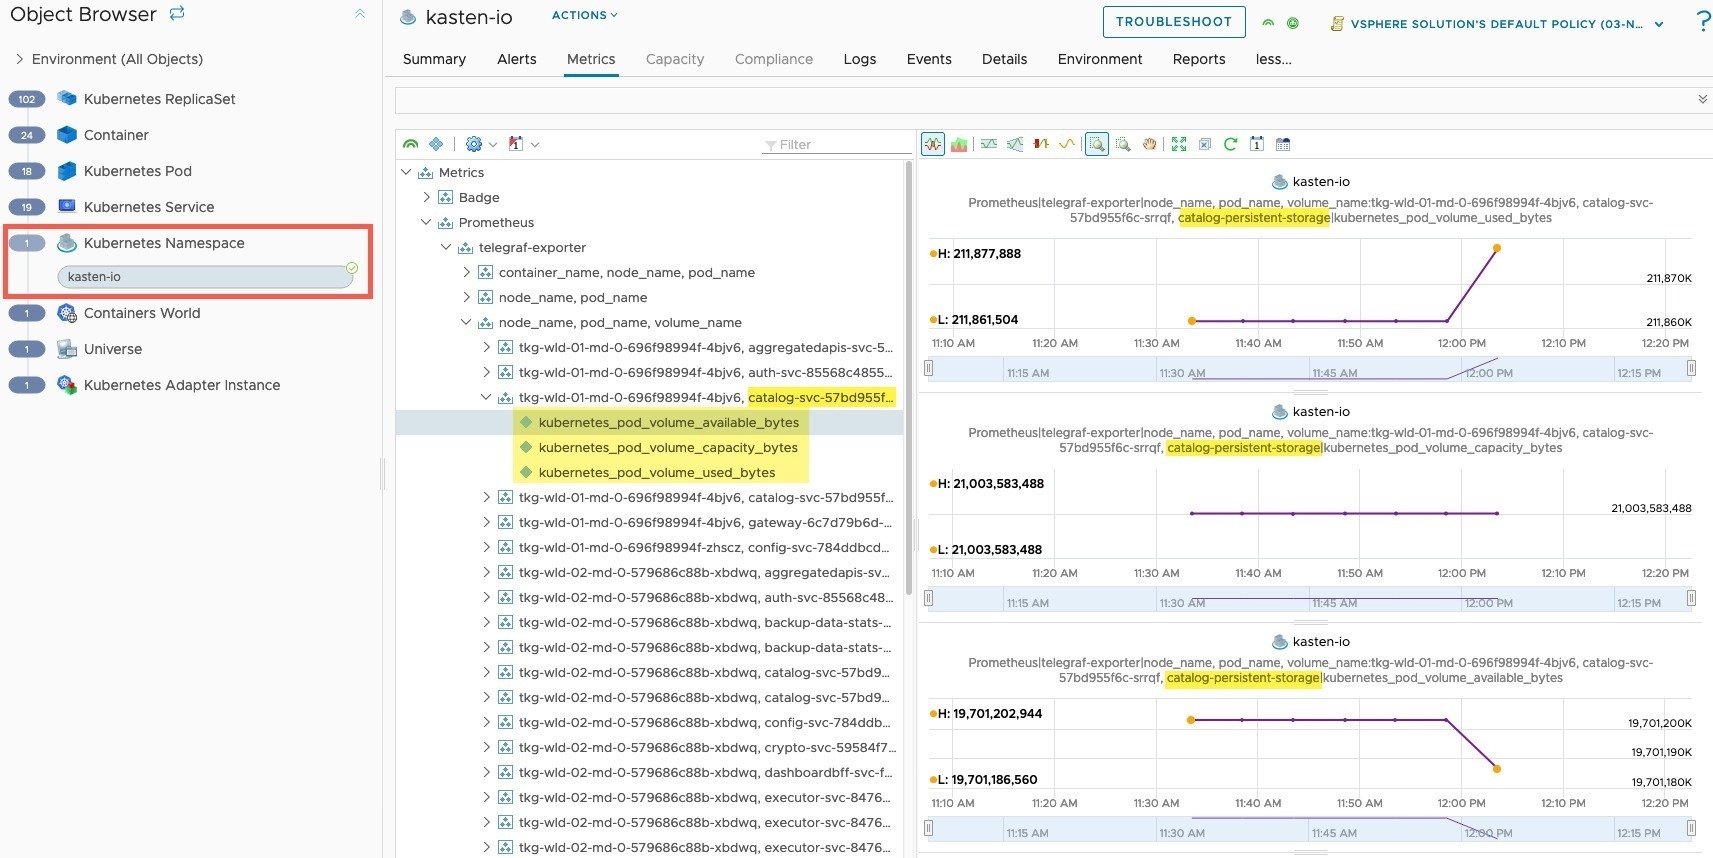
Finally, we can see storage metrics from the point of view from the container as well. As this is my lab environment, not much happens. However, I changed the context to look at my Kasten namespace, and viewing the persistent volume attached to the catalog services, as I know this would show some data usage for the screenshot below.
Summary and wrap-up
I wrote this blog to add more clarity to the official documentation when using Prometheus as an endpoint to pull Kubernetes metrics into vRealize Operations. Of course, you can also choose your exporter of choice, and potentially use other exporters to pull extra information into the system about your Kubernetes clusters and applications.
The key takeaway for me here, is the ability to provide the infrastructure-up view from your virtualisation platform into your Kubernetes cluster. Should you have to work with your Apps team, troubleshooting hopefully has become a little simpler as you now have visibility into their world and systems.
Regards
