In years gone by, costing of your technology platforms was covered in a product called vRealize Business for Cloud. Since the move to the 8.x code based, this product was EOL’d.
The main functions where customers saw value, to provide costings for your datacenter and virtual machines, was wrapped up into vRealize Operations.
This blog post is going to deep dive into the costing capabilities within vRealize Operations across your on-premises datacenters, and what happens when you start to consume VMware on Hyperscaler solutions, such as VMware Cloud on AWS (VMC).
Configure the Global Currency Setting
The first action is setting the global currency for the vRealize Operations instance. There are two important things to note when undertaking this configuration:
- This can only be set once
- This setting cannot be changed once it is set
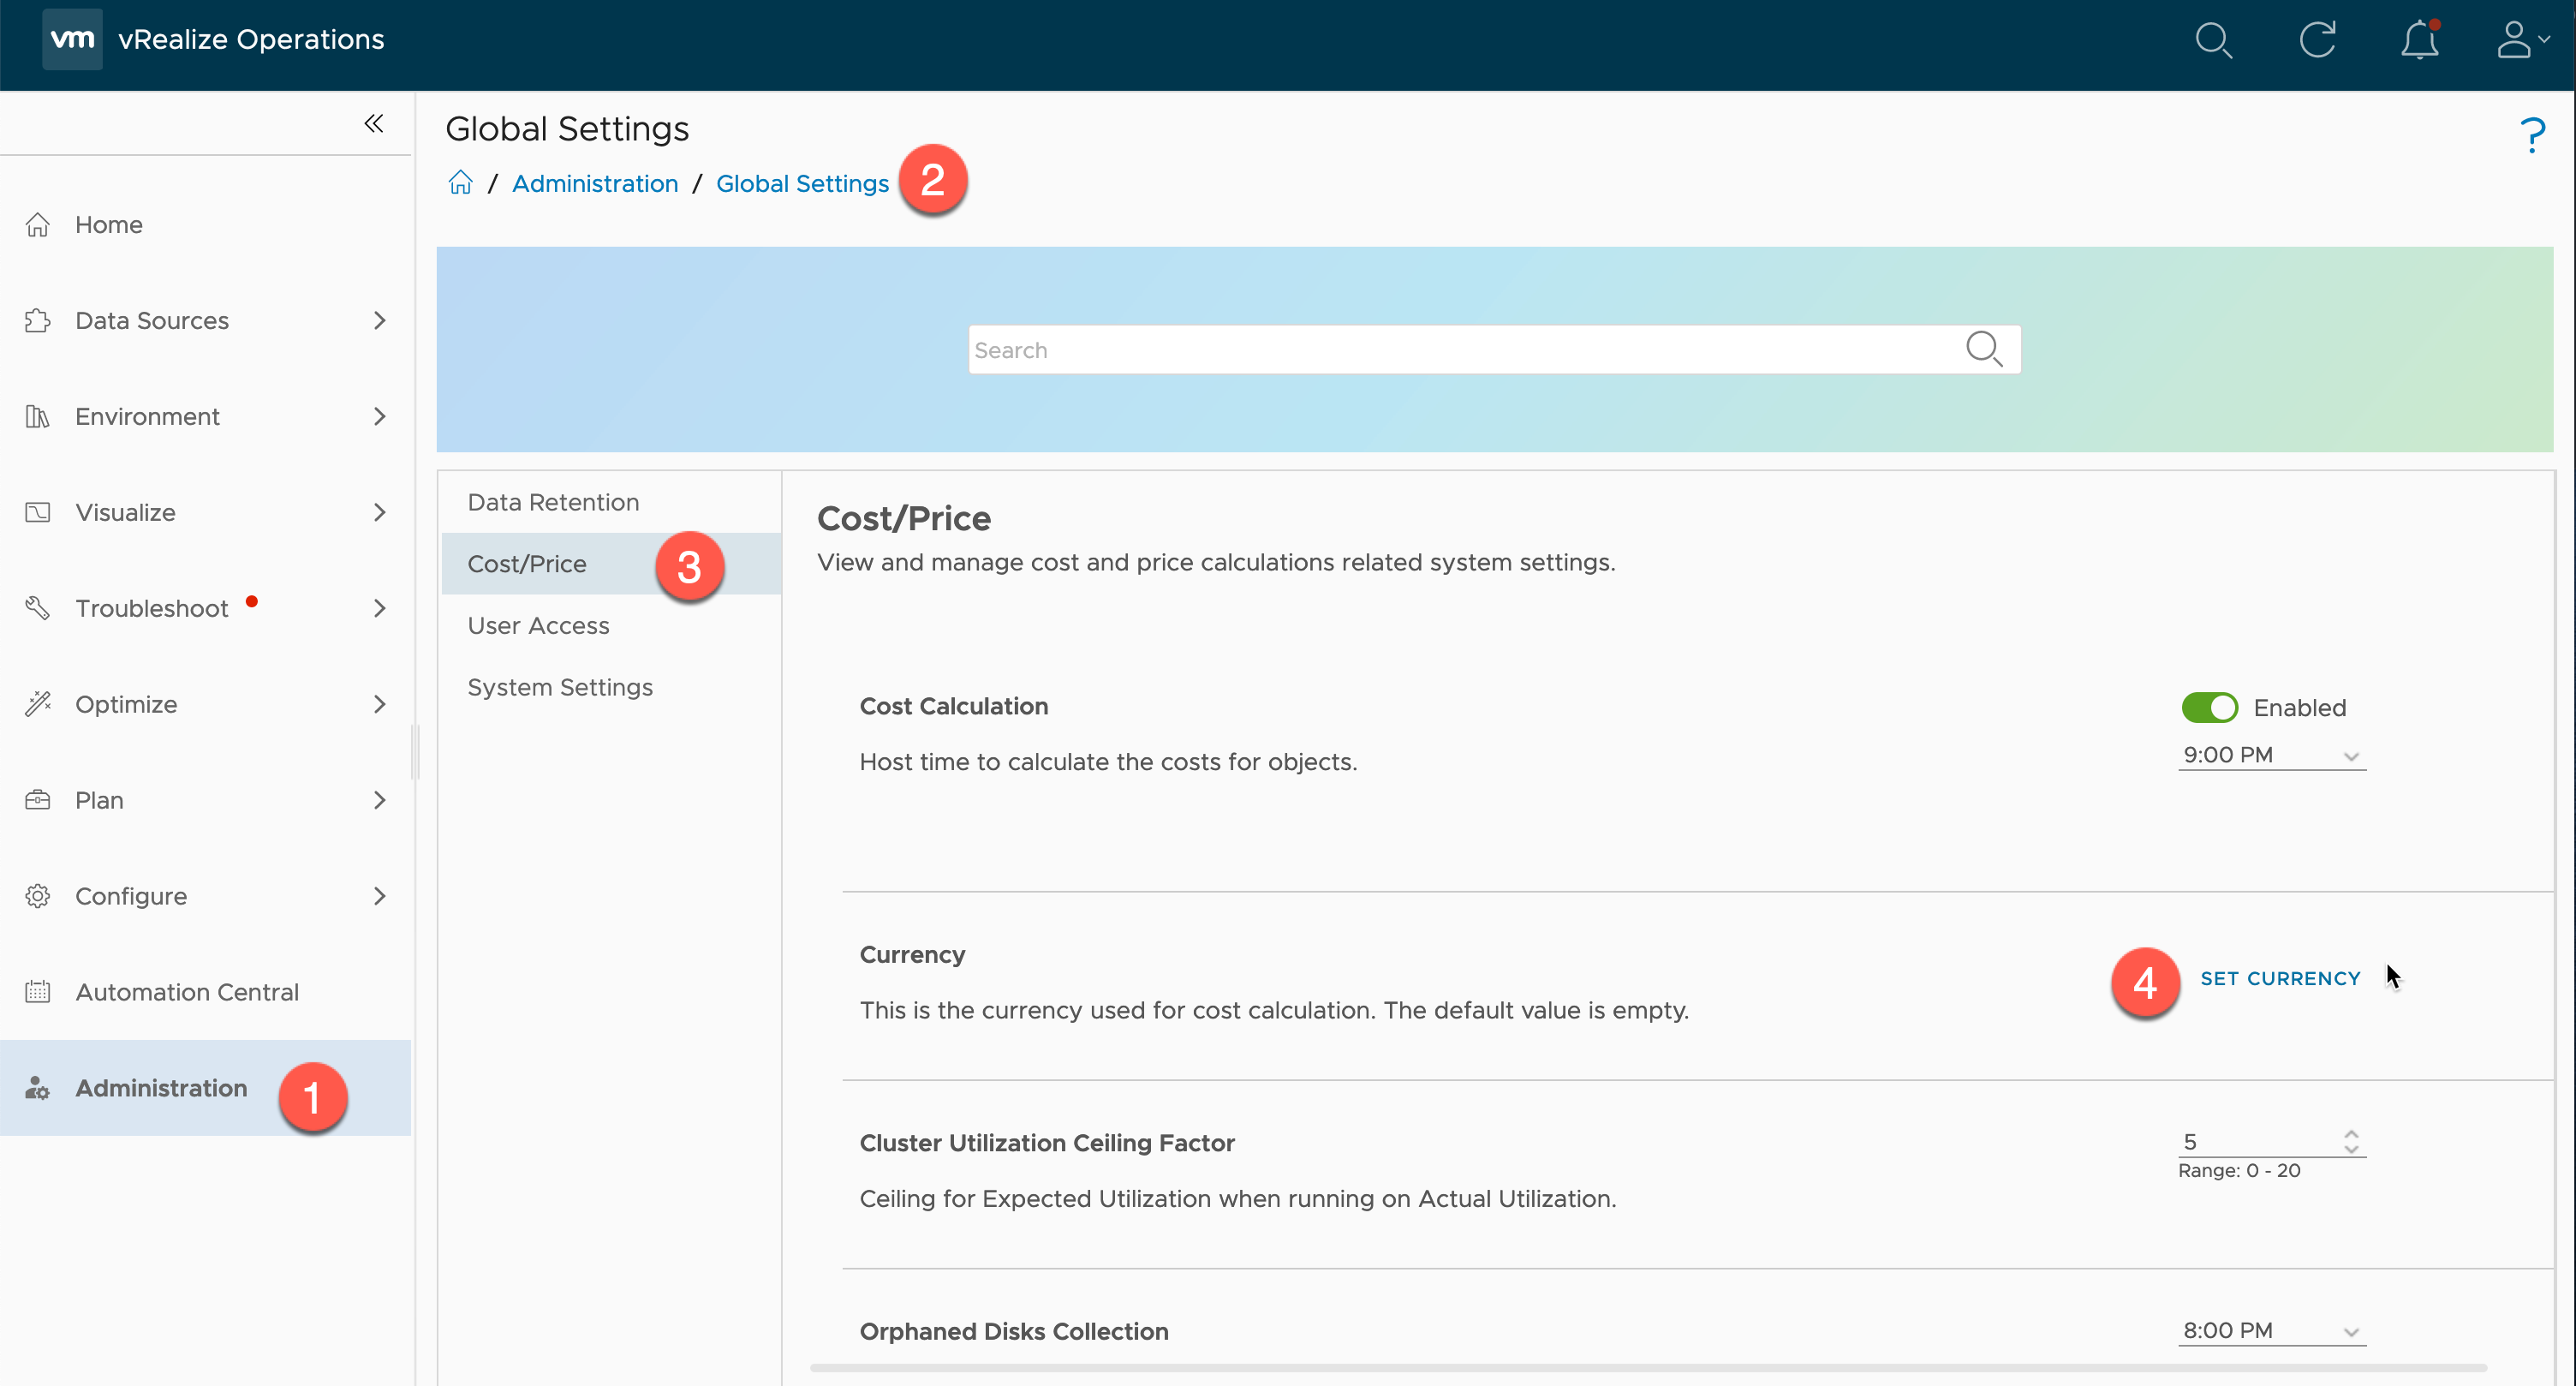
To configure:
- Click on Administration
- Click on the Global Settings Tile
- Click on the Cost/Price heading
- Click to “Set currency”
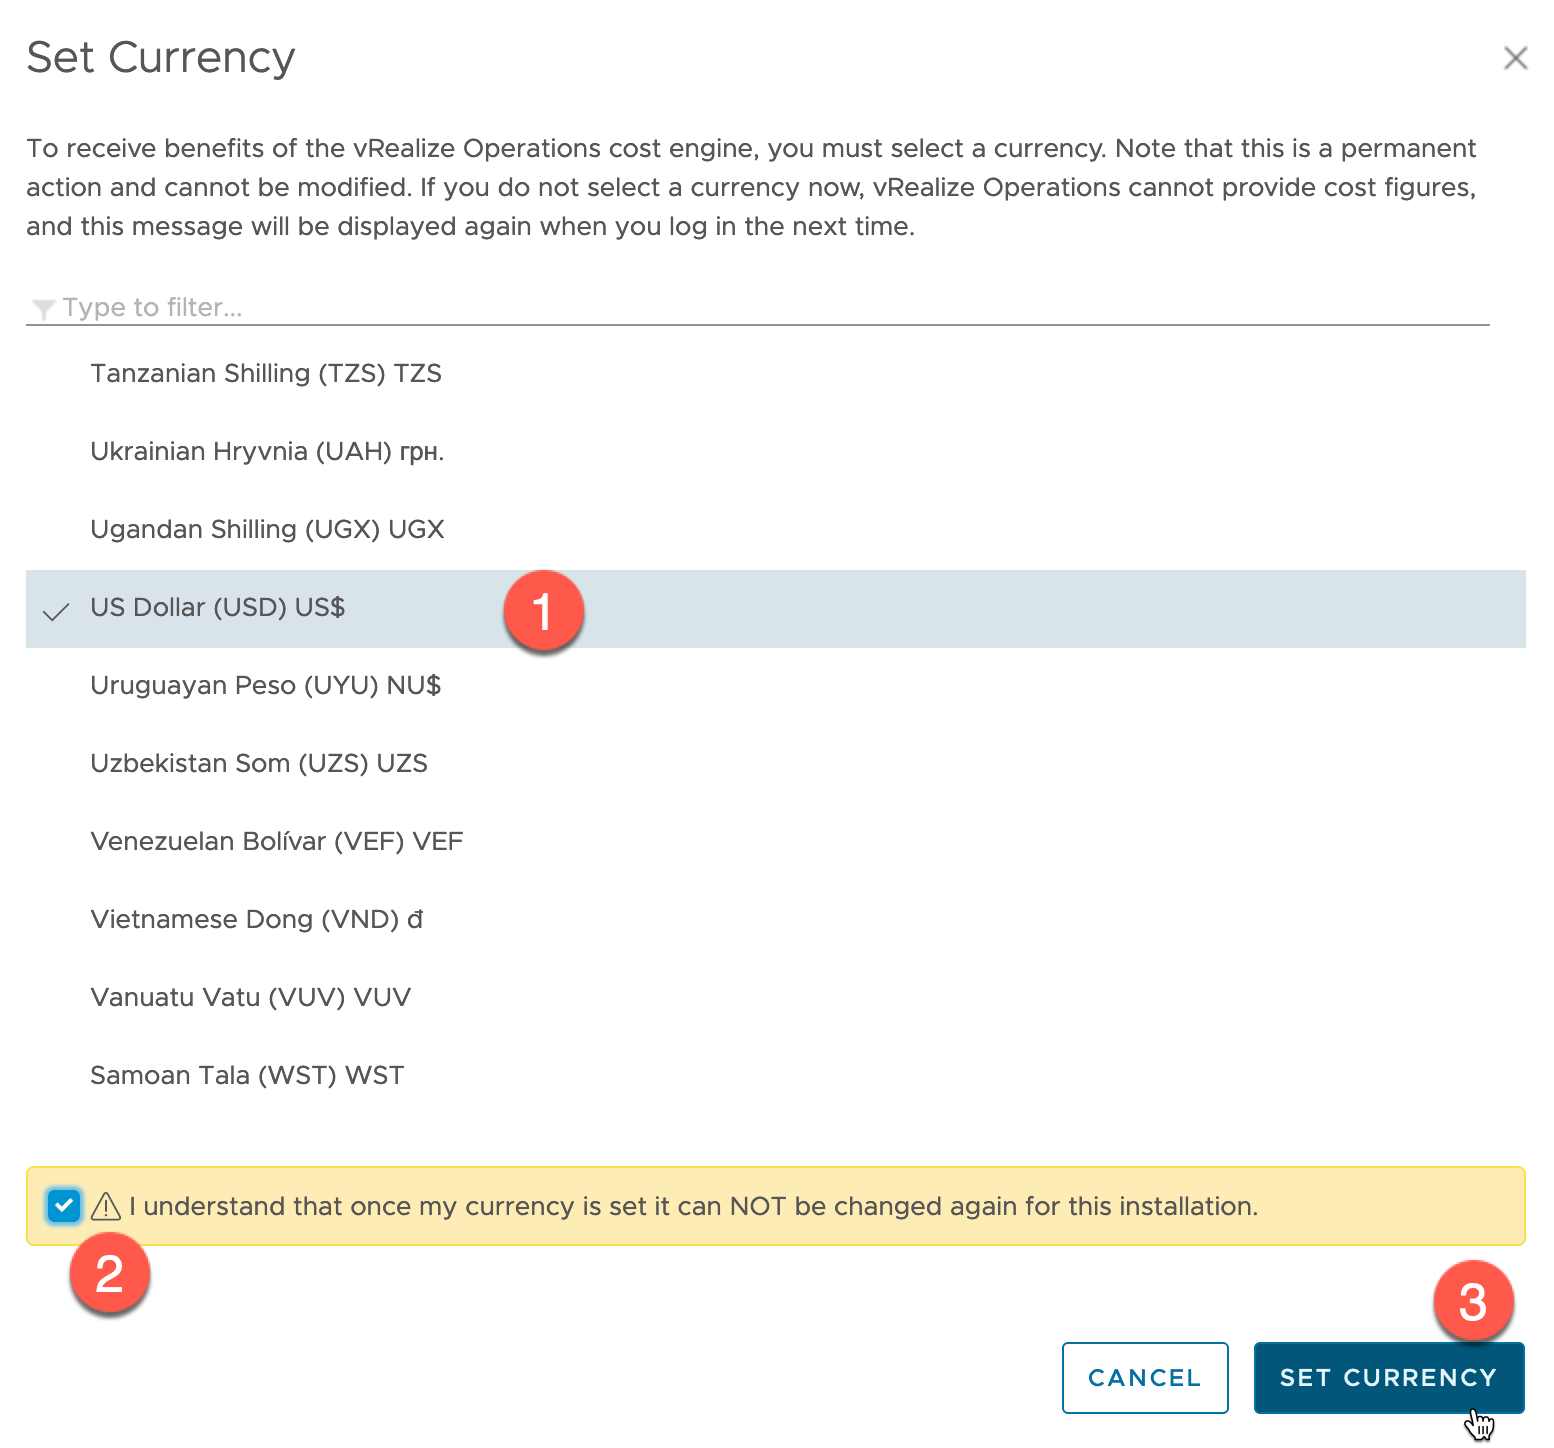
Select your currency from the list and click “Set Currency”.
You will get a dialog to say the configuration has taken place.
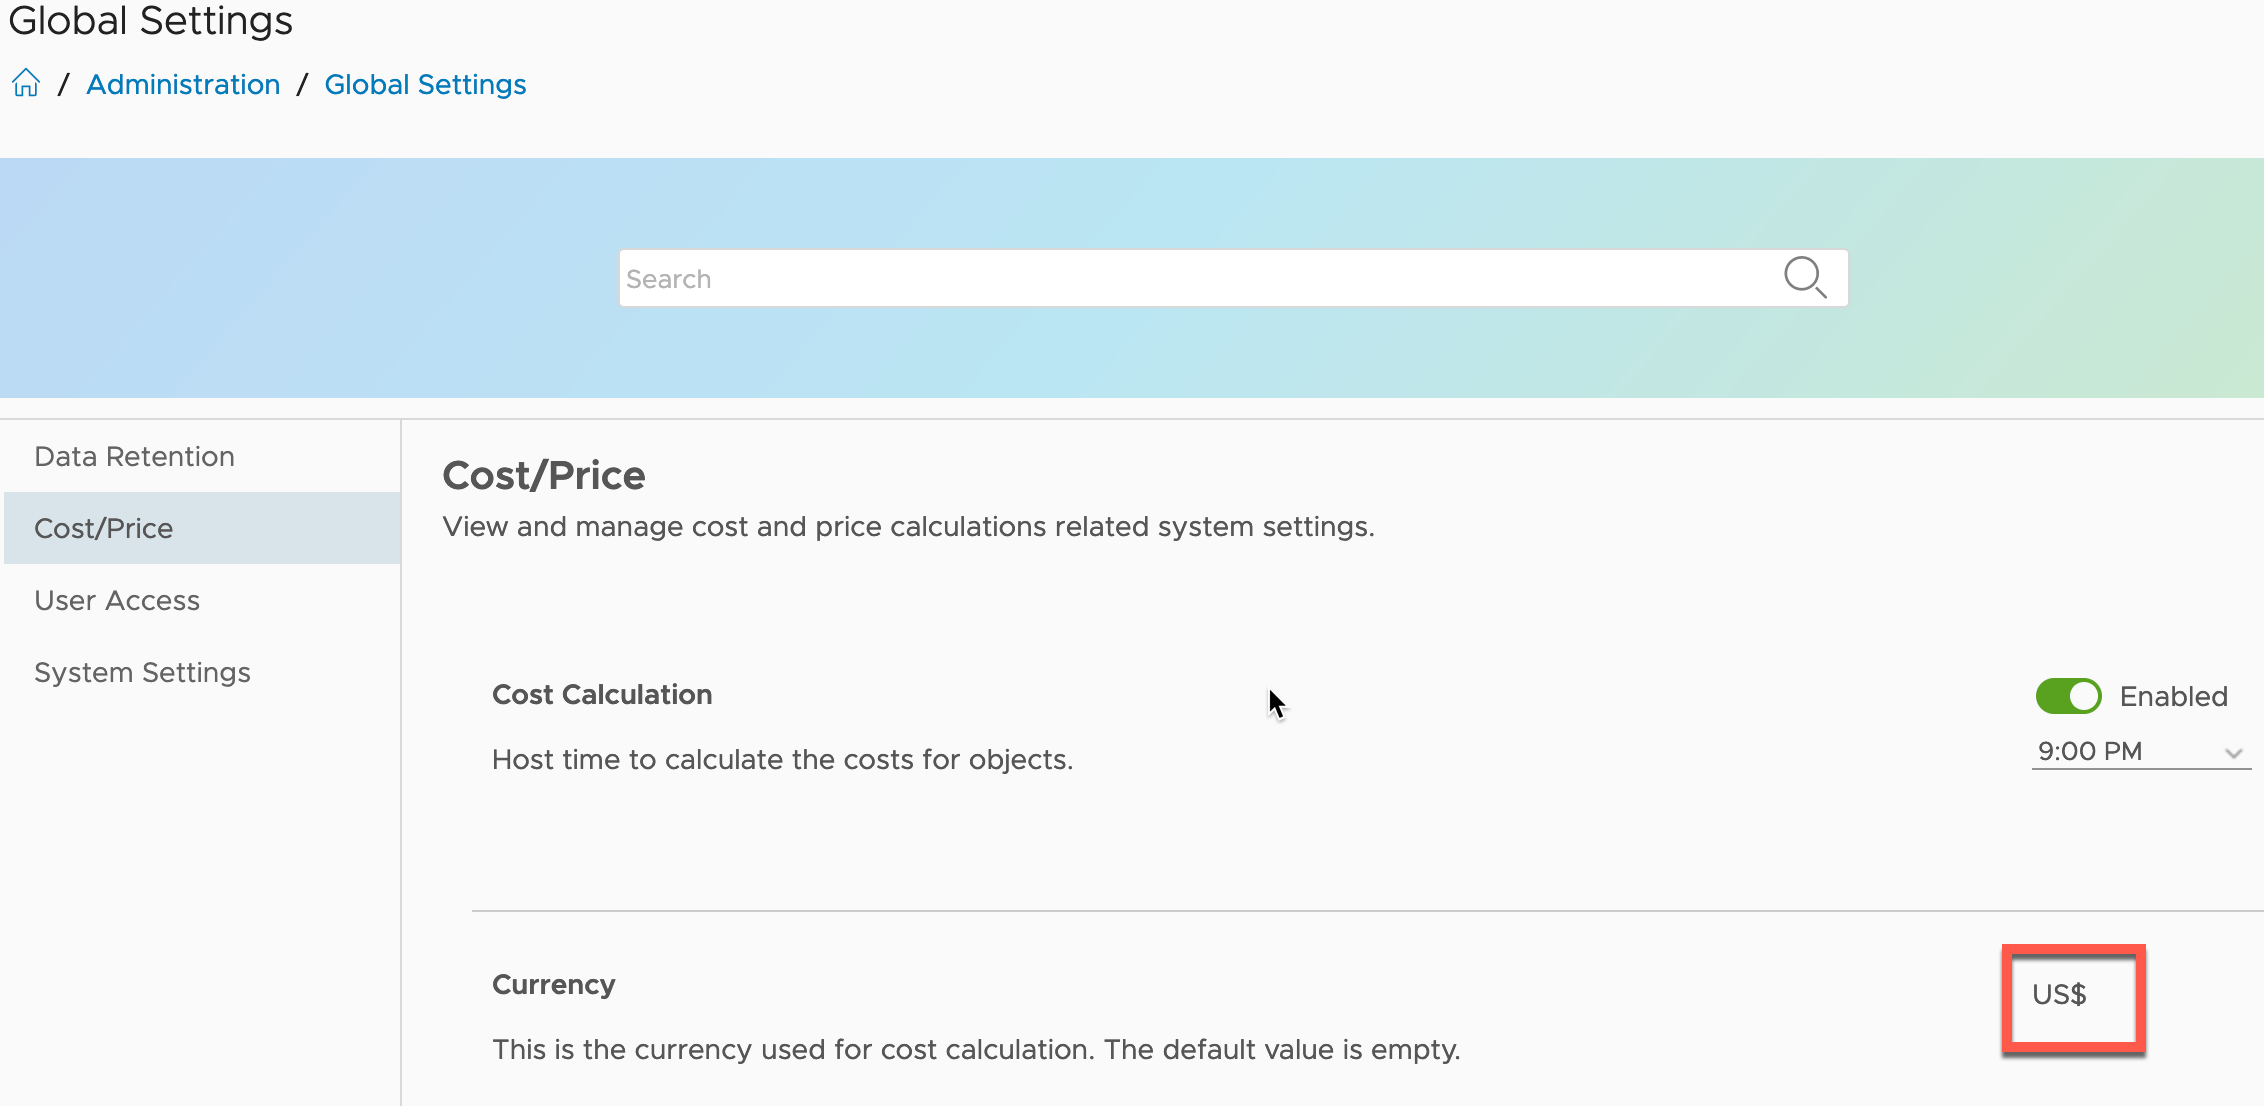
Now below you can see that this setting is in place and there is no button/clickable option to change it.
Configuring Cost Settings
Now that the global currency is configured, we can start configuring all the cost settings for our Datacenter platforms.
Financial Account Model
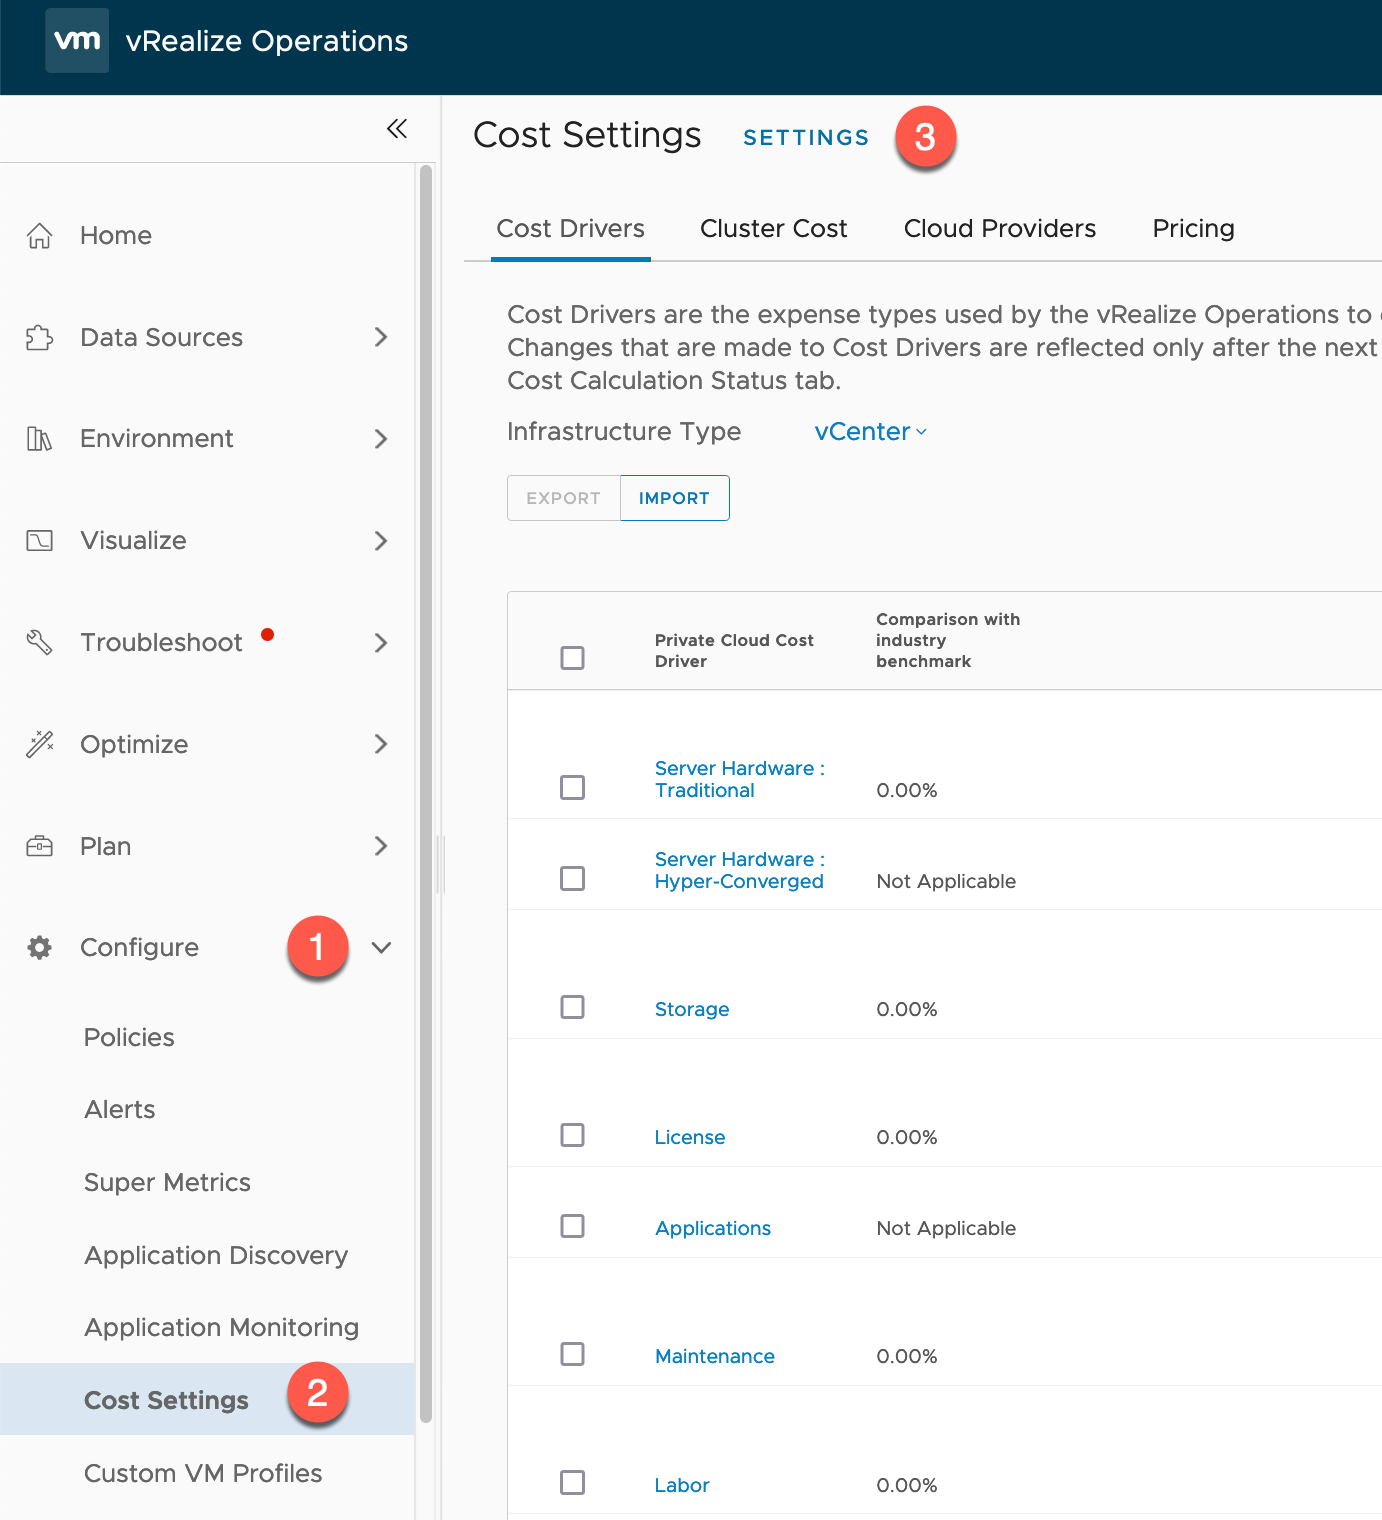
To open the cost settings:
- Open the Configure heading
- Select Cost Settings
For this part, we’ll click the settings link to take us to the next dialog box.
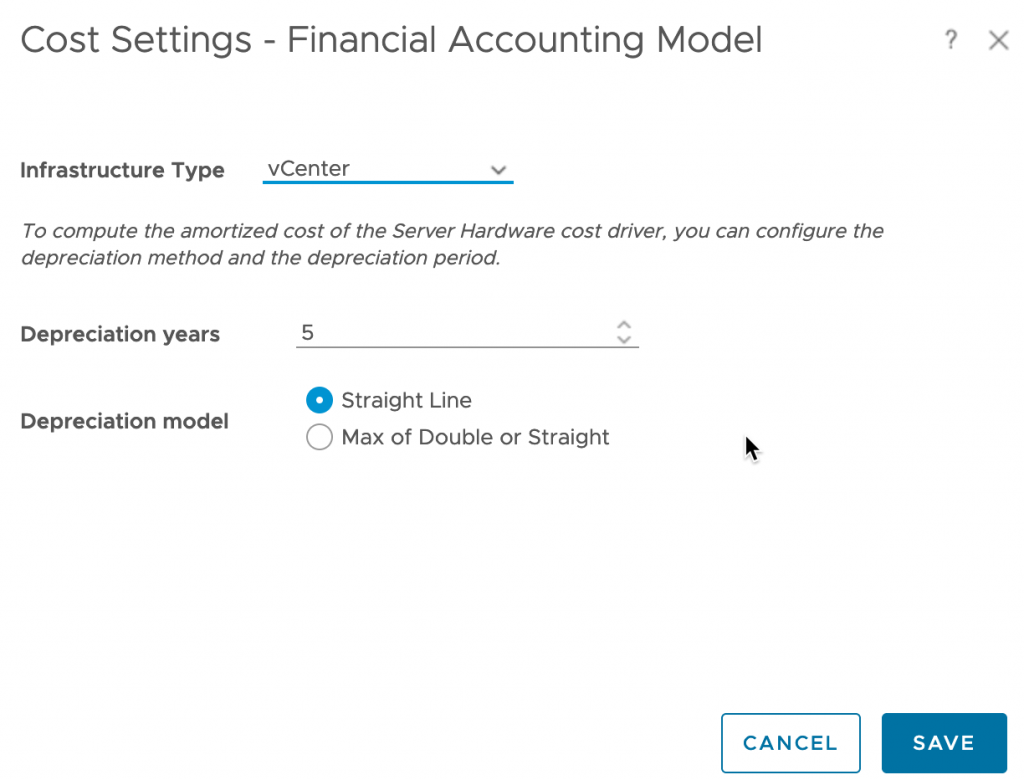
One this settings dialog you can configure the Financial Account Model settings for the different infrastructures (vCenter, VMC, AVS, GVCE).
To calculate and consider the amortized (writing off the value as the asset ages) cost of the Server Hardware cost driver, you can configure the depreciation method and the depreciation period. Cost Drivers supports two yearly depreciation methods (straight line or Max of double) and you can set the depreciation period from two to five years.
You can read more details on formulas used for these calculations and examples here:
- Official Documentation – Configuring Depreciation Preferences
Cost Drivers
Next, we will start to configure the main cost components that is used to determine the costs of our environment.
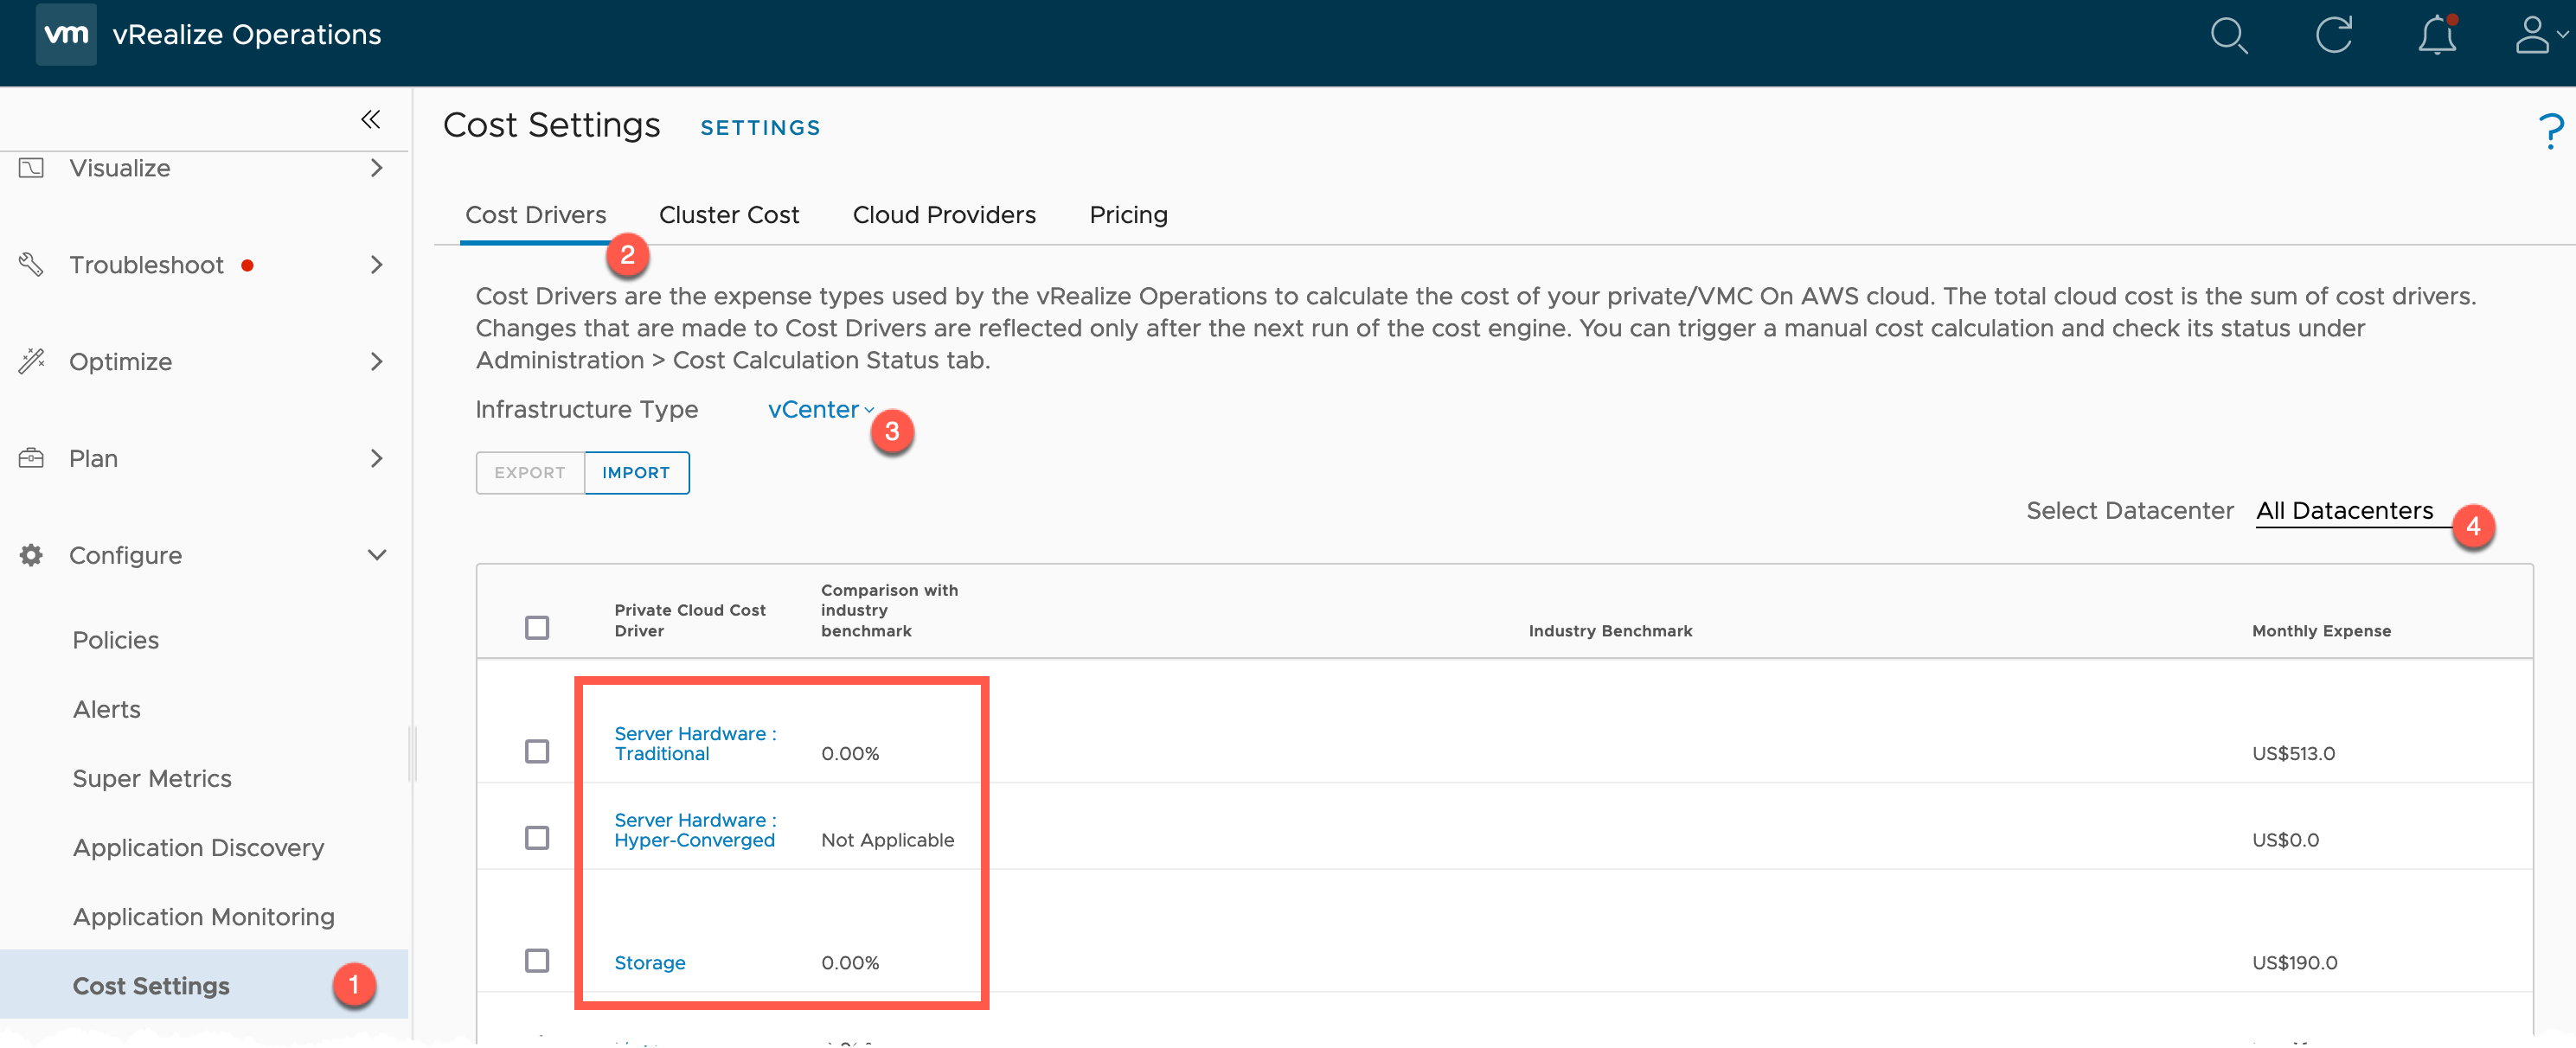
- Under the Cost settings page, select the Cost Drivers tab
- Select the Infrastructure Type
- Select if to configure for all datacenters or individual (you’ll get this option on each sub-configuration page).
Select each of the necessary headings to configure your costs. When you first configure vROPs, it will use an industry standard reference cost for the available drivers, you can find more information on this page.
It is recommended you configure these drivers with your actual costs.
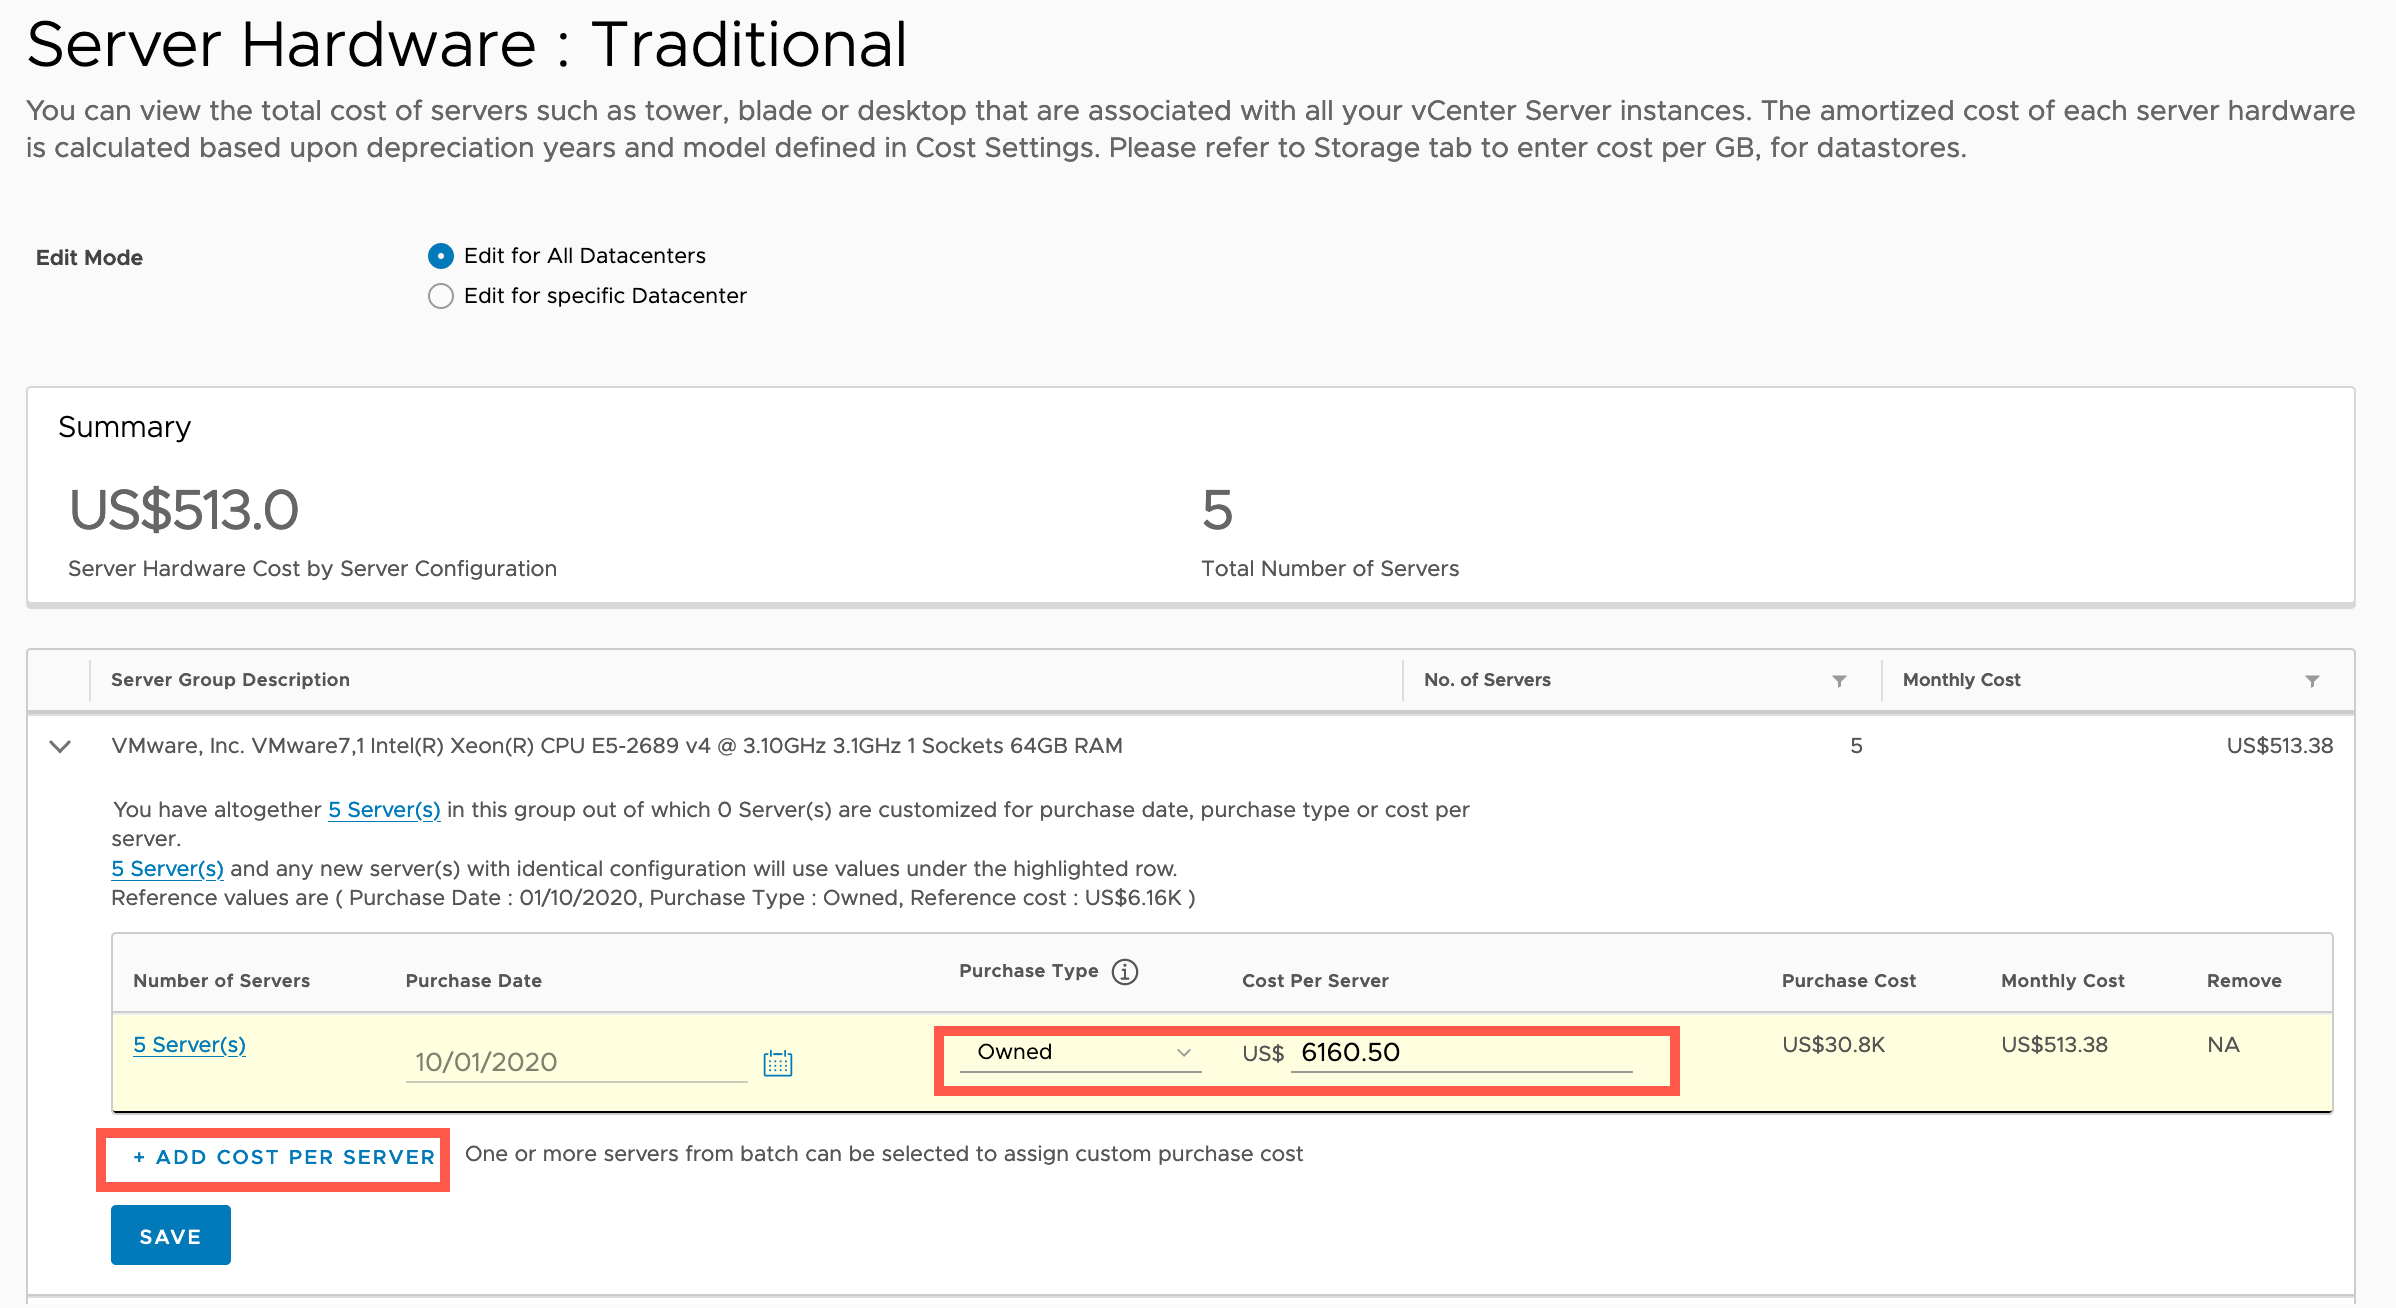
Configuring the cost drivers is simple. Below I’ve opened the first driver, “Server Hardware: Traditional”.
- Select which environments you are editing the costs for (All DCs or specific DC)
- Select the server type you need to configure
- Set the purchase type
- Set the purchase cost
- You can select the existing Servers link and edit individual servers as needed
- For example, if the cost was different due to purchase dates/times/discounts
- Clicking the “Add cost per server” option achieves the same configuration.
- Storage: this is done by using tag categories to identify storage. If storage is not tagged, it will be costed against the uncategorized value.
- License: You can view the license cost of each VM that is computed based on one of the following license types:
- Per-socket license cost
- Enterprise License Agreement (ELA) cost
- Desktop licensing cost
- Per-core license cost
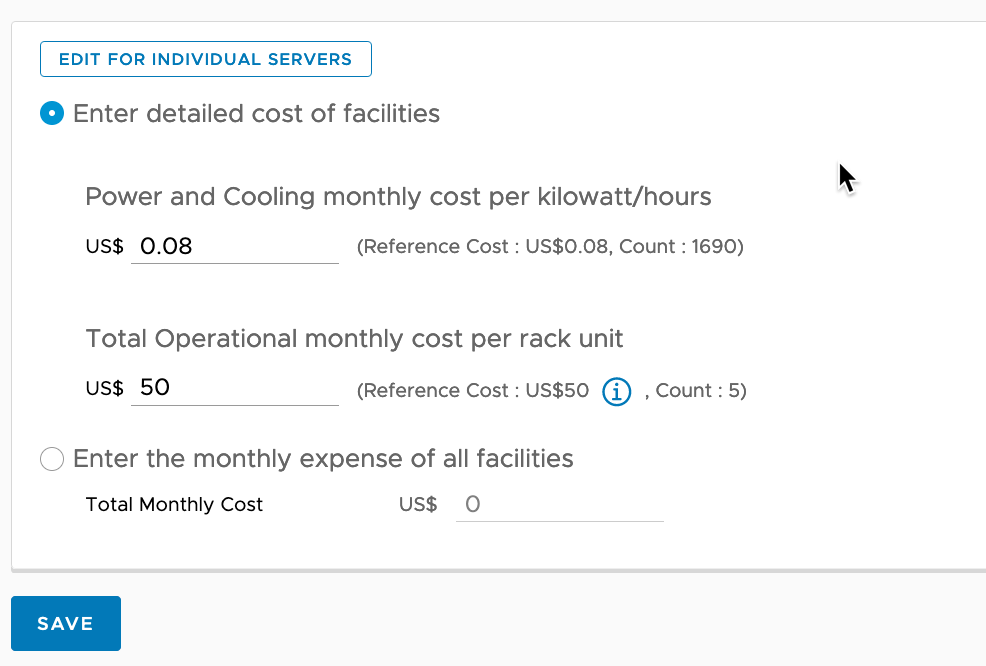
The last area I want to call out is Facilities, which is power and cooling of your environments.
You can configure these settings, such as Power/Cooling month cost per kilowatt/hours, per datacenter and per host within datacenters. Giving you a lot of granularity between environments and their costs. (Helpful, as the current global situation around electricity costs means some DCs in certain geographies will have higher costs than others.)
Cluster Cost
This page details your individual monitored clusters, their total calculated costs, and then per GHz and GB cost of the platform.
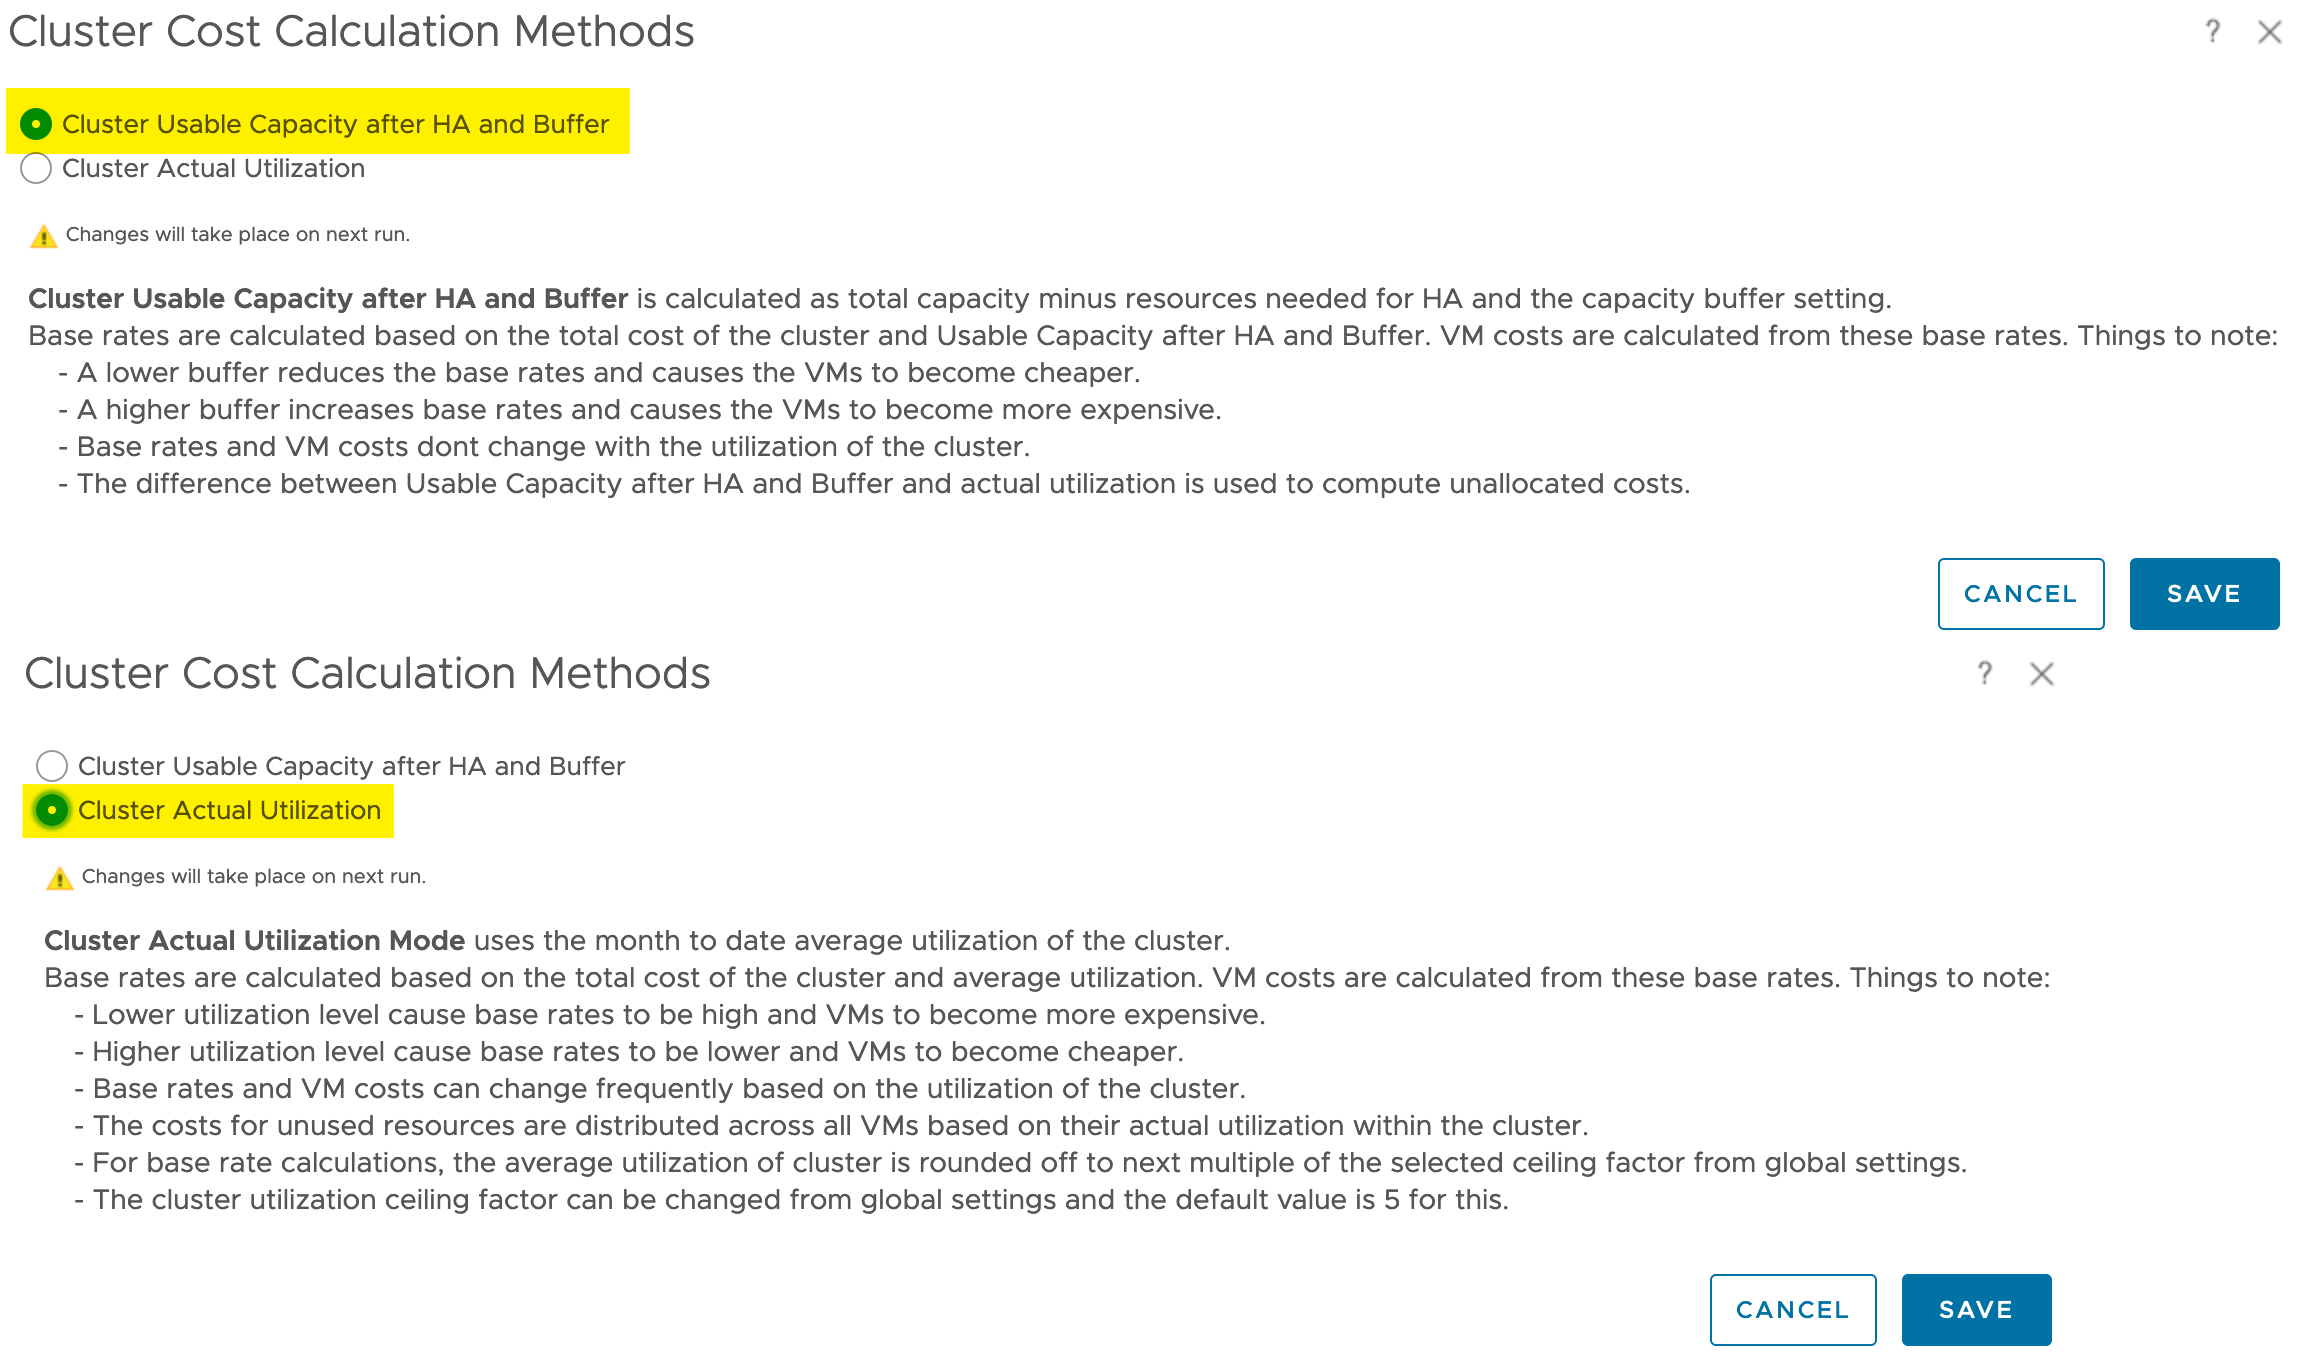
You have the ability here to change how the cluster base rate calculation is configured. This is a single configuration for all clusters monitored.
Below is a detailed explanation of both configuration options. Most customers I speak to will use the default setting “Cluster usable Capacity after HA and Buffer”. This is better in most cases, as one of the underlying reasons for virtualisation is HA in event of failures and burst capacity for VMs (over physical installations).
Pricing
Now we are going to create a pricing card, so that we can generate a charge back cost for our deployed virtual machines. For this blog post, I’m going to create two pricing cards, a default call-all configuration for cost. And a specific pricing card for my Ubuntu workloads.
- Click on the “Pricing” Tab within Cost Settings
- Select “New Pricing Card” button
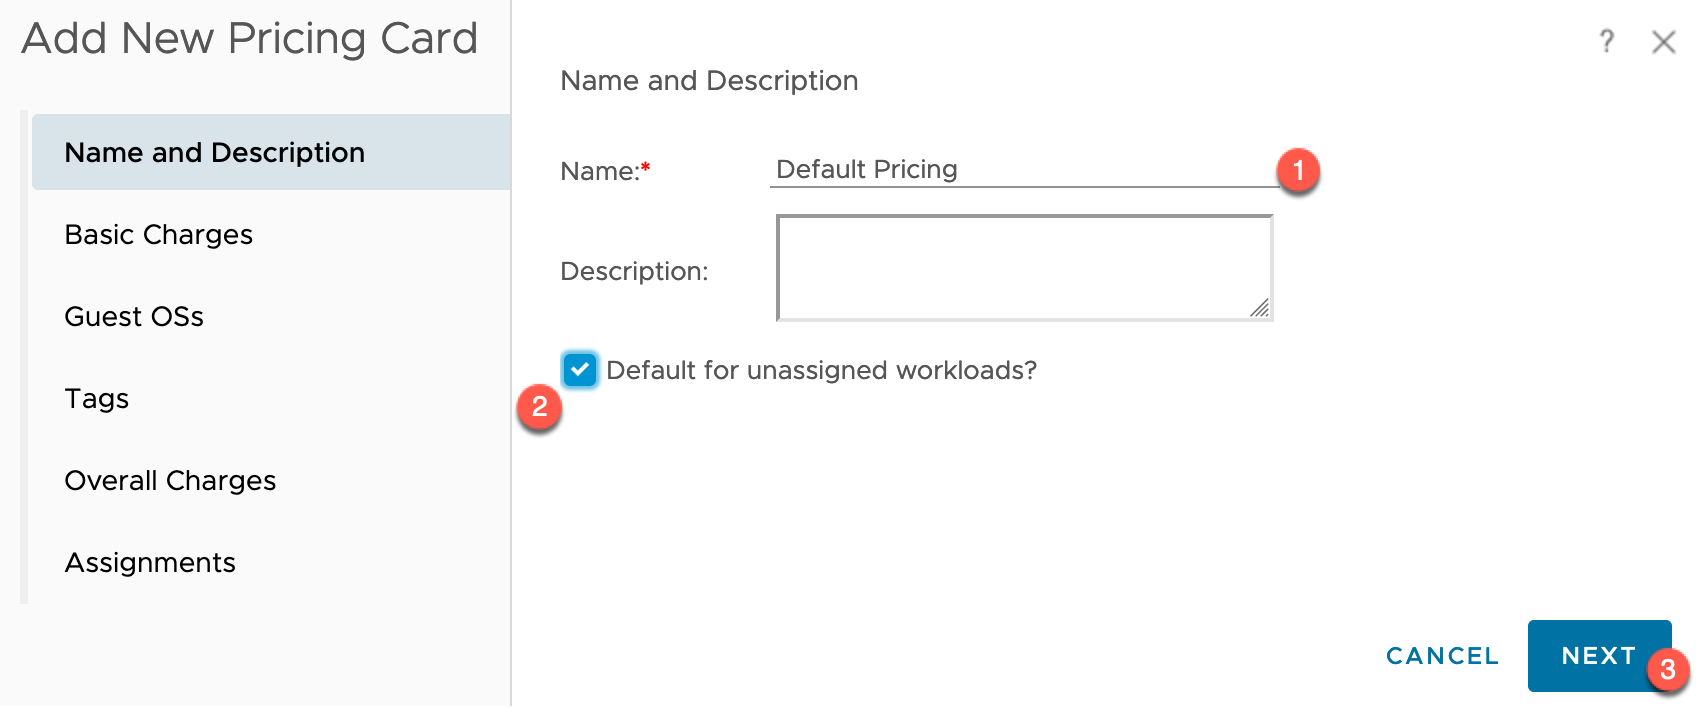
- Provide a Name for the pricing card.
- Select if this pricing card should apply to all workloads, where another pricing card is not attributed to them.
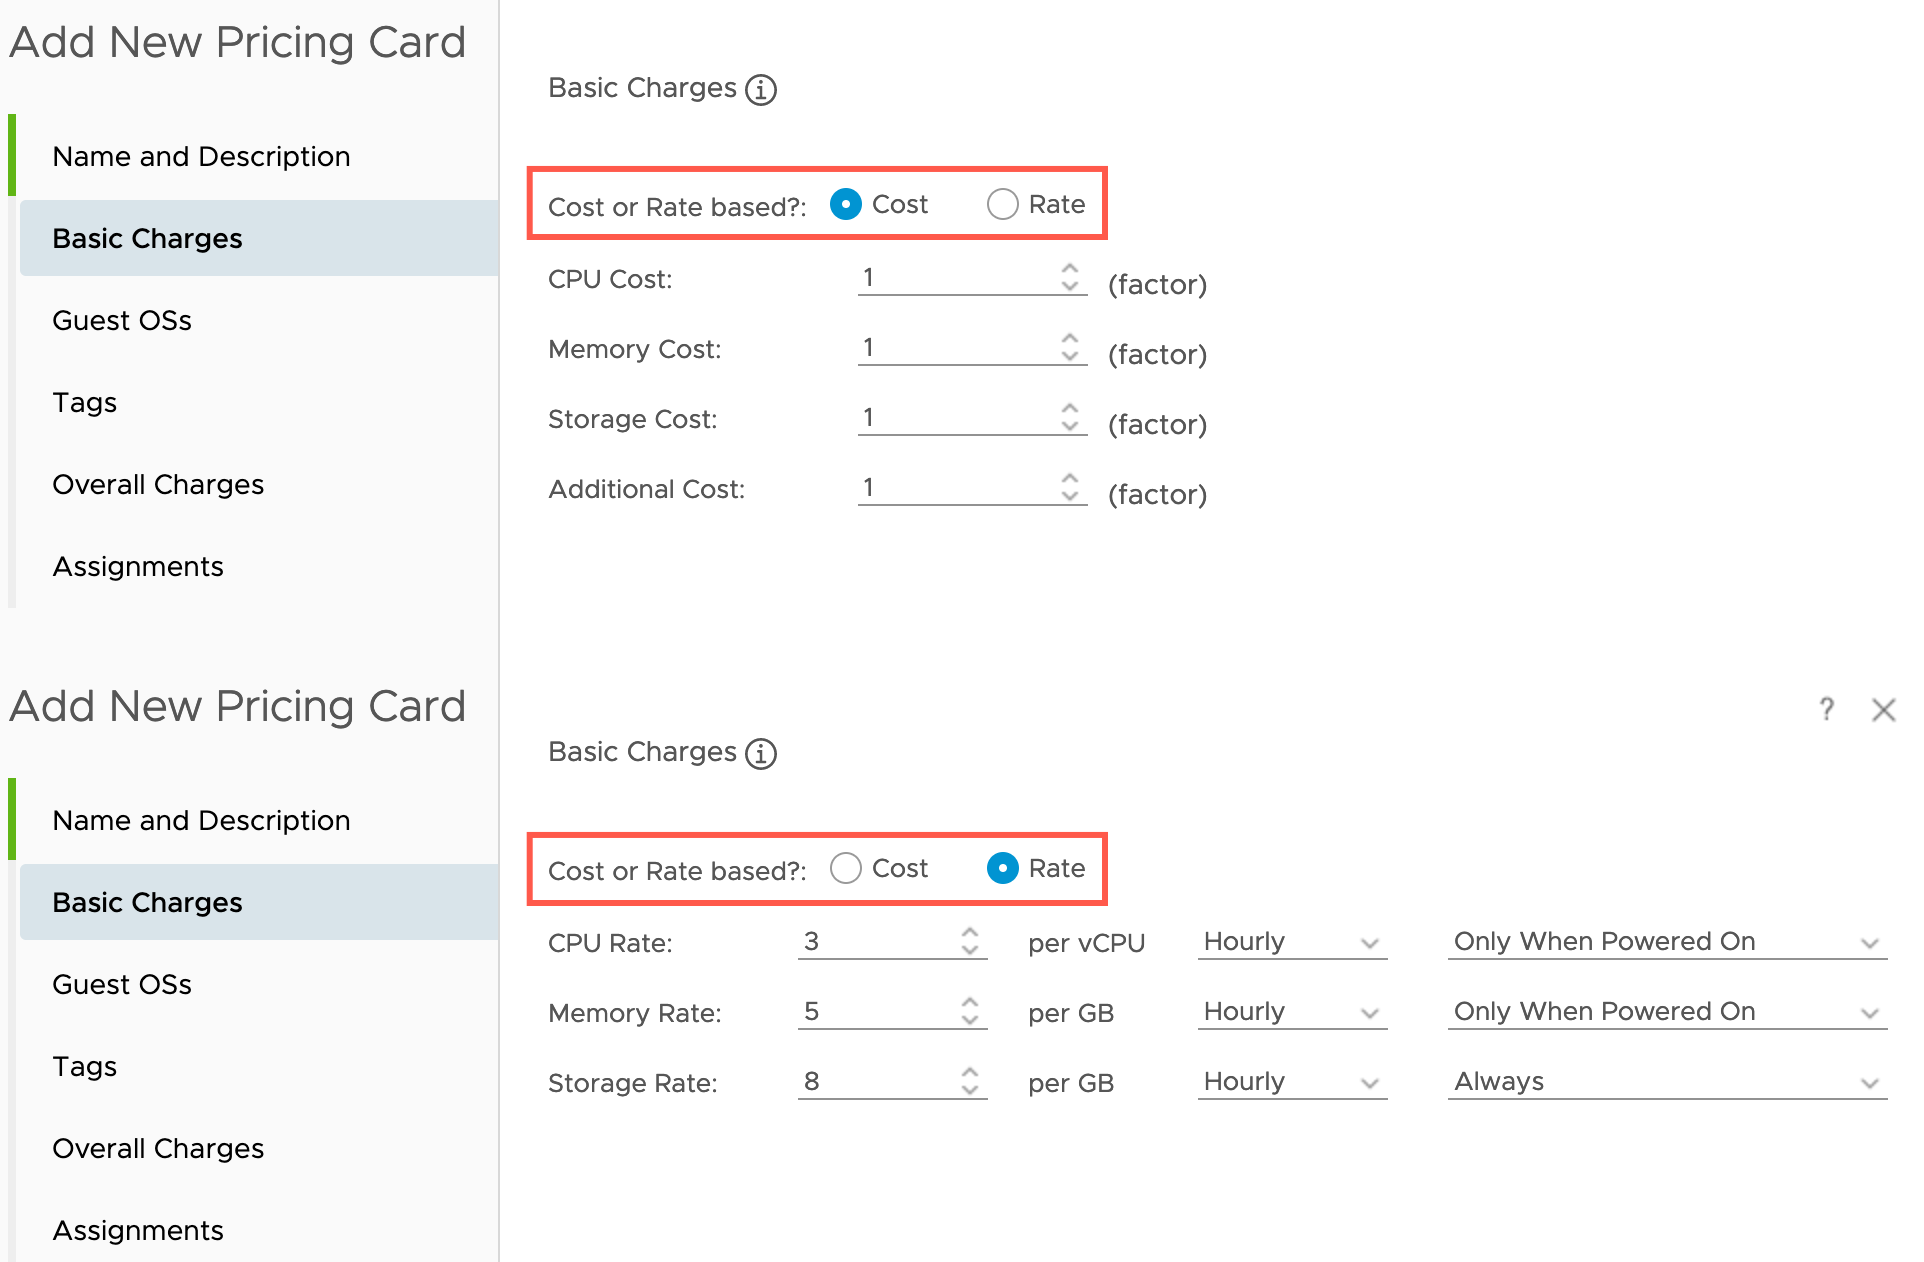
For the Basic charges, you have two options:
- Cost – set a multiplier of the cost factor from the cluster cost. i.e if the average cost of 1GHz CPU is $4, and your VM consumes 2 GHz, and the factor is 1.2, then the CPU cost of the VM is $9.60.
- Rate – set a cost figure for each attribute of the VM, time setting and when this charge applies
- This is the most used configuration.
Once you have decided your basic charge configuration, set the charges for the VM across CPU, Memory, Storage and additional costs (single arbitrary figure).
If you are choosing Rate, then set if the charges are hourly, daily or monthly and when the charge applies (when powered on, or always).
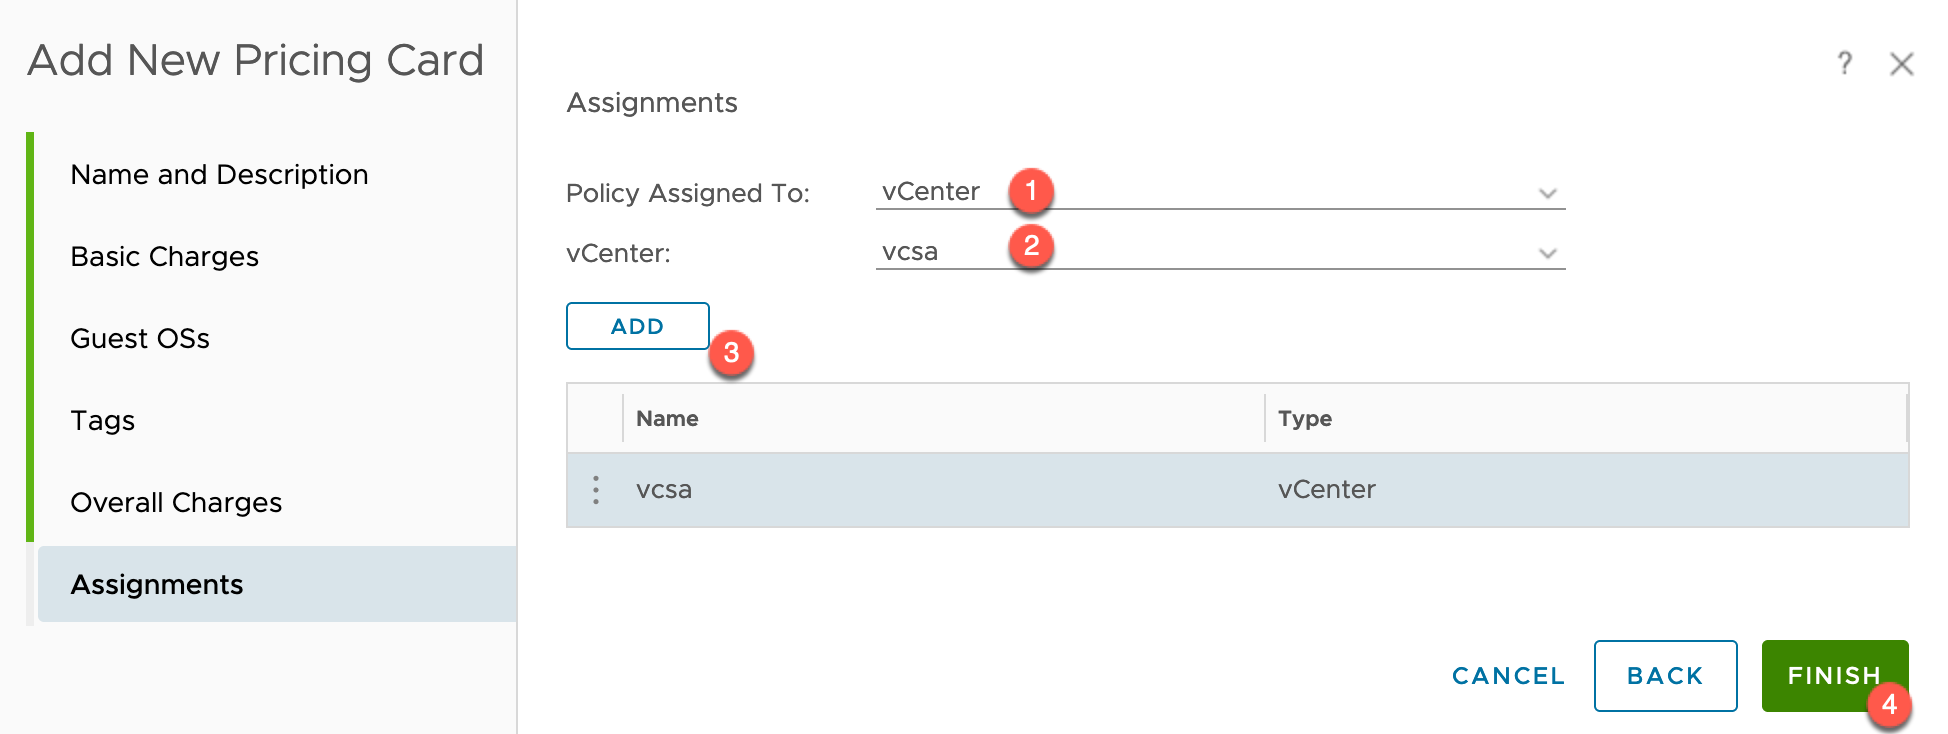
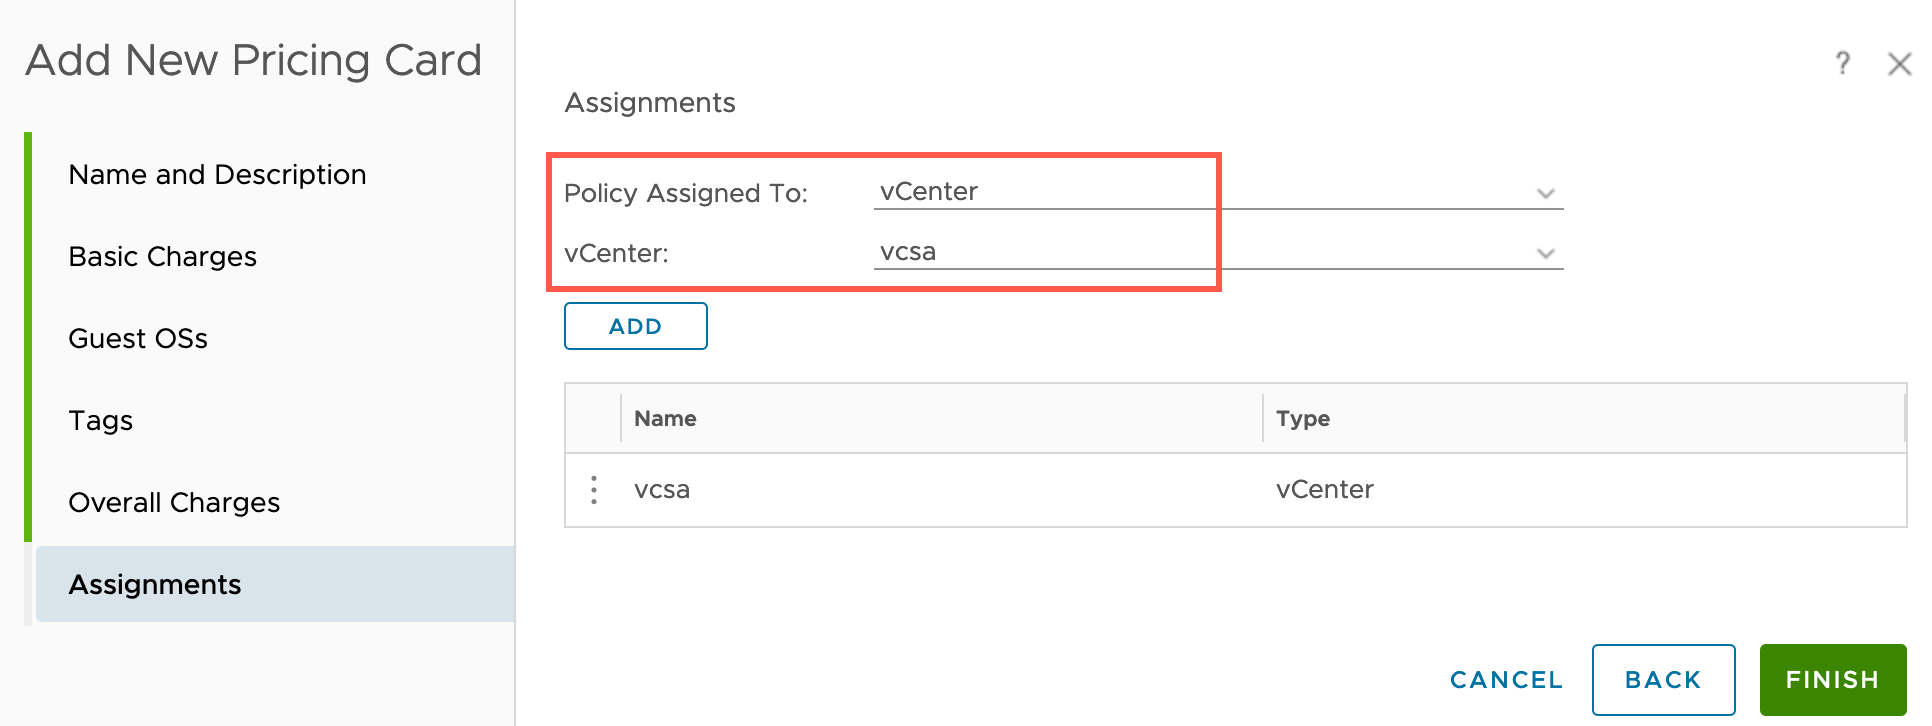
For this default card, I’ve skipped to the end, finishing with which vCenter/Cluster I want to assign this pricing card. This means we can have different default pricing cards per vSphere environment.
In this second example, I am creating a specific pricing card for a specific Guest OS, Ubuntu.
Against provide the name, but this time I’ve left the default option unticked.
I’ve configured the basic charges, using a mix of the options.
Under Guest OSs, we need to provide the name as identified by VMware Tools and show in vCenter. You can also see I’ve set a base rate that all Ubuntu images cost $10.
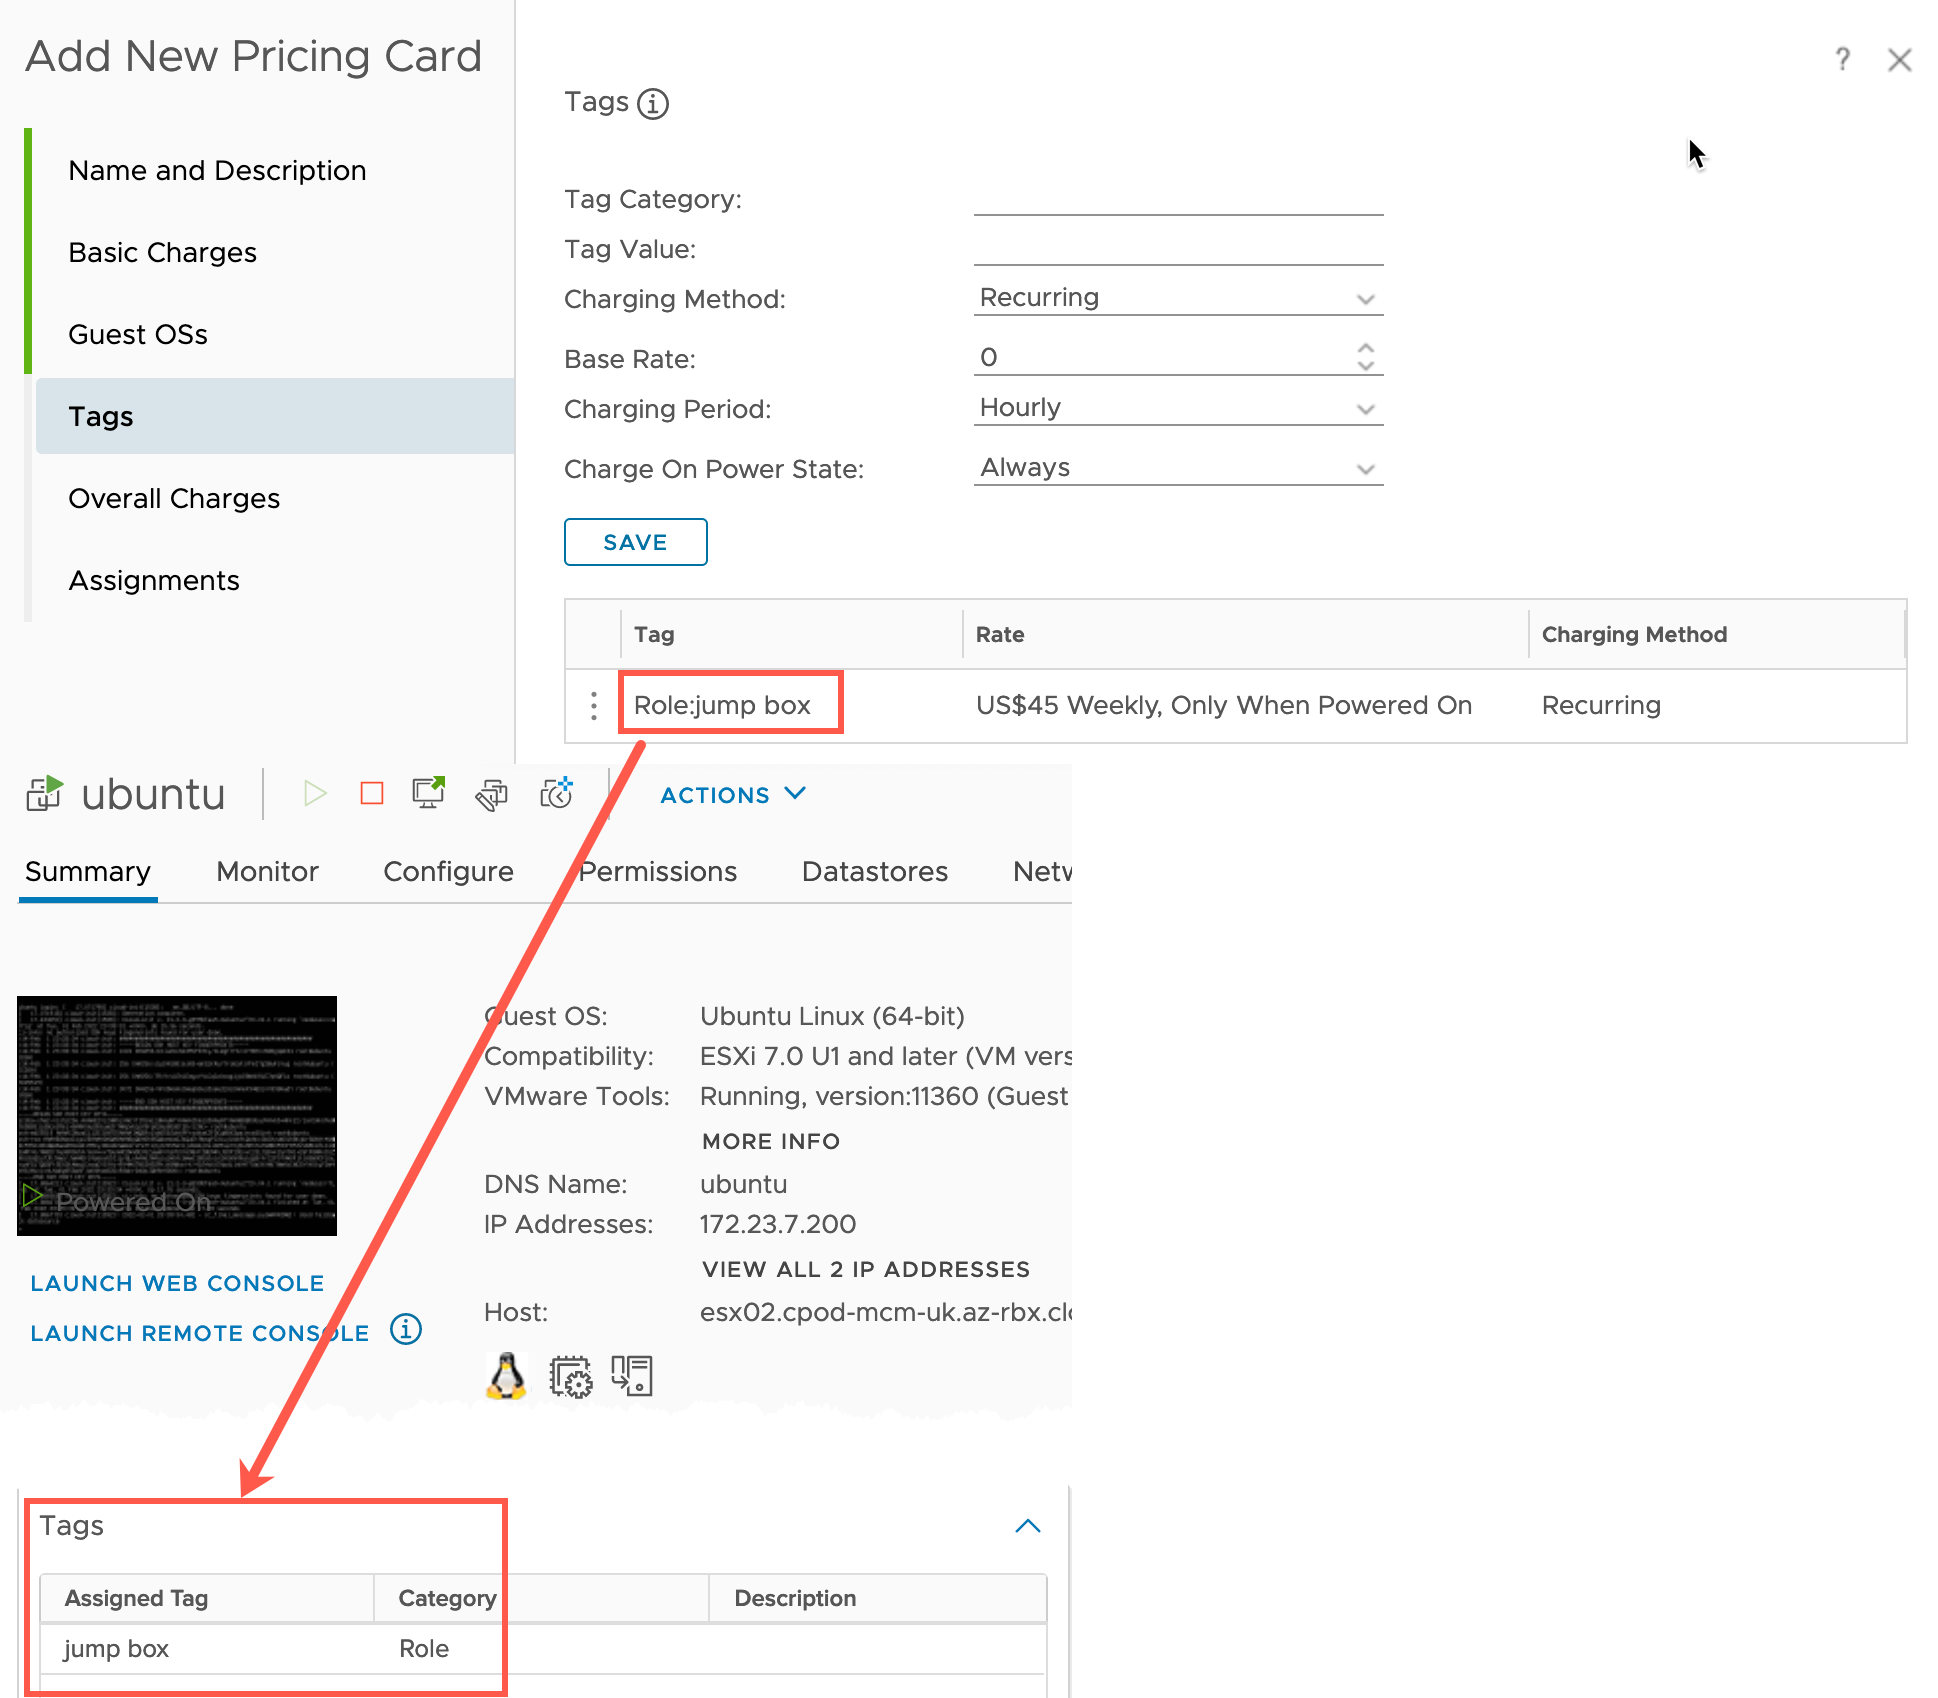
Next, I wanted to add a little more detail in the charging as well. So by using the vSphere Tags, for any Ubuntu VM which has the tags “Role:jump box”, there is a base rate charge added of $45 weekly.
Finally, I’ve added some overall charges for the VM, such as the cost for setup, and any final ongoing recurring charges.
Again, I assign this to my vCenter.
In this second example, hopefully you can see the number of configuration options for attributing charges to deployed virtual machines, from setup costs, to costs per role or maybe even identification via tags of software installed.
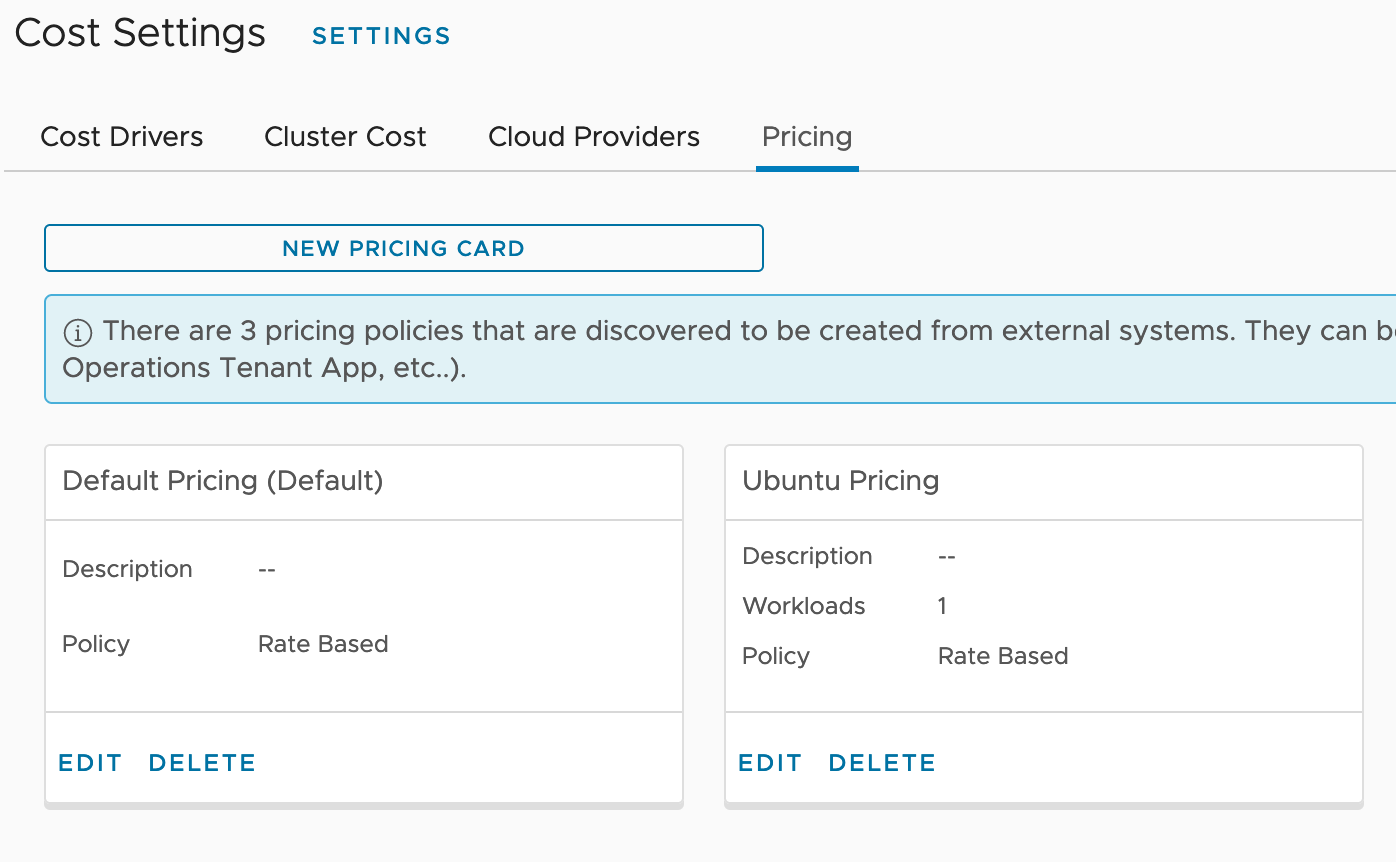
Finally on the Pricing tab, you’ll see your pricing cards, which can be edited as needed.
Now that we’ve created the pricing cards, the initial calucation of the VMs and their costs will be picked up when the cost calculation engine runs every 24 hours. However, if you continue reading below, we can also run this manually.
Manually running the Cost Calculation Engine
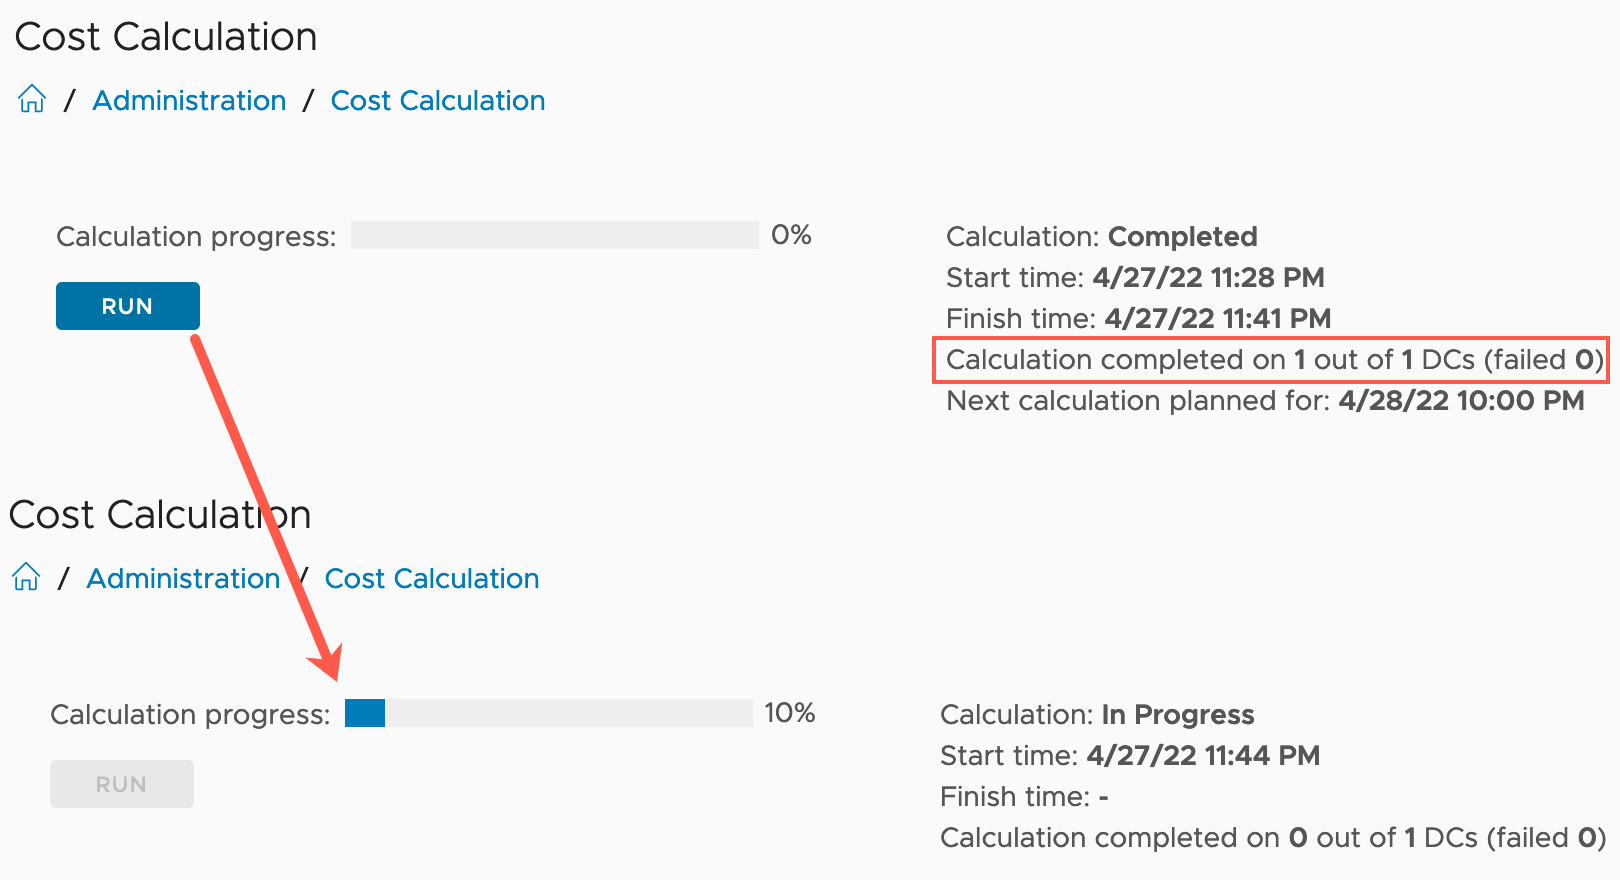
The cost calculation engine can be run manually. However, this can be a resource heavy process, and typically runs in the early hours every 24 hours by its default configuration. So for larger environments, it should be noted to run this with care and consideration.
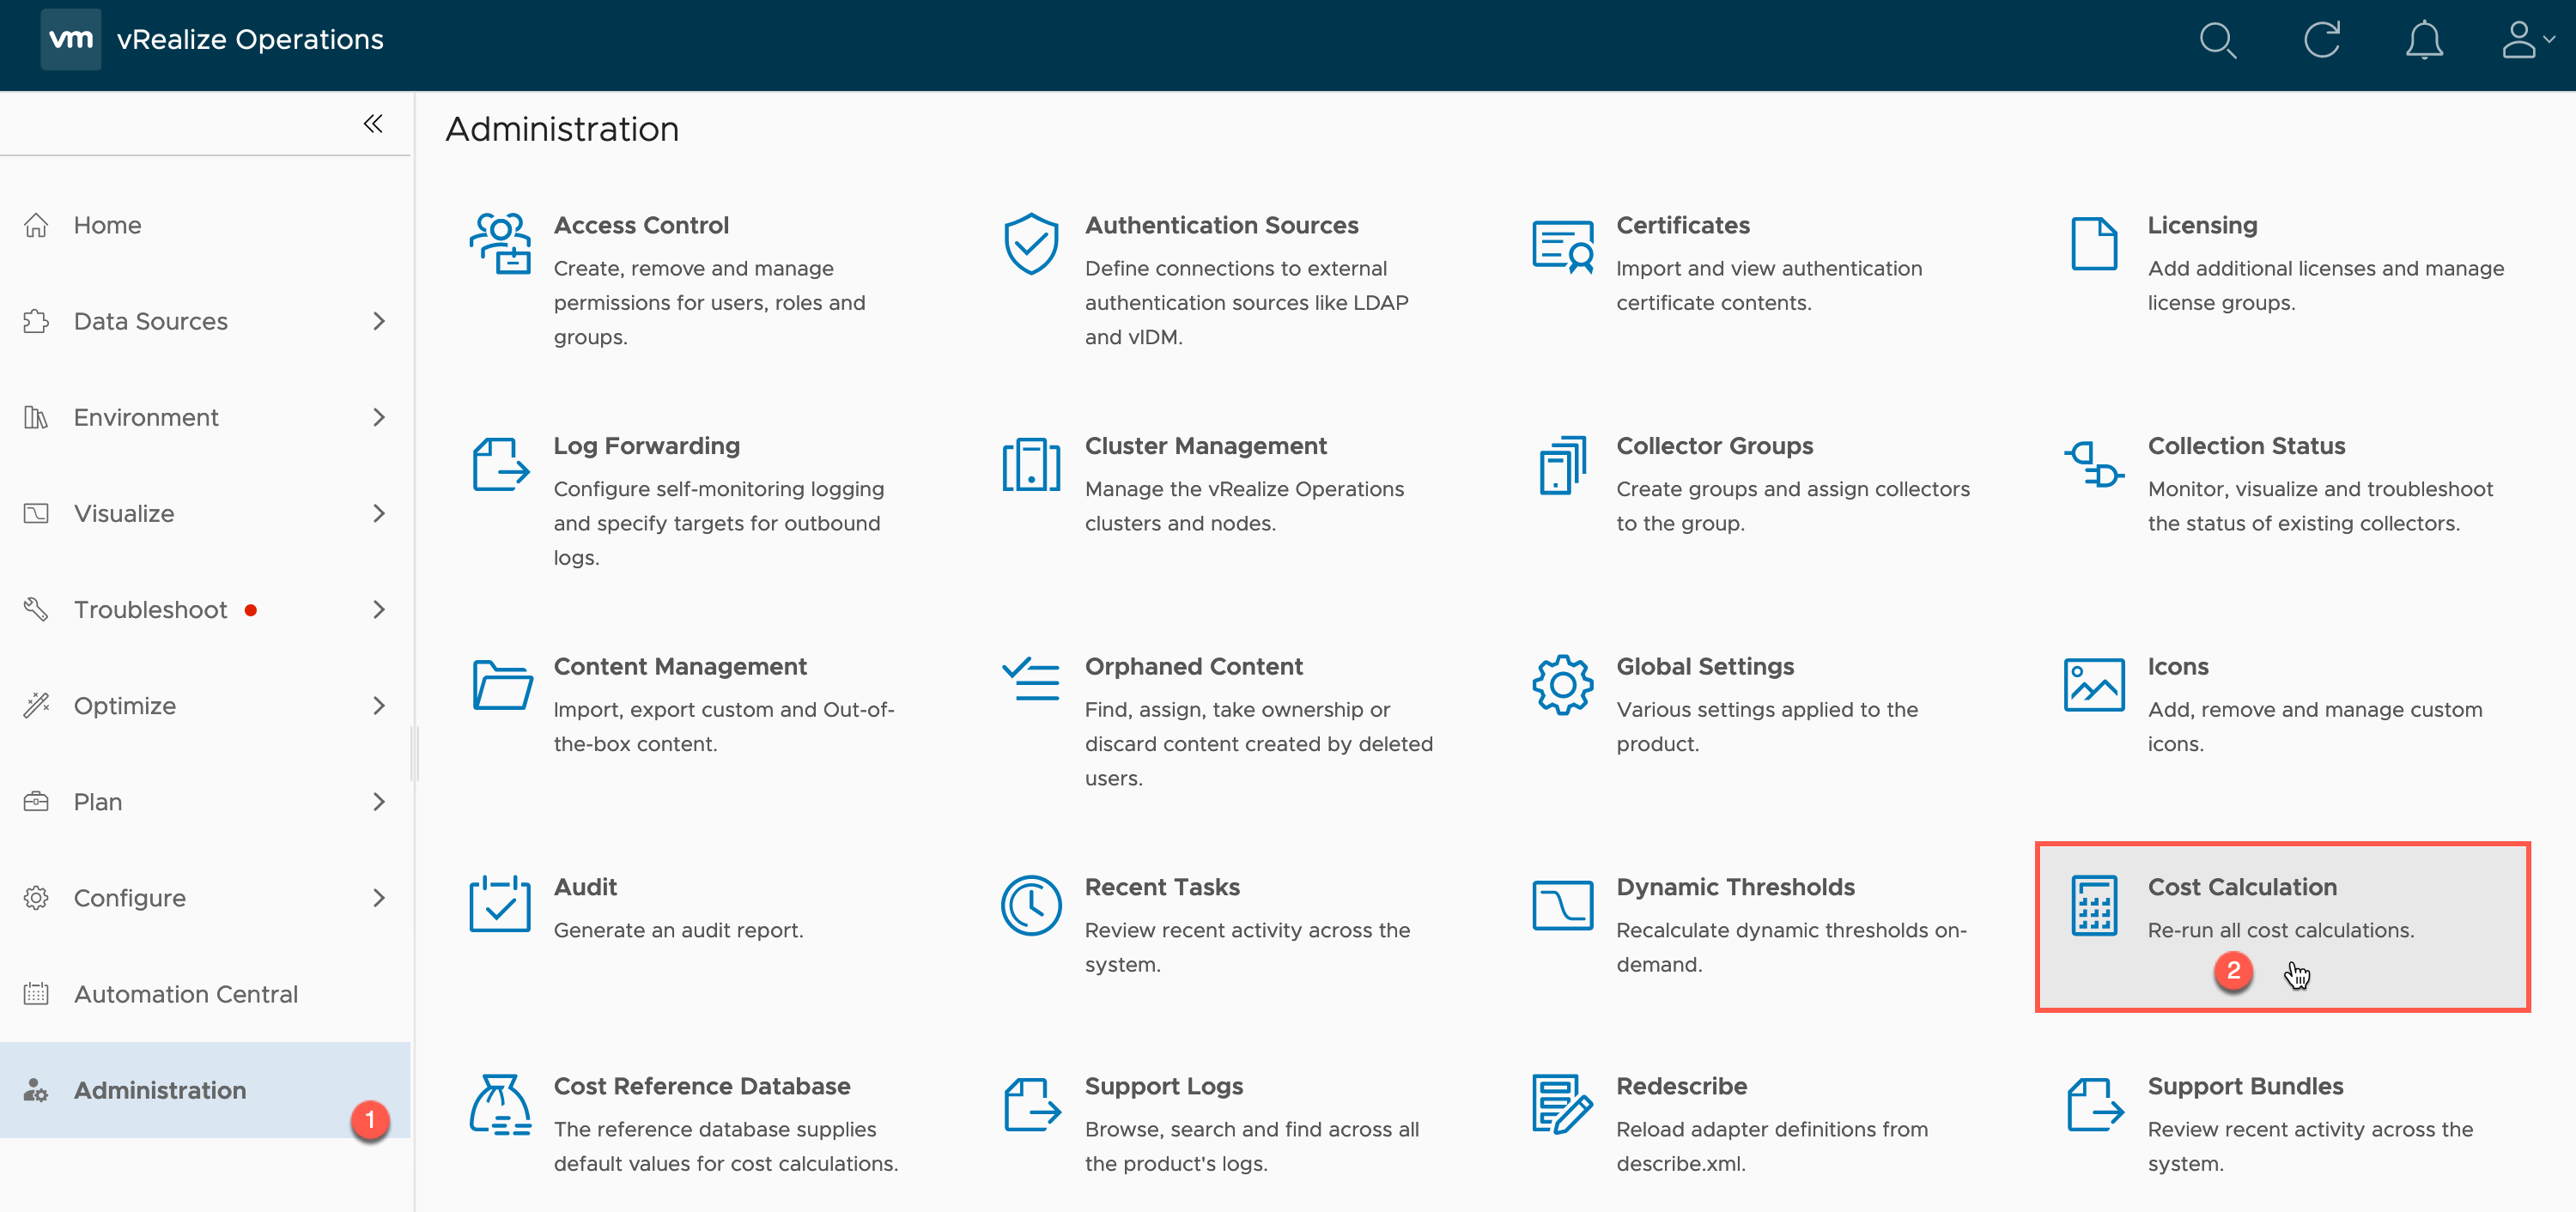
- Select Administration from the left-hand navigation pane.
- Select Cost Calculation
The only option on this page is to run the calculation process, with a basic status update as well, as shown in the below images.
Cost Dashboards
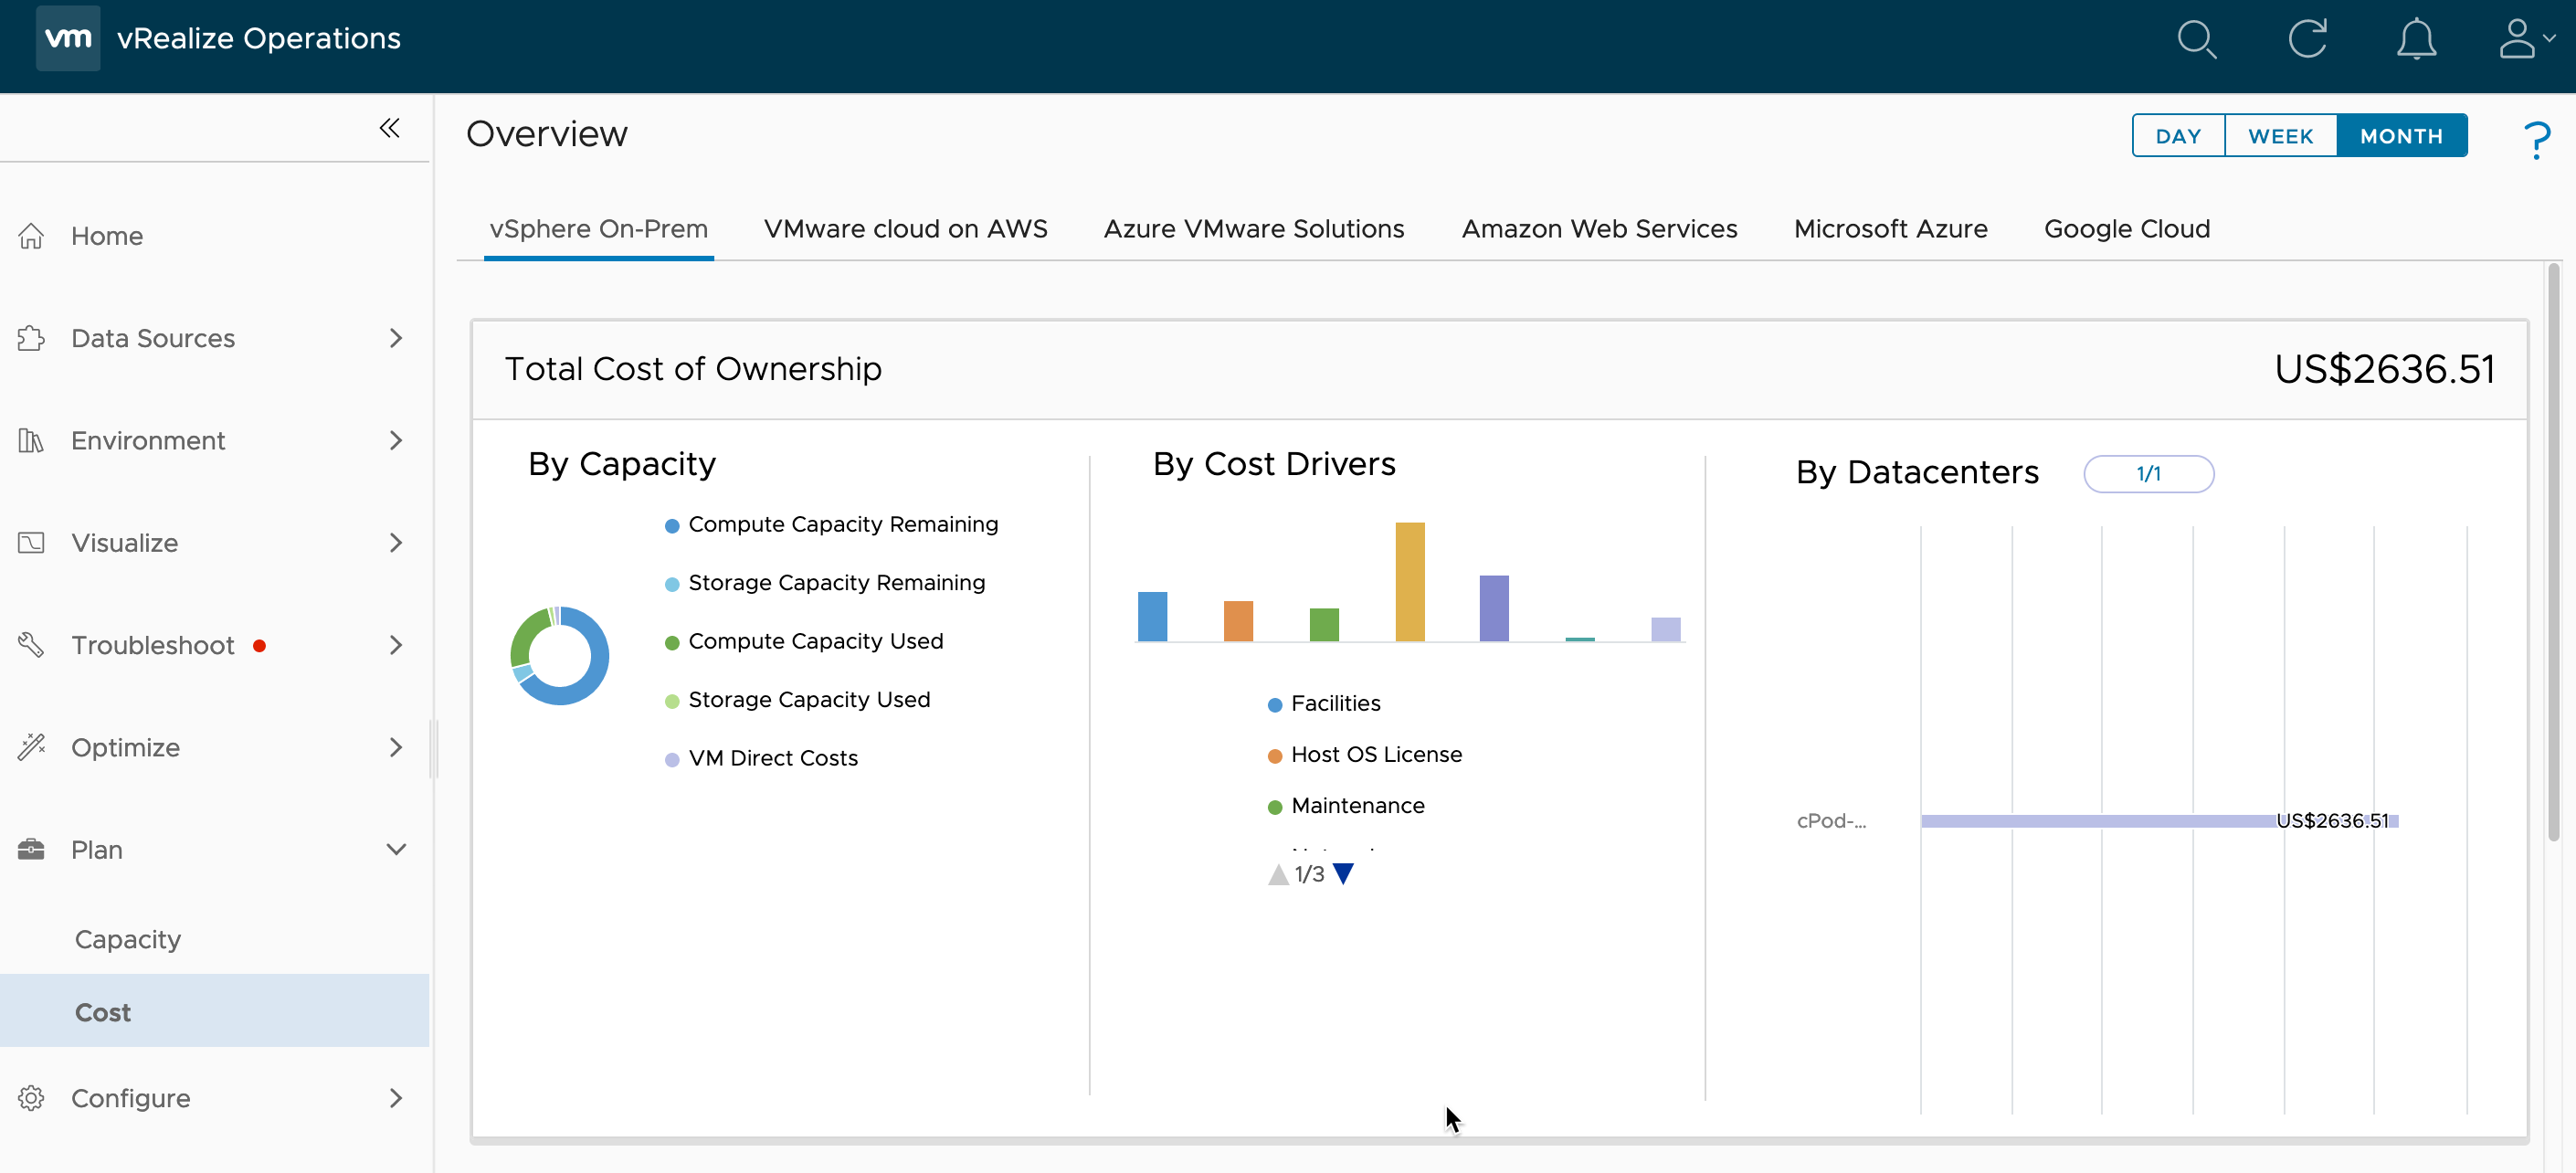
The first Cost UI view I want to show you, is the new UI addition, Pan > Cost View. This brings together all your cloud costs (on-premises, from vROPs, and public cloud, from CloudHealth). To access this view:
- Select Plan from the left-hand navigation
- Select the Cost option
On the first section of the UI, you will see the overall TCO figures.
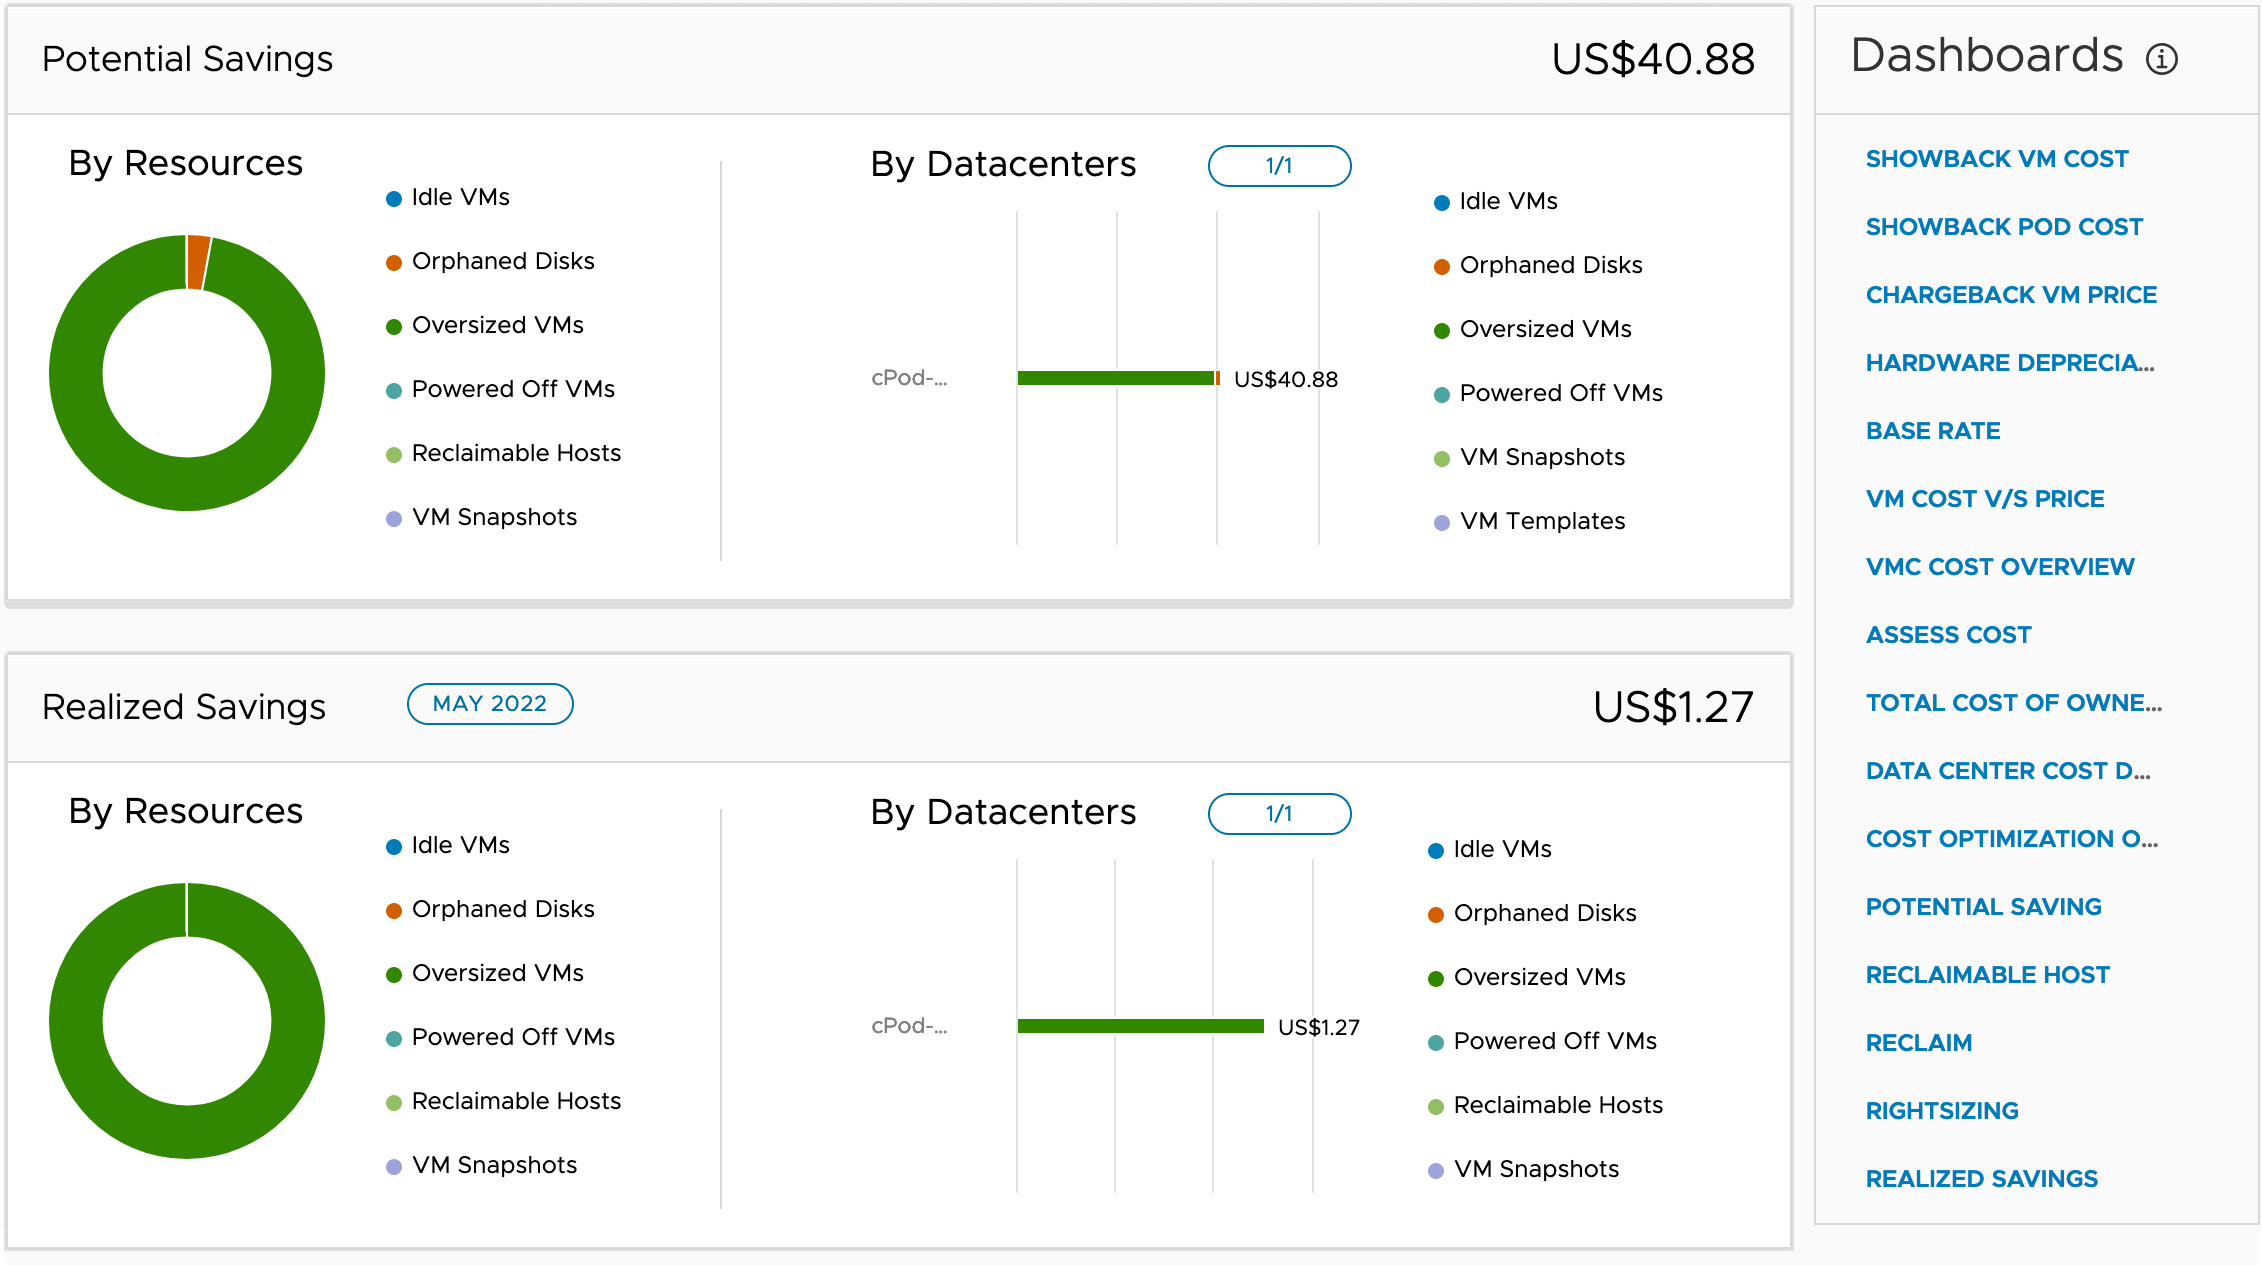
Scrolling down you will see the Potential savings, with a breakdown of how they are calculated, and finally realized savings, from any changes made in the environment. The right-hand dialog box provides quick-link access to all the available dashboards, which we’ll discuss next.
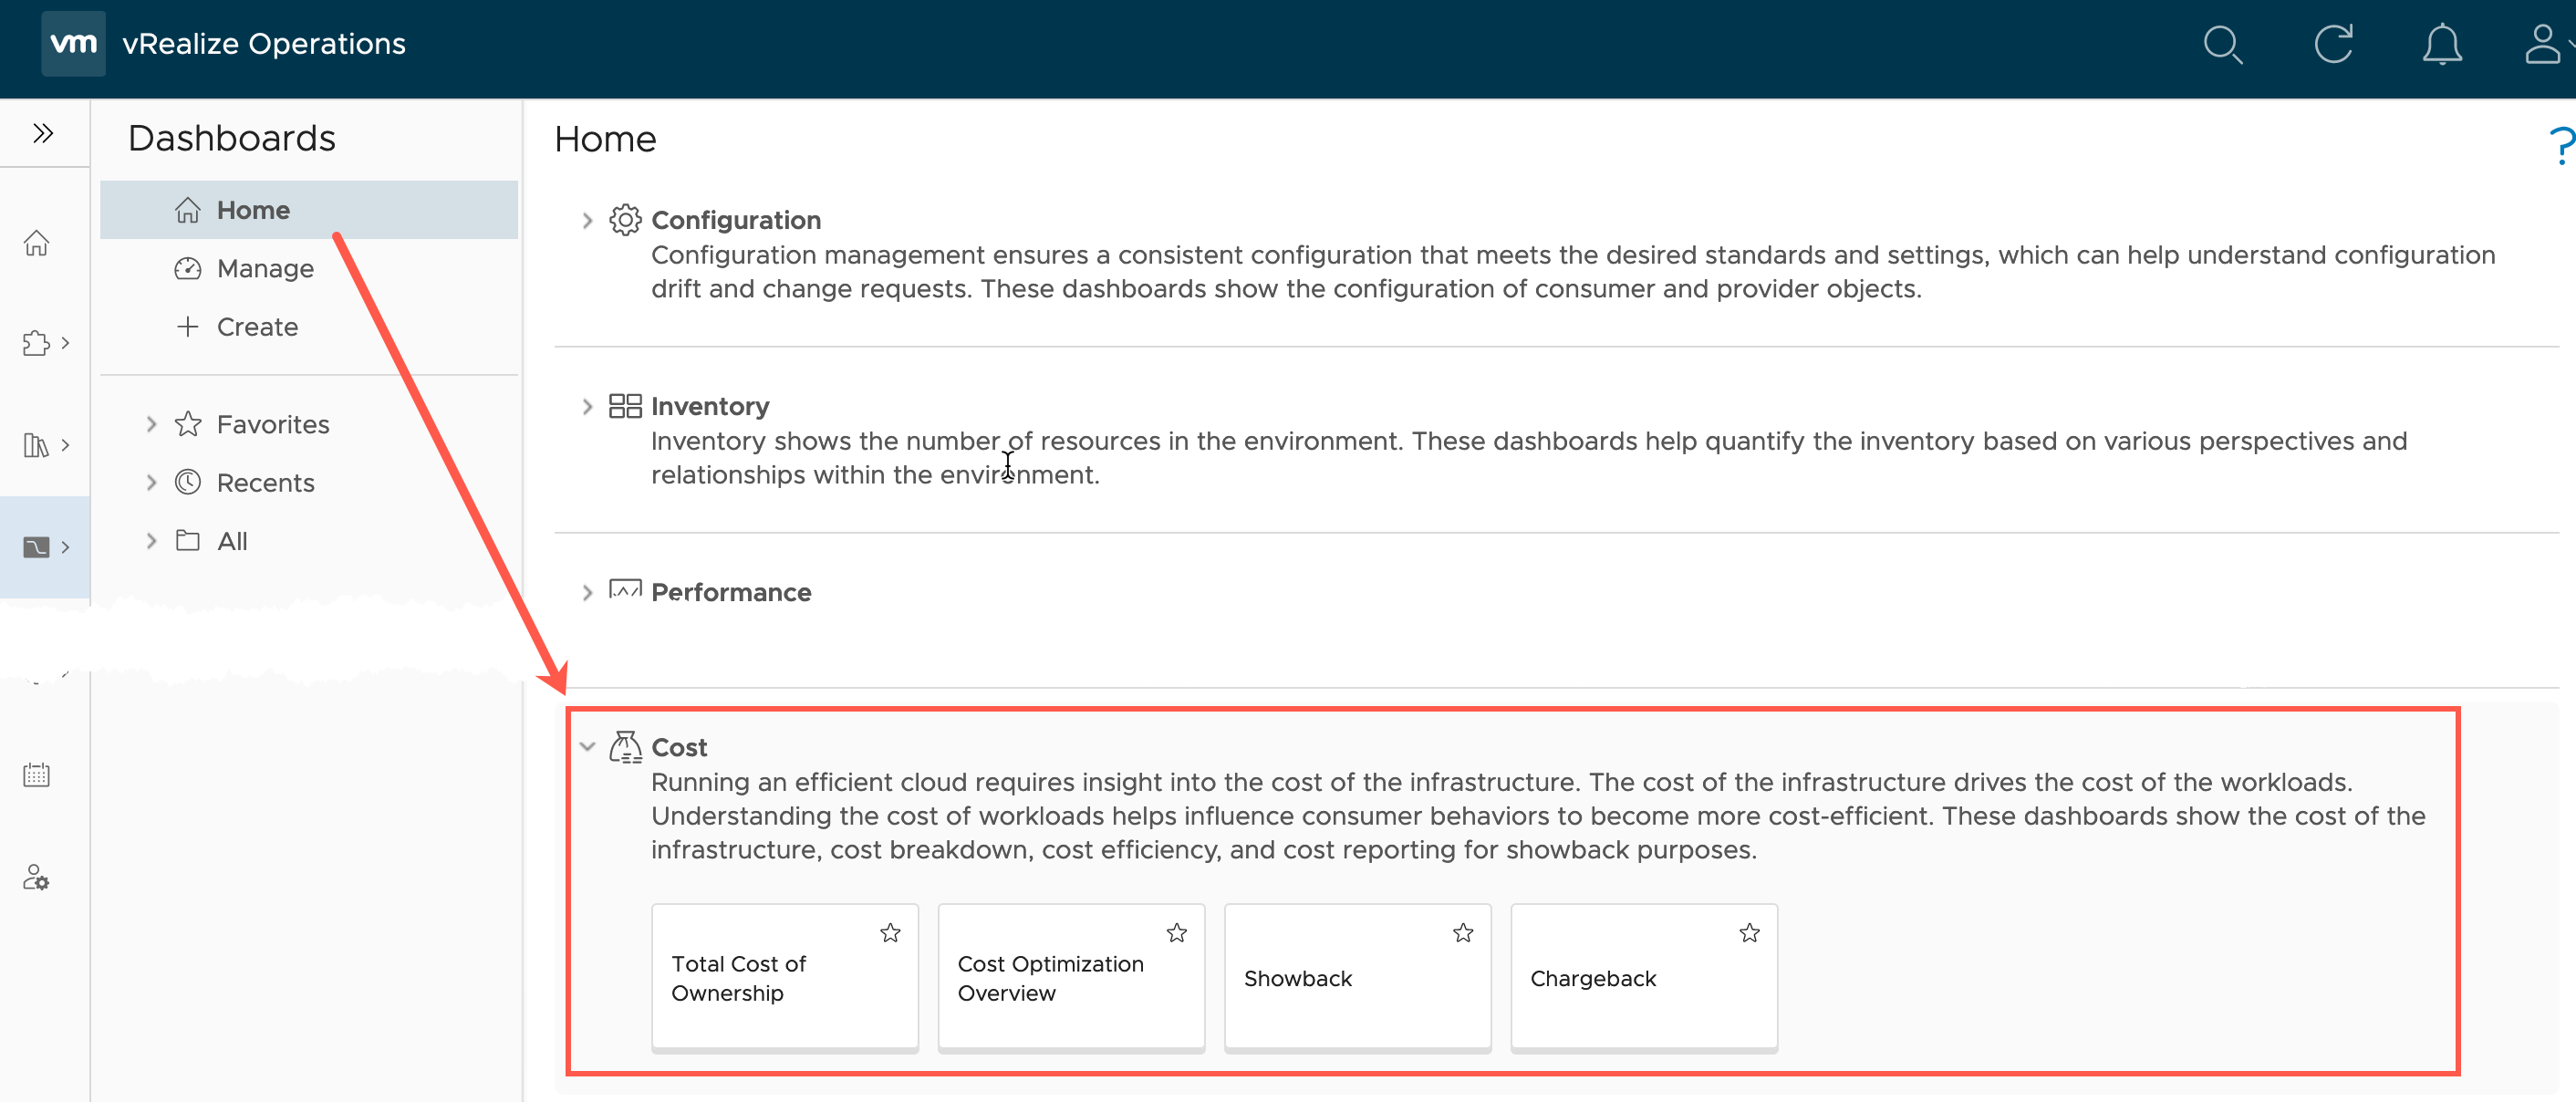
Under the new vROPs UI, we have the “Home” screen for dashboards, which details and gives you quick access to the main areas and most popular OOTB dashboards. This includes costing. To access:
- Select Visualize on the left-hand navigation
- Select Dashboards
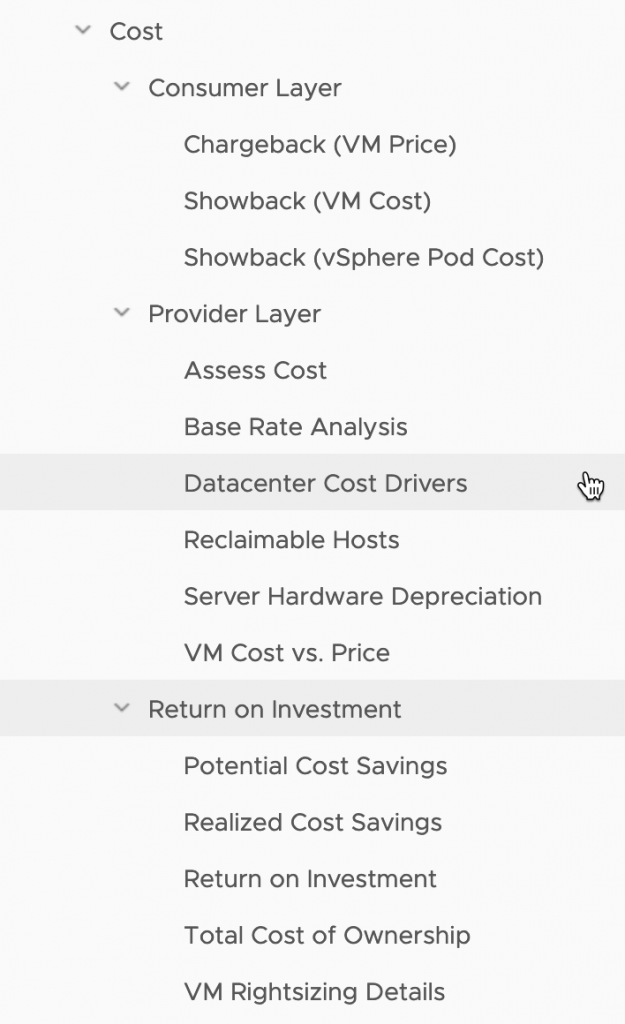
Under the cost section for the dashboard navigation tree, the OOTB costing dashboards are grouped into three district headings: Consumer, Provider, Return on investment.
- Consumer Layer
- These are focused on data for your end users, whether you are going down the Chargeback (using pricing cards) or Show Back route (showing the cost to run the VM).
- Provider Layer
- These look at the administrative costing details of running your platform itself.
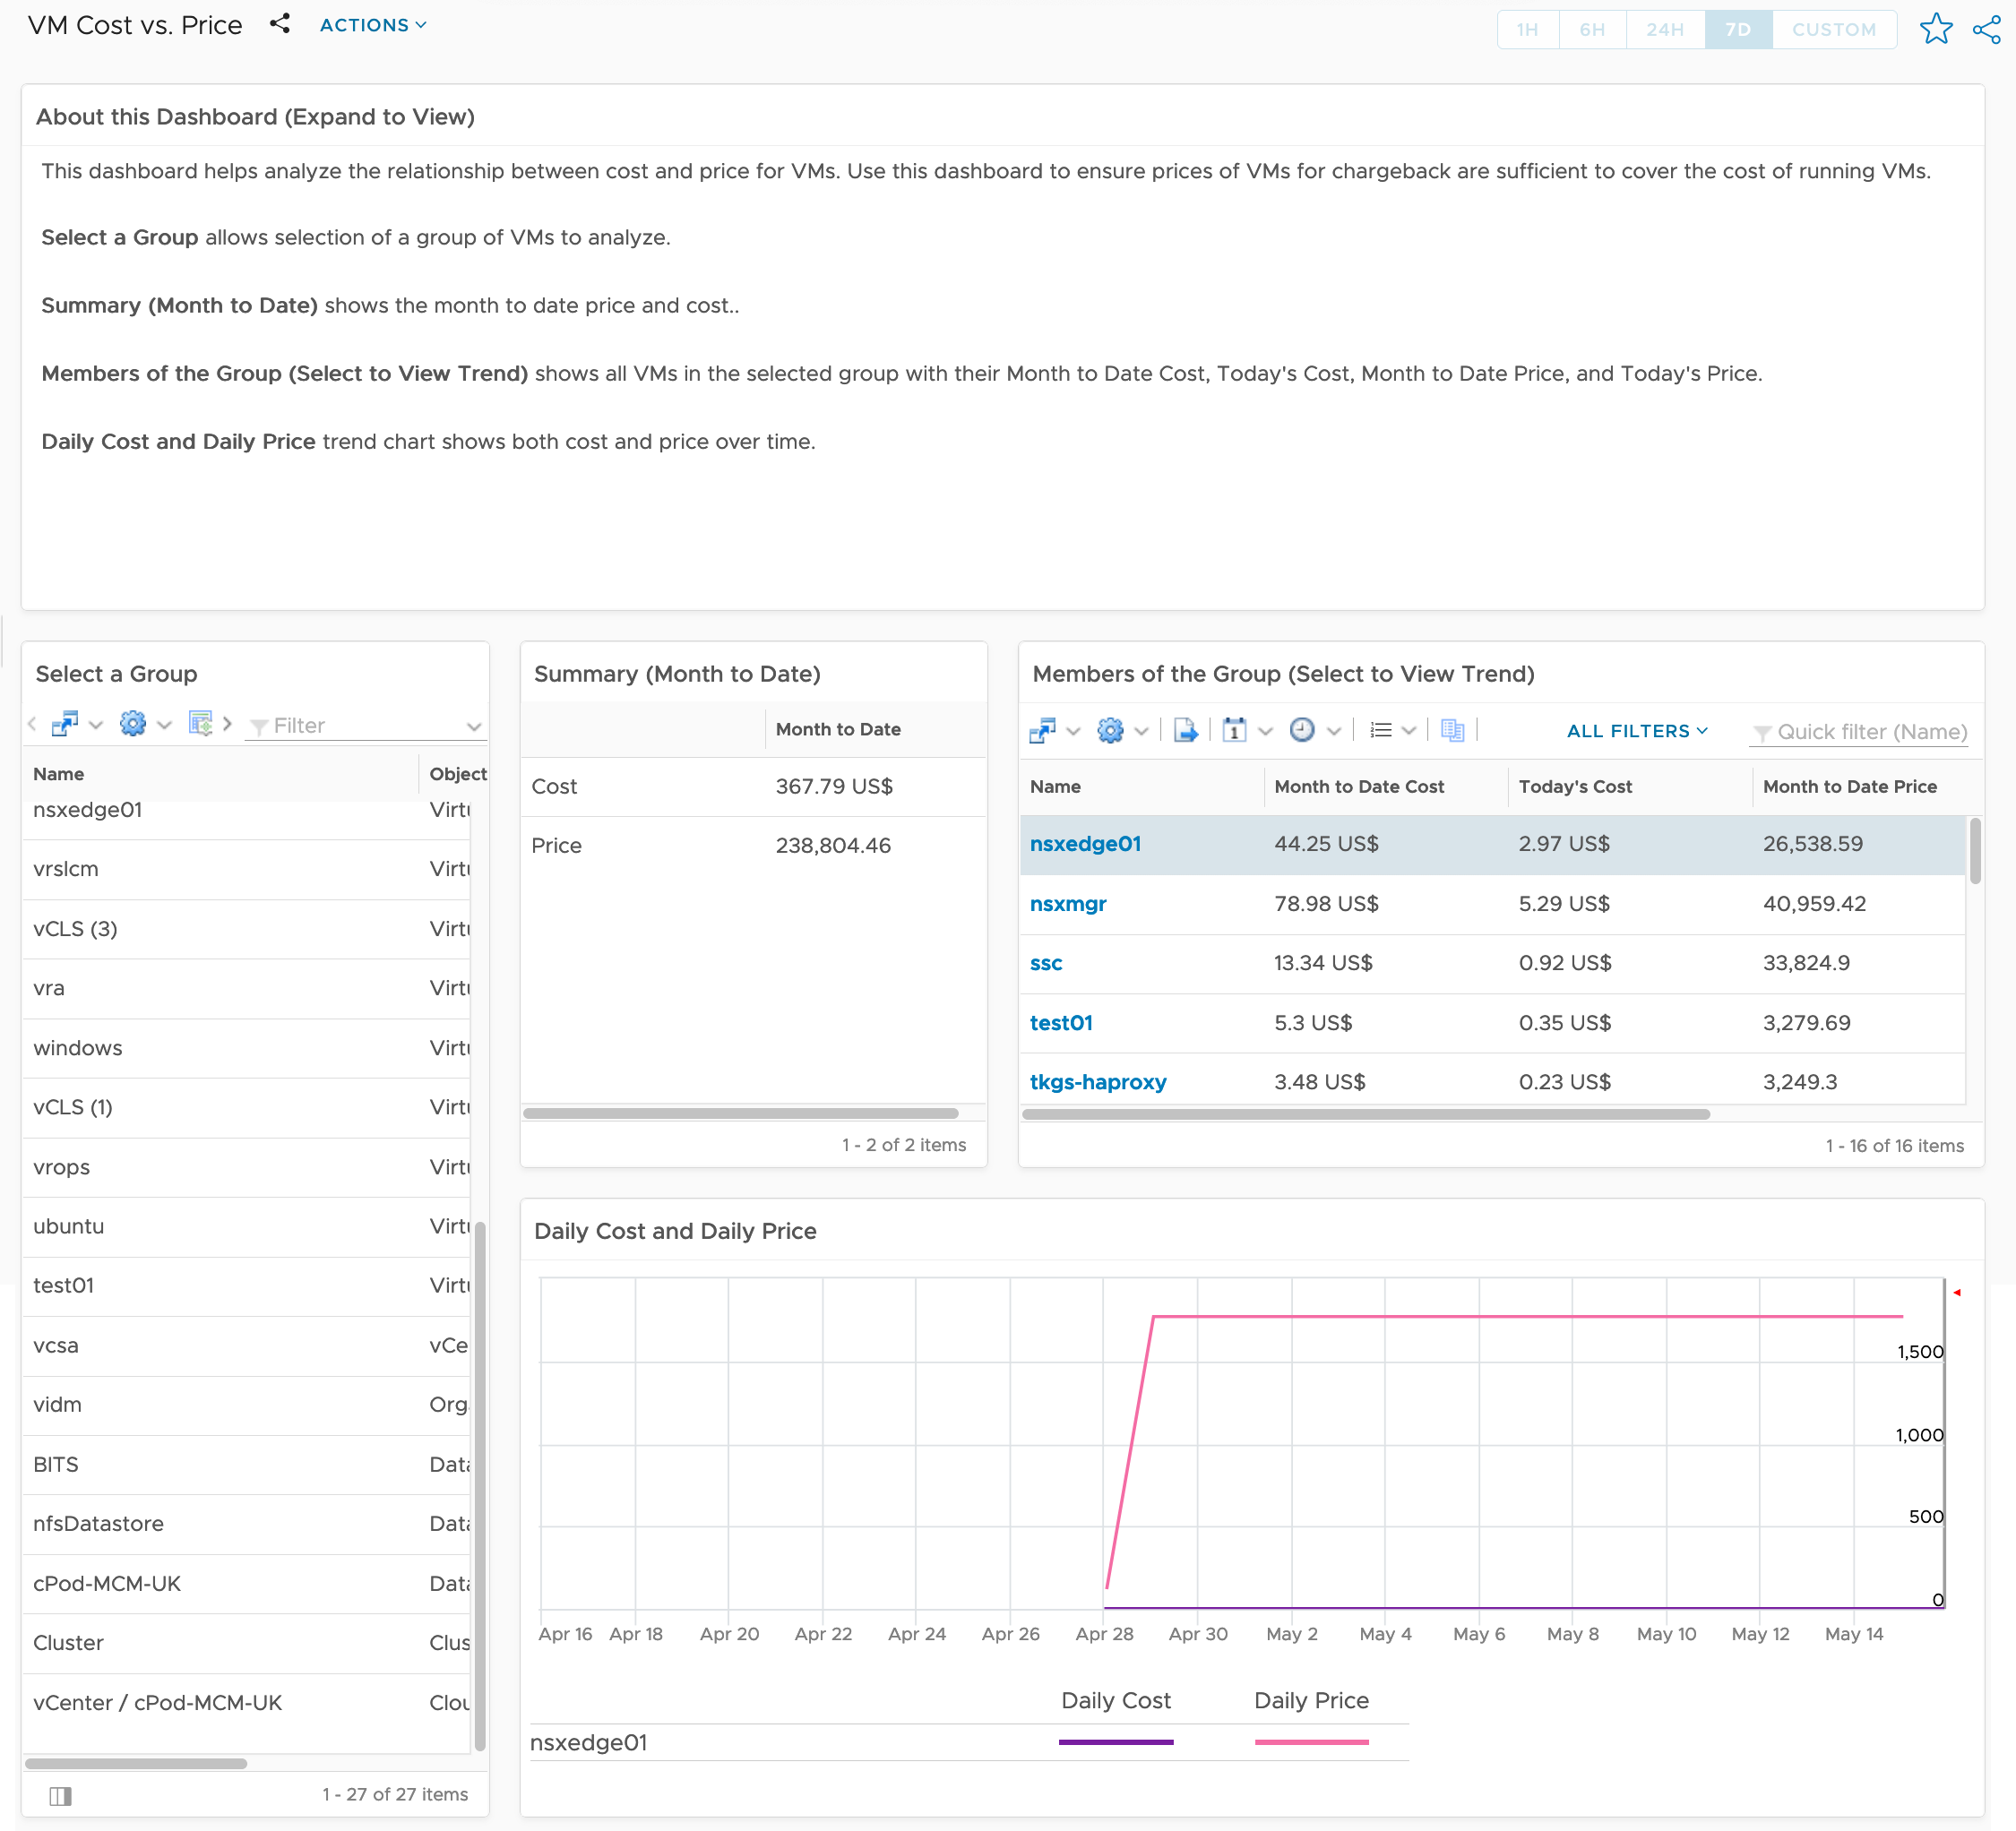
- For me the most important dashboard here is “VM Price vs Cost”. If you are recuperating cost from your departments in your business, you want to ensure that the costs you are charging is more than the cost to run them.
- If you are using cost factor charging, the user costs will always be the same or more than the cost to run.
- If you are using rate-based charging, you could indeed configure the cost to be less than the cost to run the VM.
- Return on Investment
- This extends the capabilities for areas such as right sizing for capacity management and adds in the costing information as well.
As with any of the OOTB dashboards, these can be cloned and edited to your needs as well.
Potentially a strategy might be to create dedicated dashboards for service areas or application teams, who can see the associated costs for all their projects and beyond. You can use the sharing options within vROPs to give your users access to these dashboards, without them even having to authenticate to vROPs itself.
Let’s dig into a few of these dashboards in my environment, which will show costing information for my VMs based on the configurations from earlier within this blog post.
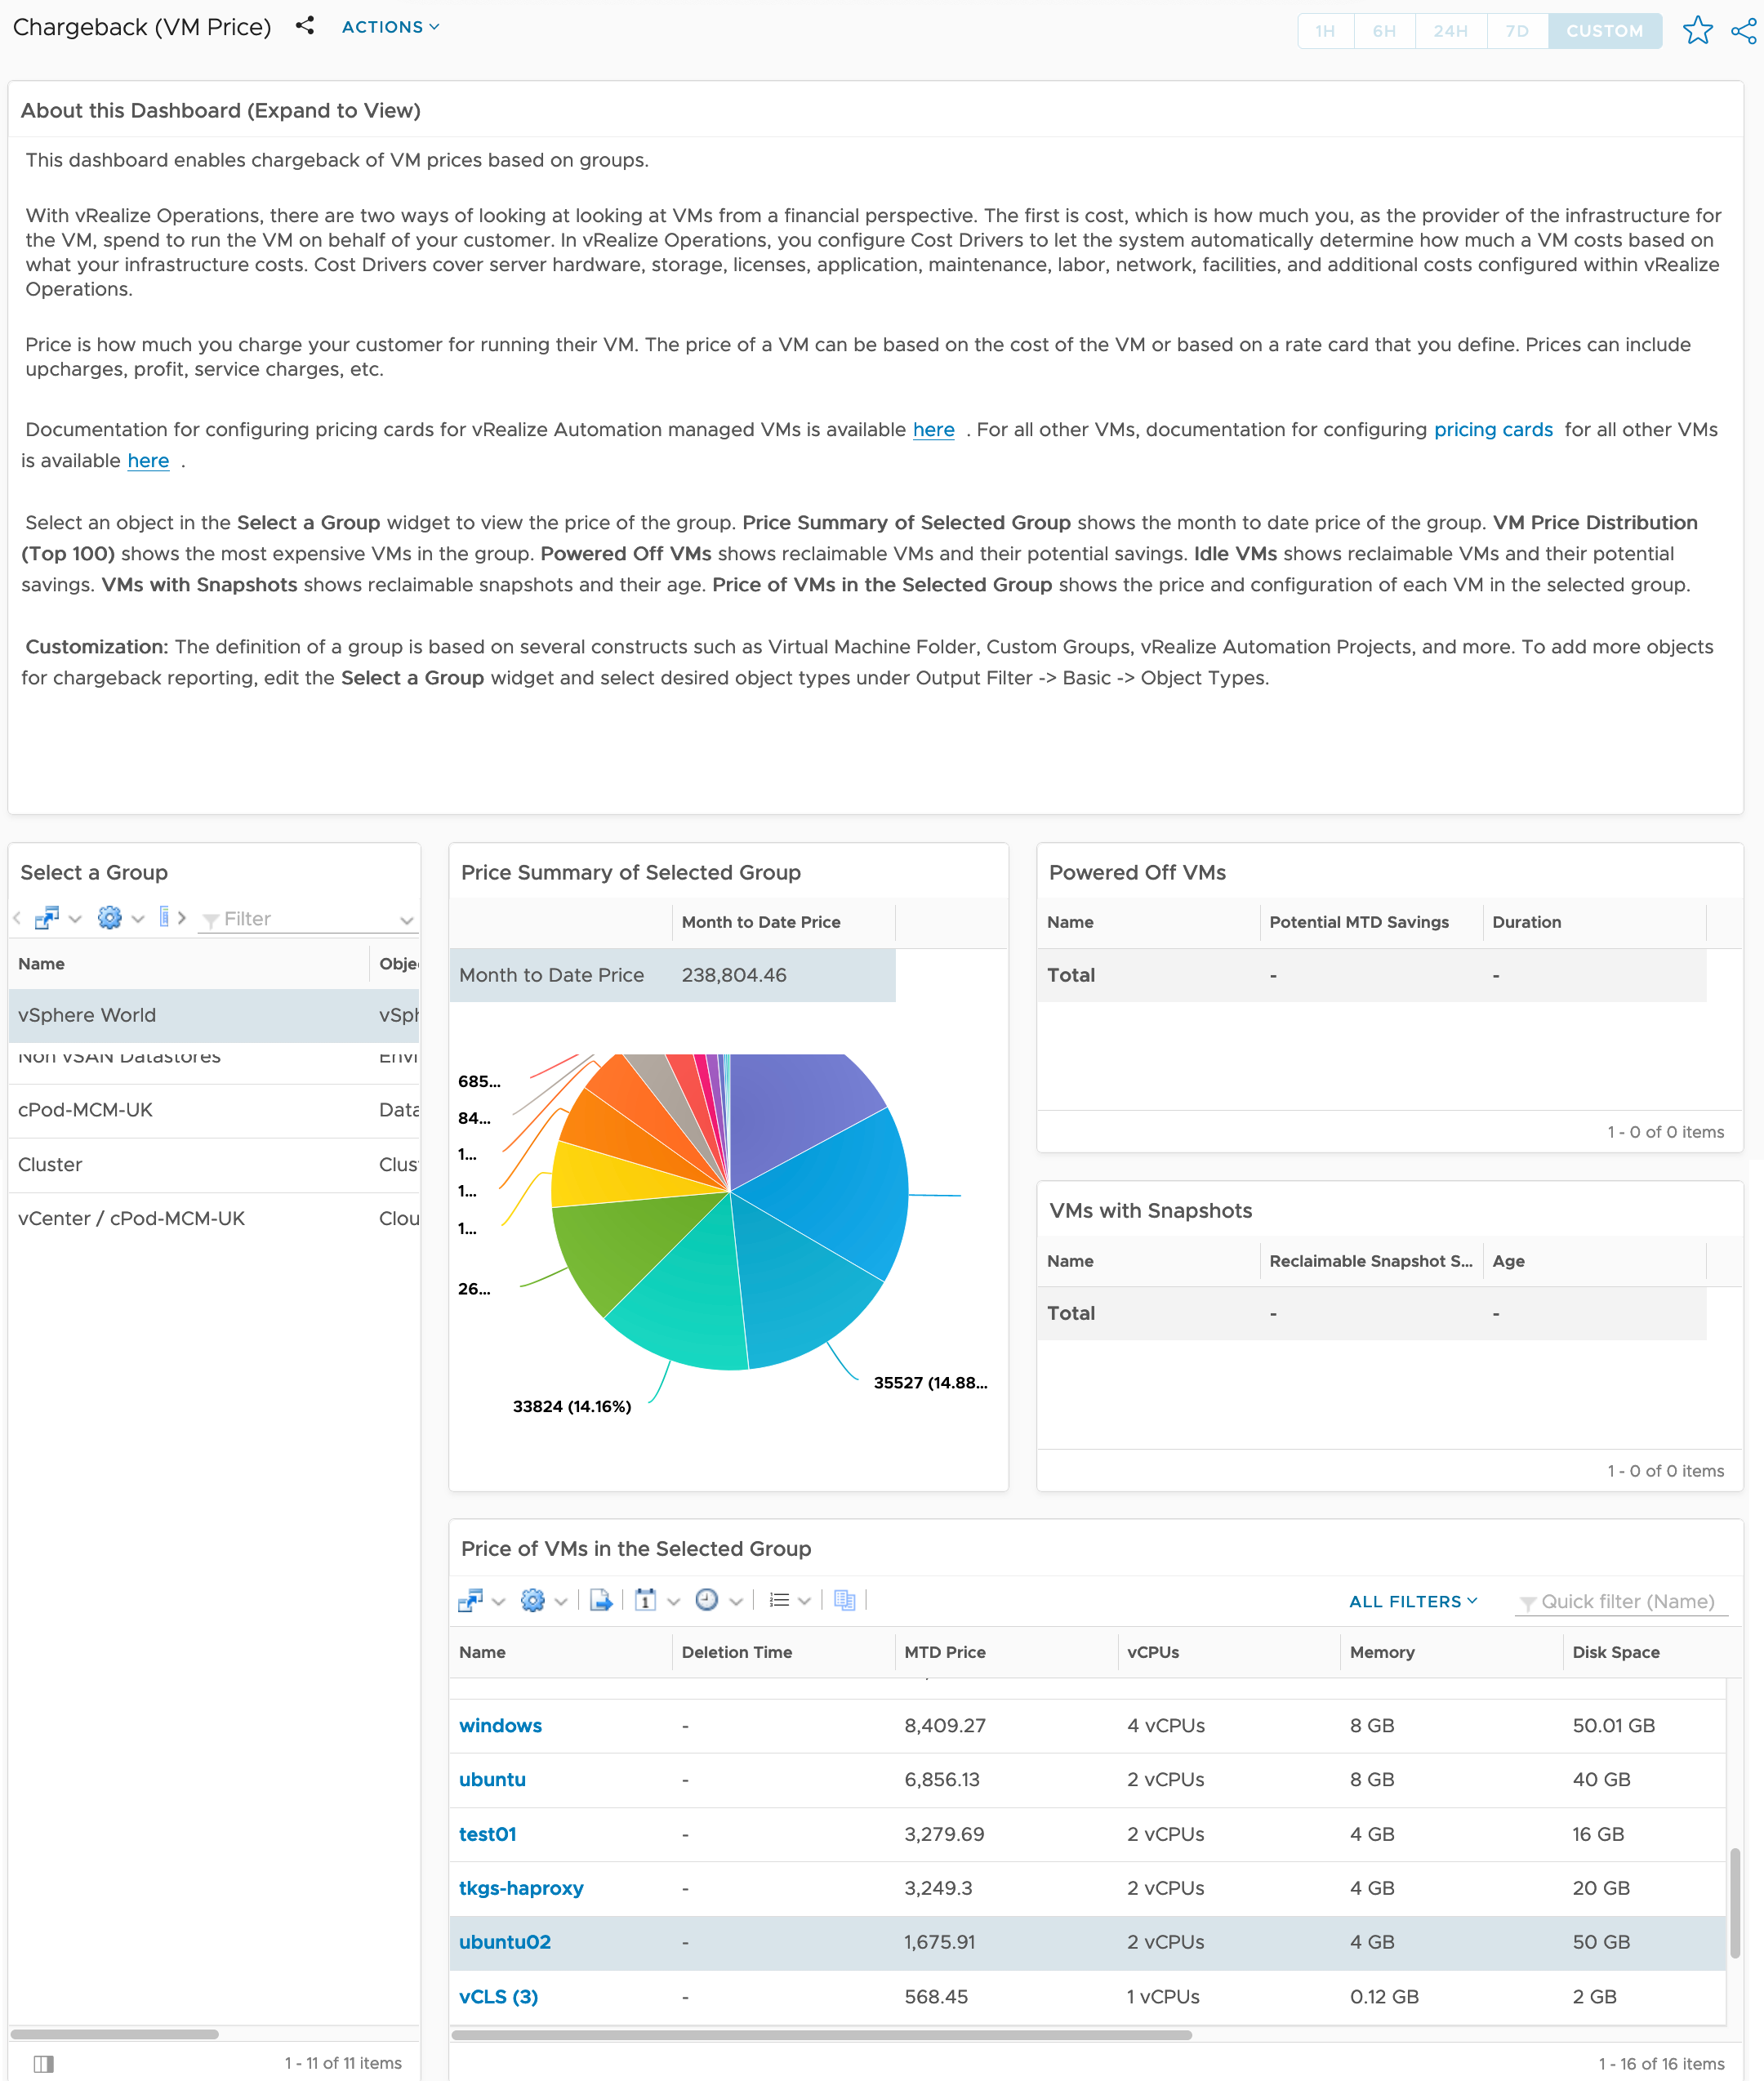
First is the Chargeback (VM Price) dashboard. One of the implementations I like about each of these dashboards is the included “About this Dashboard” widget, which you can expand for a full in depth explanation about the dashboard. This makes it easy to understand where the data is coming from, and the goal of the dashboard.
This dashboard focuses on showing the cost of VMs running in the environment, typically you are going to use this after you have configured pricing cards.
I think I was overzealous with my Pricing card configurations, running a Ubuntu VM with 2 vCPUs, 4GB RAM and 50GB Disk space is costing $1675.91 a month, seems a little expensive!
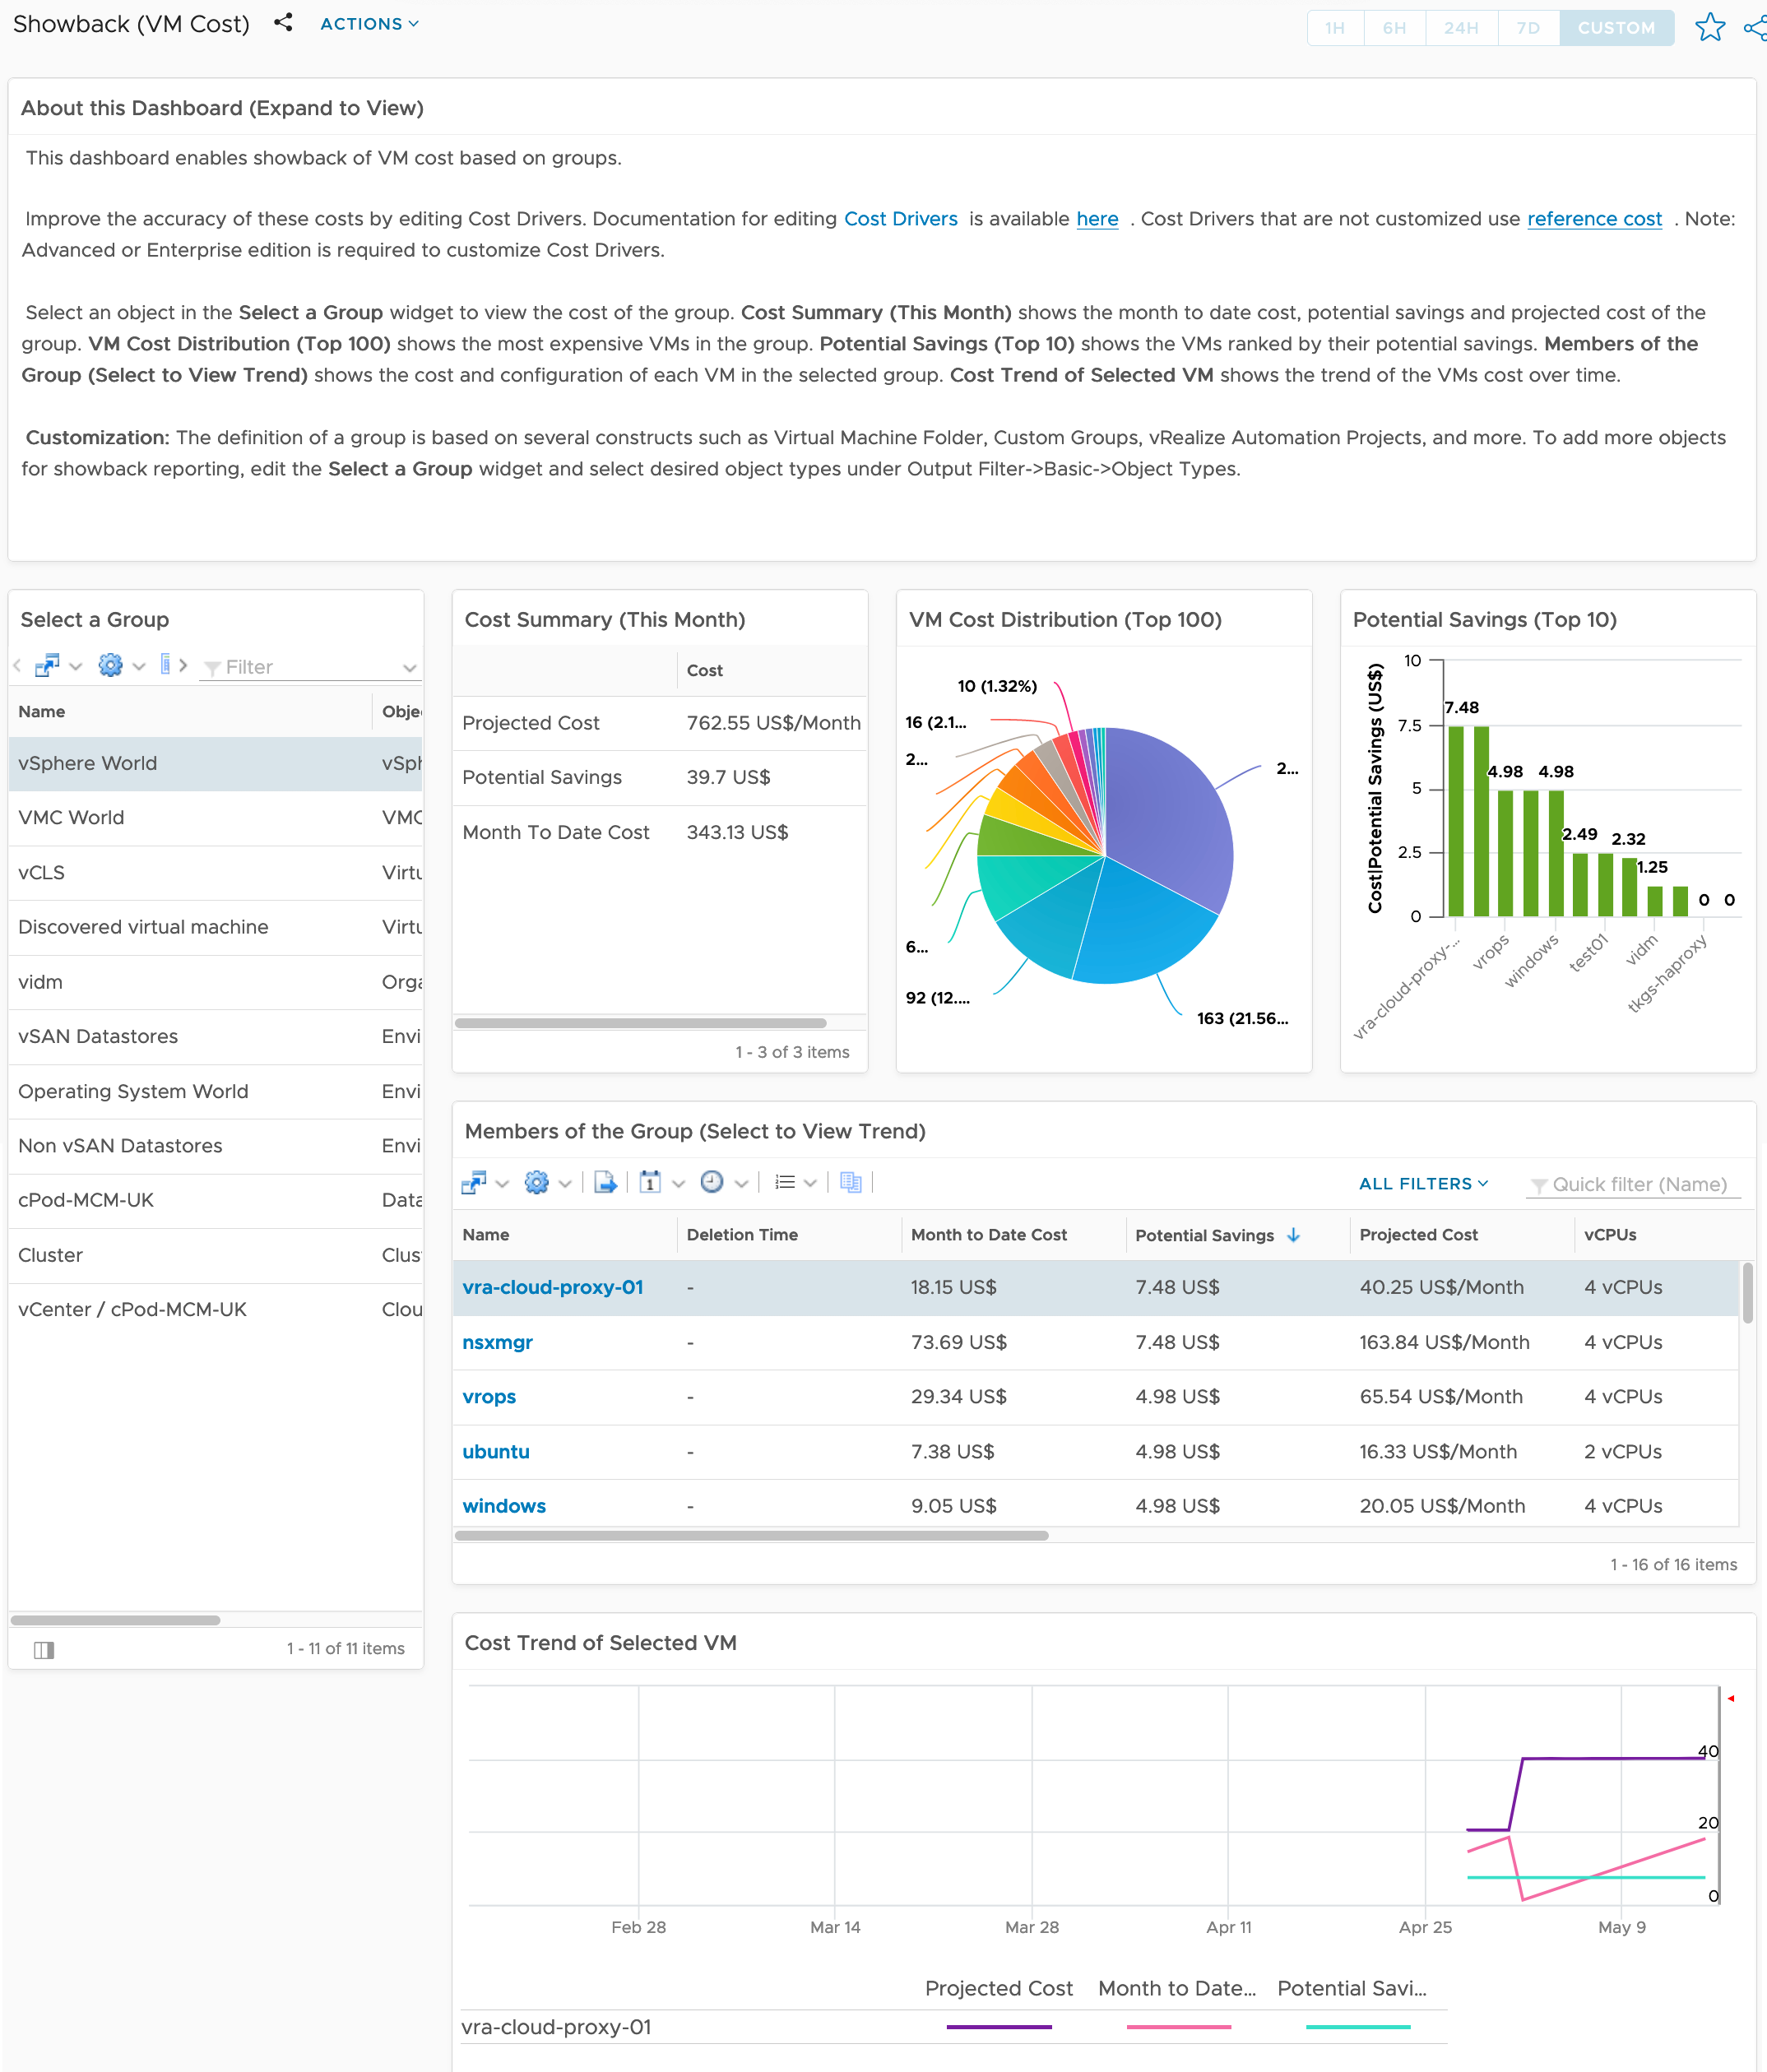
The Showback (VM Cost) dashboard is focusing on the cost of running the VM on the platform, and the effect of any right-sizing operations against the cost of the VM. Again, the explanation of this dashboard also includes some tips on how to customize the groups of VMs shown.
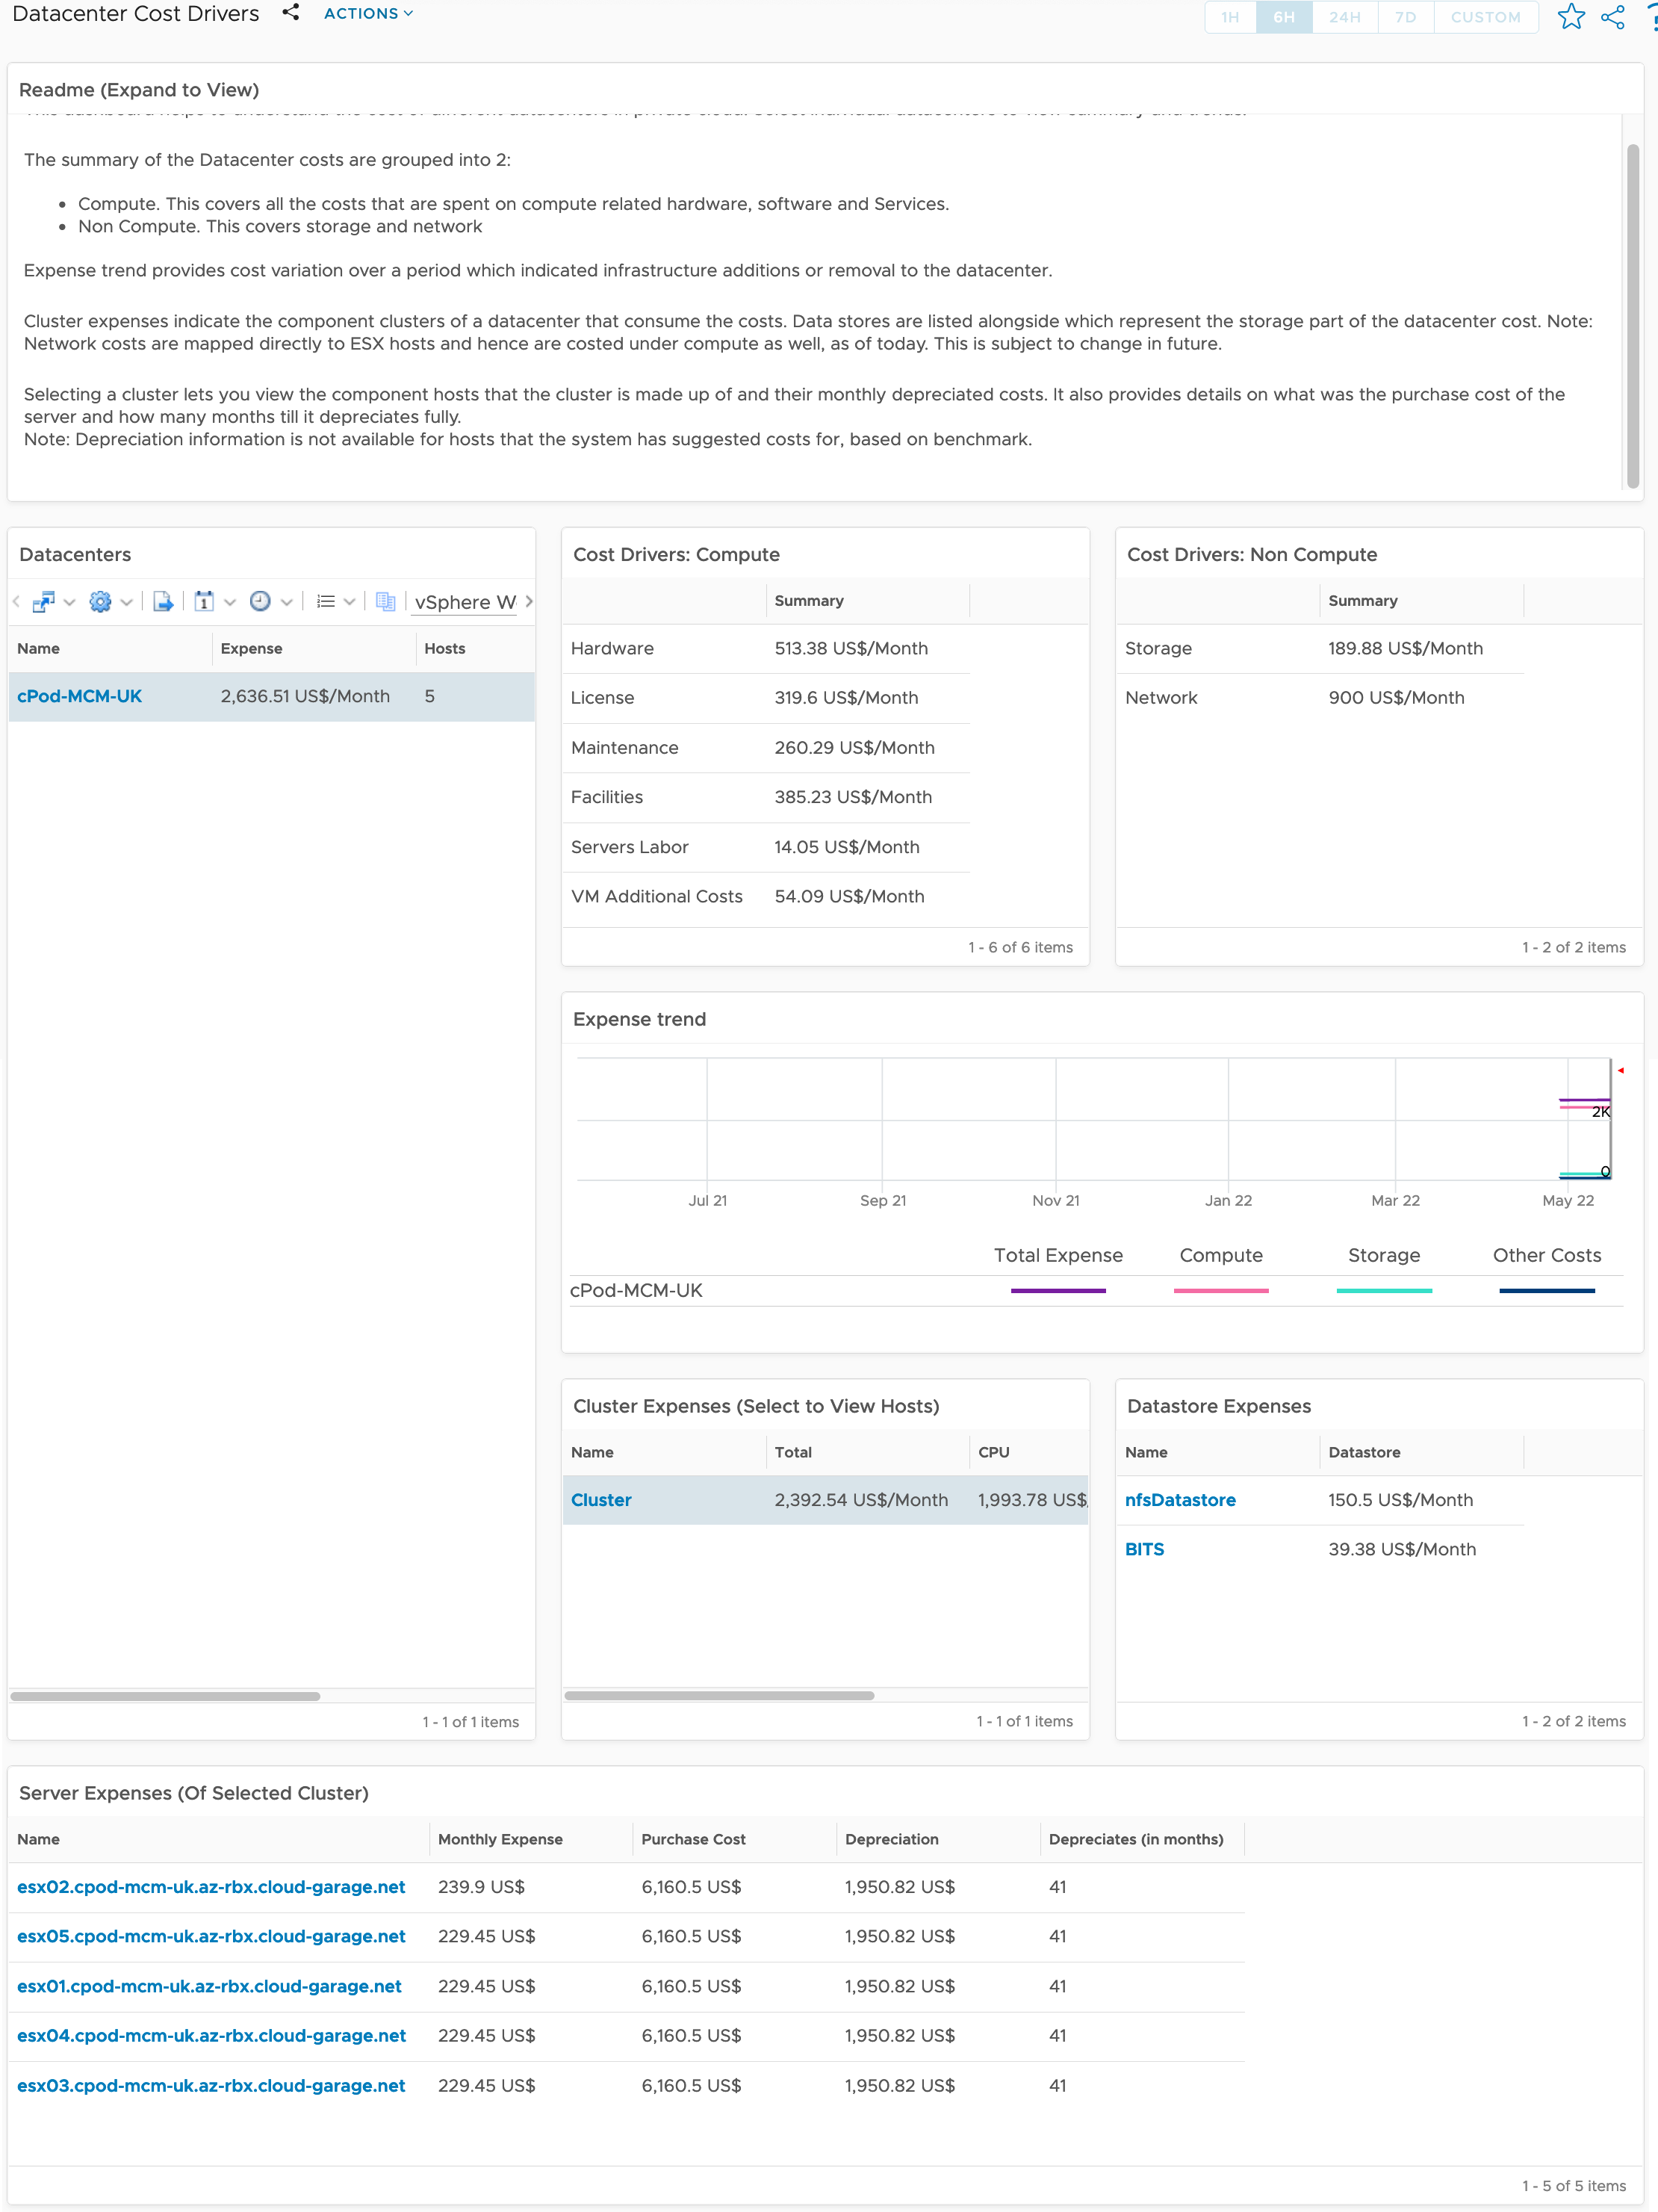
From a provider view, we can analysis the base costs of our platforms across clusters. Interesting in this screenshot, at the bottom, we can see that the cost of one host is higher than others. And upon inspection, this is due to that host having a Windows VM running on-top of it, therefore there is additional costs allocated for the licences.
As a platform provider to your users, and offering chargeback facilities, the VM Cost vs. Price dashboard is probably one of the most important views in vROPs. Simply put, are your users being charged more than the costs to run the virtual machines. If the answer is no, you are potentially running your platform at a loss, and will not recuperate the costs of implementing it. (If that is your business model).
Again, this example shows how overzealous I was with the pricing card configurations.
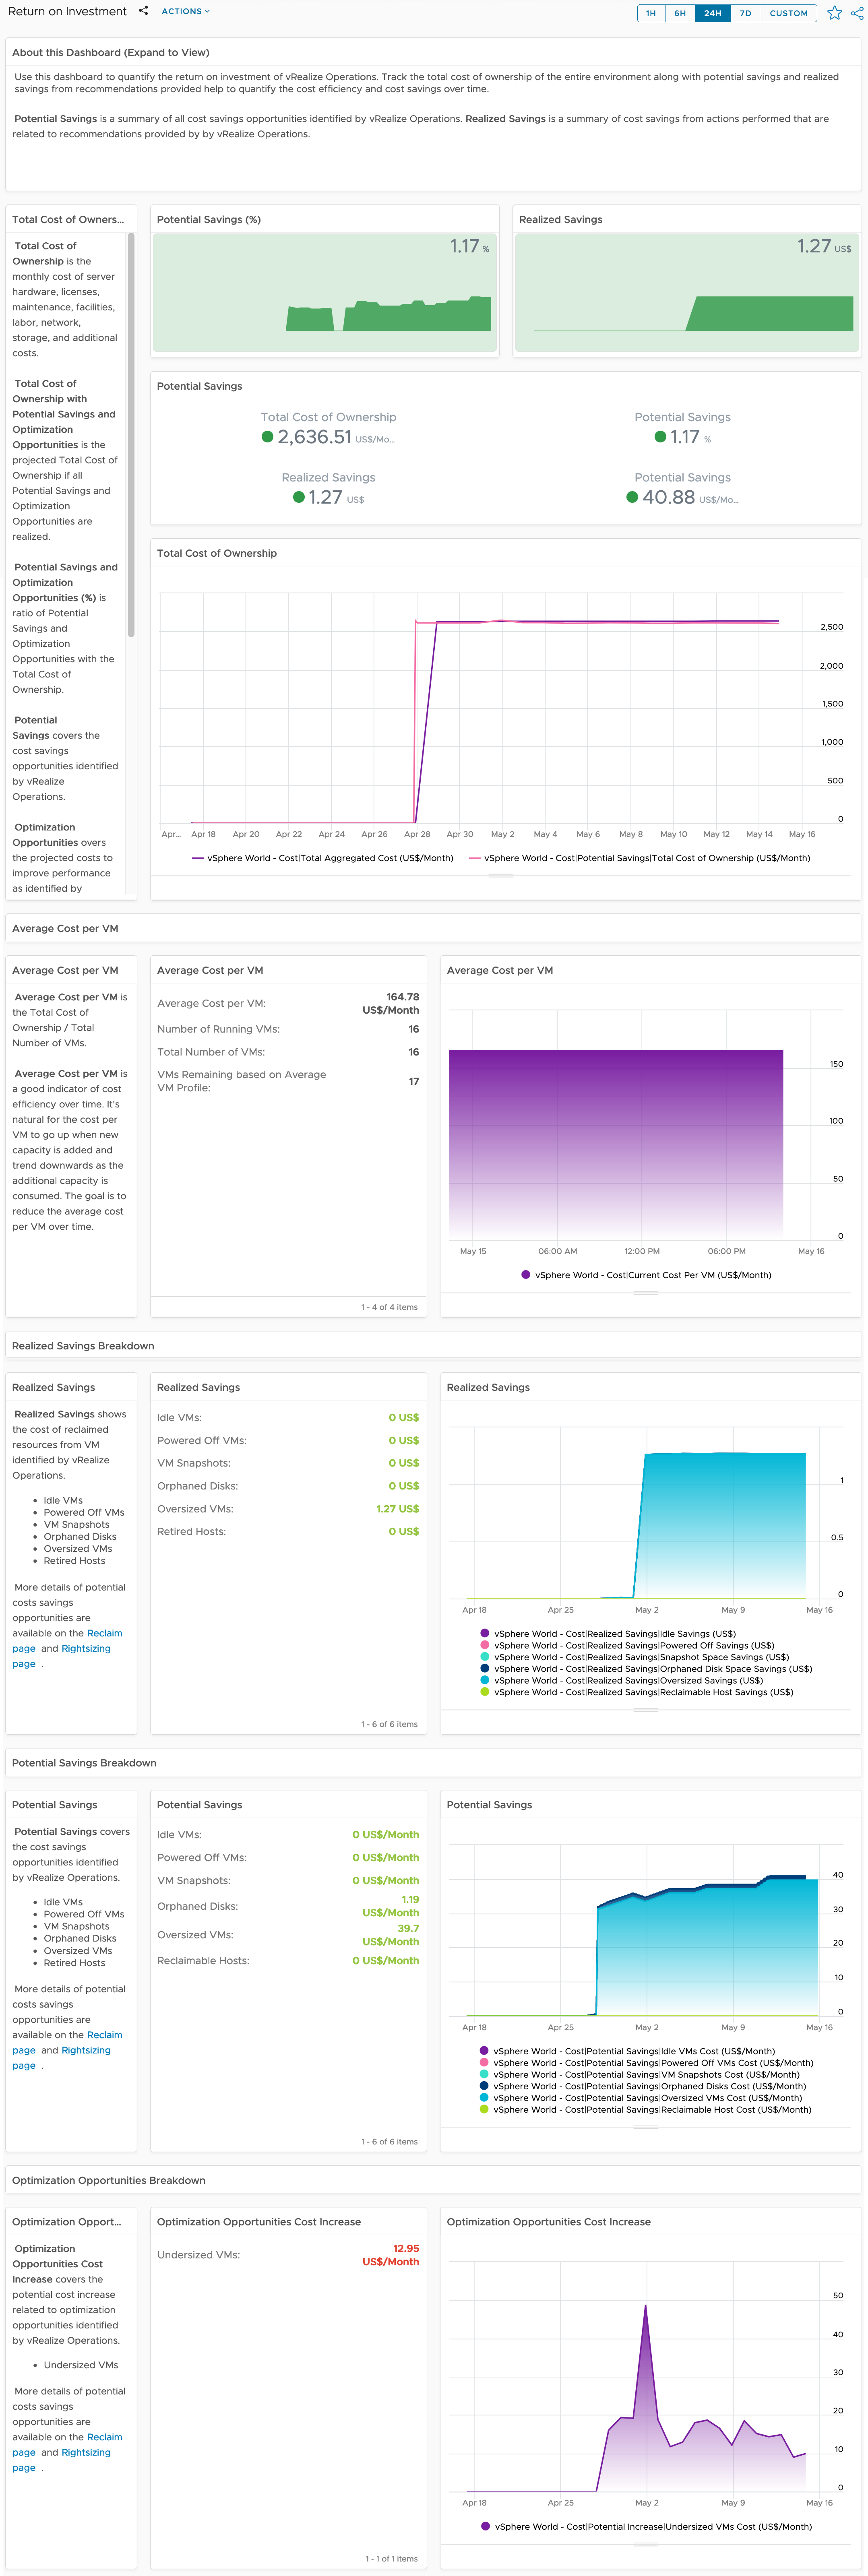
The last dashboard I’m going to show an example of, is the “Return on Investment” dashboard. This is a long one to display in full. But essentially, it’s gathering your overall Investments, any realized savings, and any potential futures.
For me, this dashboard should be used in conjunction with any capacity planning dashboards for optimization or addition of resources.
What Happens when a VM is created and deleted within the pricing card period?
This is a question which comes up on a regular basis. Typical for pricing cards set to hourly charging and the virtual machine has only been running then powered off or removed after, for example, 47 minutes.
After the hour period has passed, vROPs will chart the pro-rata cost of the VM for the time that it ran.
What happens for VMware on Public Cloud Costs (VMC, AVS, GCVE etc)?
Cost factor pricing cards are not applicable, as you are paying for a managed service. vROPS will either use the retail pricing for these services, or the pricing provided as part of the Cloud Providers rate card. For VMC, if you connect a VMC account with billing permission, vROPs will pull the costs in directly from this connection.
Once configured as you need, then you can configure VM pricing cards for your environments.
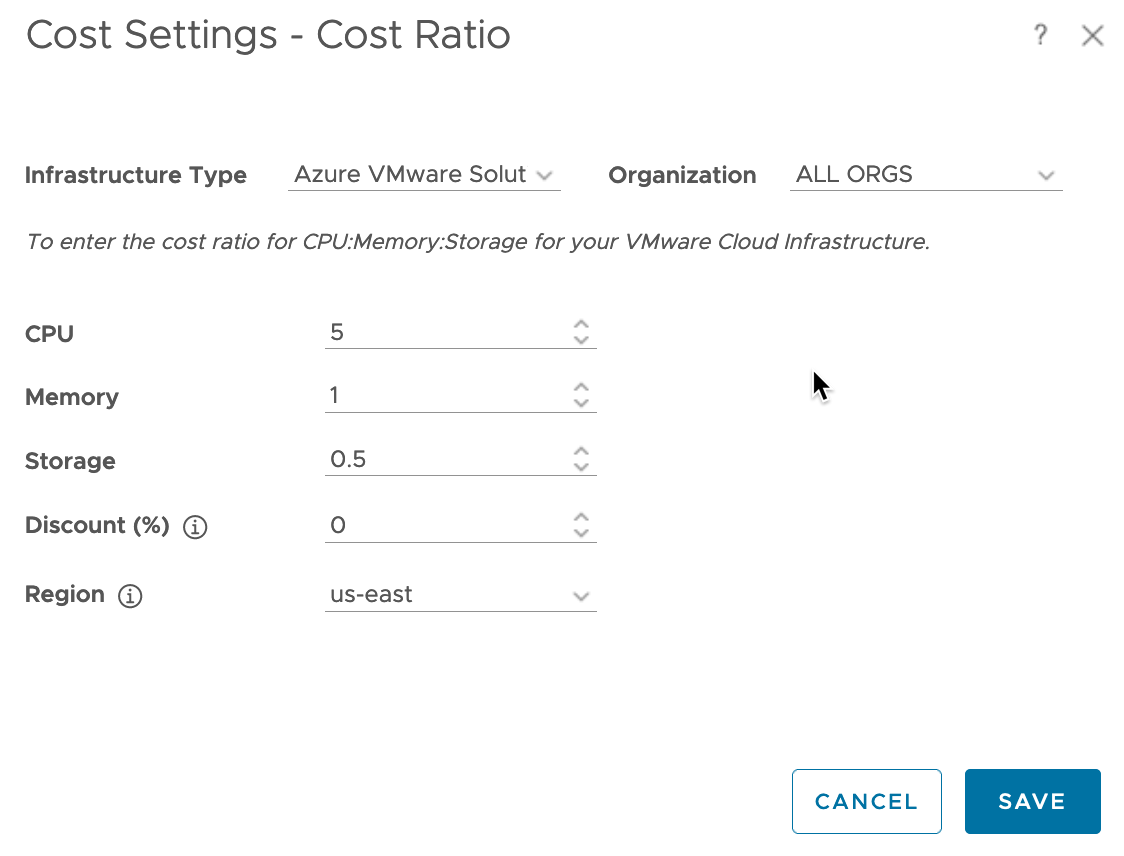
One last comment for pricing, under the master cost settings, you can change parameters, such as cost ratios for the main categories of resources, and discounts per region, as necessary.
Pushing the vROPS Costing data to CloudHealth for full multi-cloud costing capabilities
vRealize Operations covers all your on-premises footprint when it comes to costing, helping you provide showback and chargeback capabilities.
If you are using CloudHealth for your Public Cloud finanical operational planning and management, the next step is bringing the data from your on-premises environment into CloudHealth to give you full Multi-Cloud costing and modeling within the same tool. I’ve covered off this integration in the blog post below:
Wrap-up and Resources
I created this blog post to really show you the end-to-end configuration and impact of the costing features within vROPs. You can view the below link for the official documentation which details out some of these configurations and covers areas I have not. I’ve stuck the main areas I demo to customers, or answer questions about. But there are other areas worth reading up about and at least knowing are available
- Offical Docs – vRealize Operations – Business Management
Overall, I believe that vRealize Operations provides a fantastic out-of-the-box costing functionality to get you started with Showback, Chargeback and understanding platform costs.
For full finanical operations, I recommend looking at the CloudHealth integration, where we can send the costing data from vROps to CloudHealth. Allowing users to start to chart out and understand their on-premises costs alongside their public cloud costing breakdowns.
Regards







thank you for the information
Thank you to share these valuable information. Was really helpful.