In this blog post, we are going to synchronise our vRealize Operations costing information with CloudHealth, to provide the ability to have true multi-cloud cost reporting, that includes our on-premises VMware Datacenter.
Configuring the CloudHeath Integration
Pre-Requisites
Your vRealize Operations instance will need to have the basic cost settings configured, I have written a deep dive post on this here.
- vROPs no longer has to be set to USD for this integration
- If you are integrating multiple vROPs instances, and they all have the same currency, this is also supported for non-USD
- If you are integrating multiple vROPs instances, and they have differing currencies settings, CH will default the platform to the instance that was first configured for integration.
- vROPs must be version 8.2 of higher
- vROPS FIPs mode is not supported
Ensure that the vROPs instance (or collector) can reach CloudHealth Graphql endpoint:
You can find the official documentation here and the vROPS Integration FAQ here.
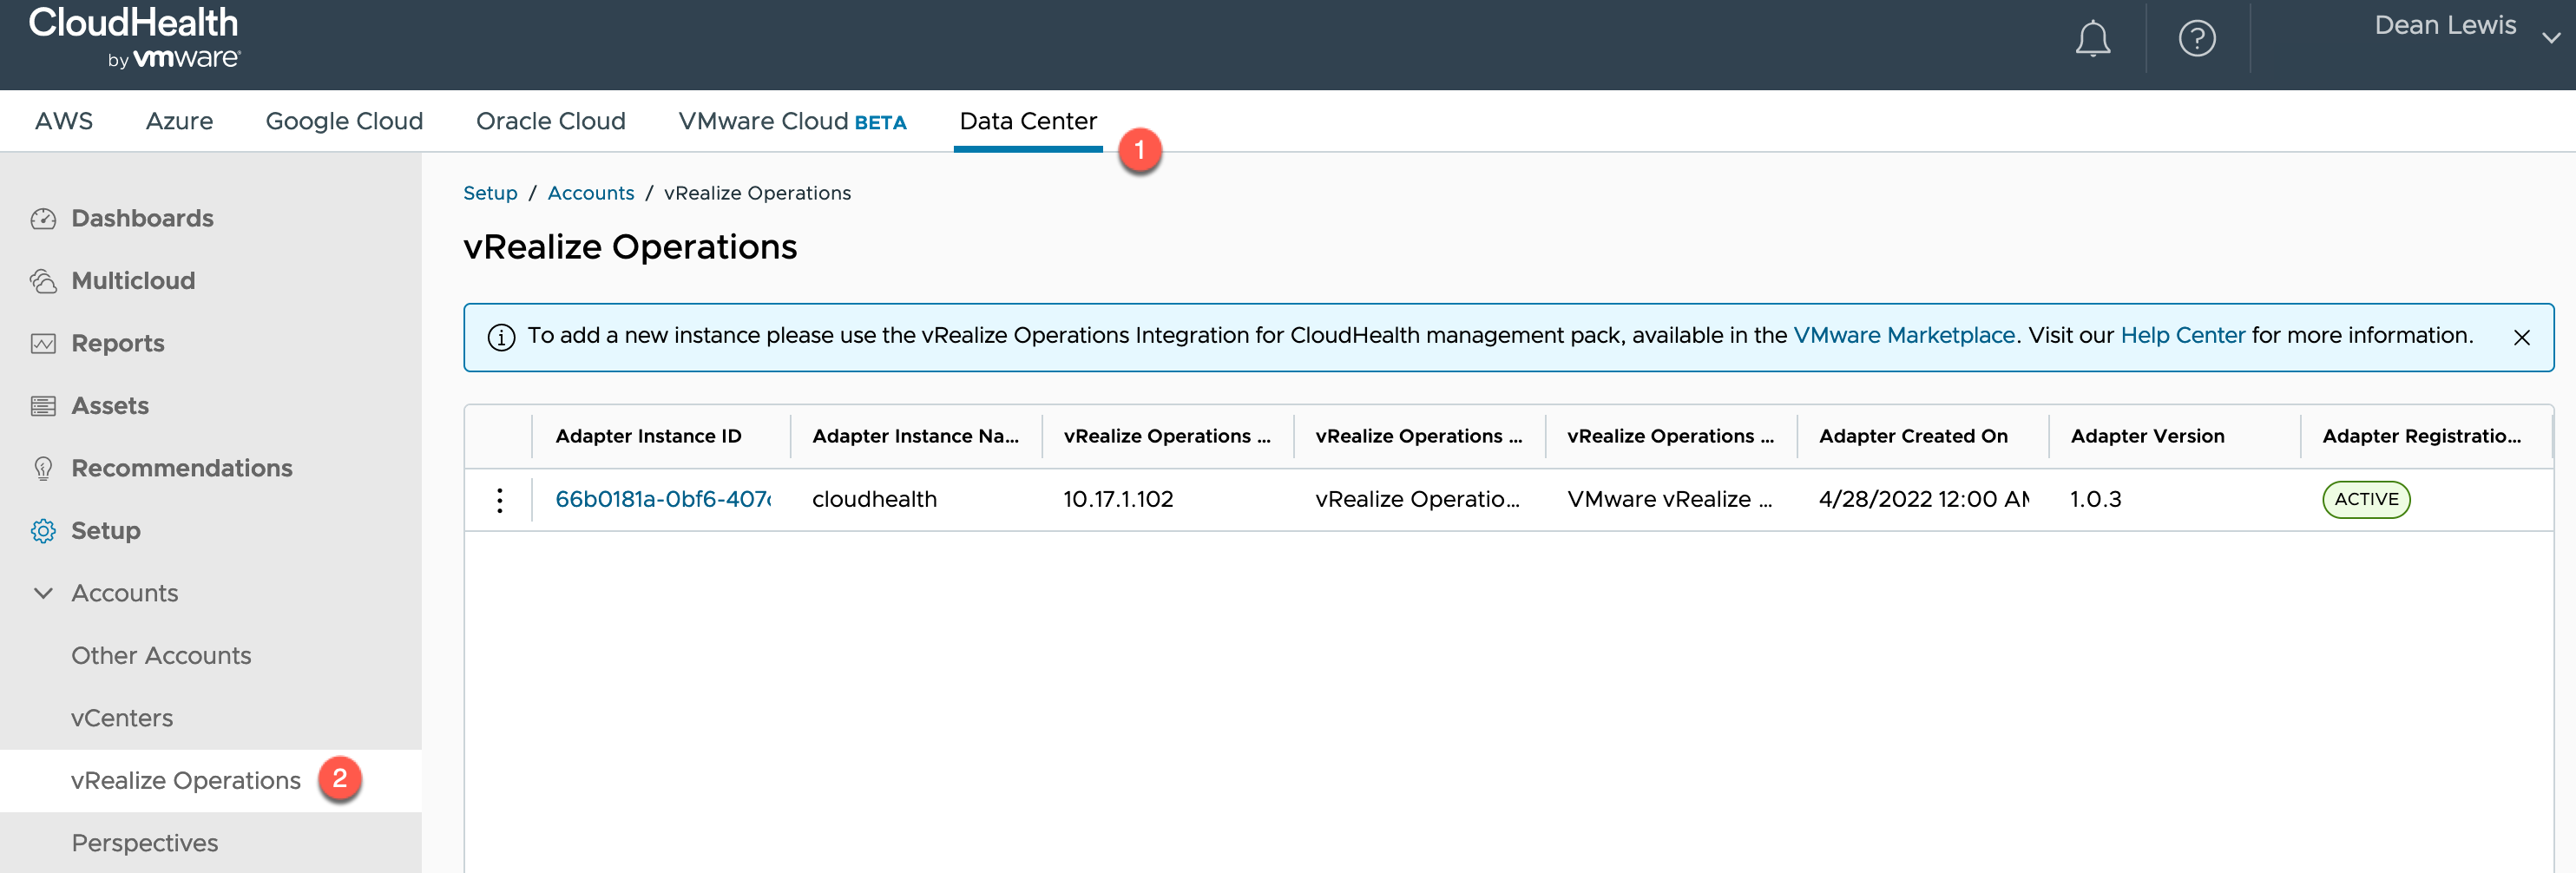
In the CloudHealth interface, when you go to the vRealize Operations Accounts page under setup, you’ll see that this page points you to the documentation and the VMware Marketplace. As this configuration is initiated by the vRealize Operations Management Pack.
- Data Center Tab > Setup > Accounts > vRealize Operations
Download the Management Pack
Start by downloading the management pack from the VMware Marketplace.
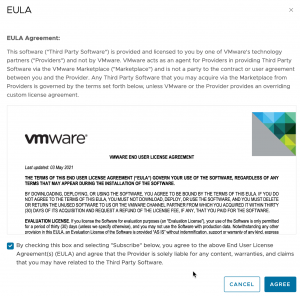
- Accept the EULA
Your download will start.
Generating a CloudHealth API Key
We need to generate an API key from our CloudHealth account, that will be used by vROPs to send data to CloudHealth. These APIs are generated against your account.
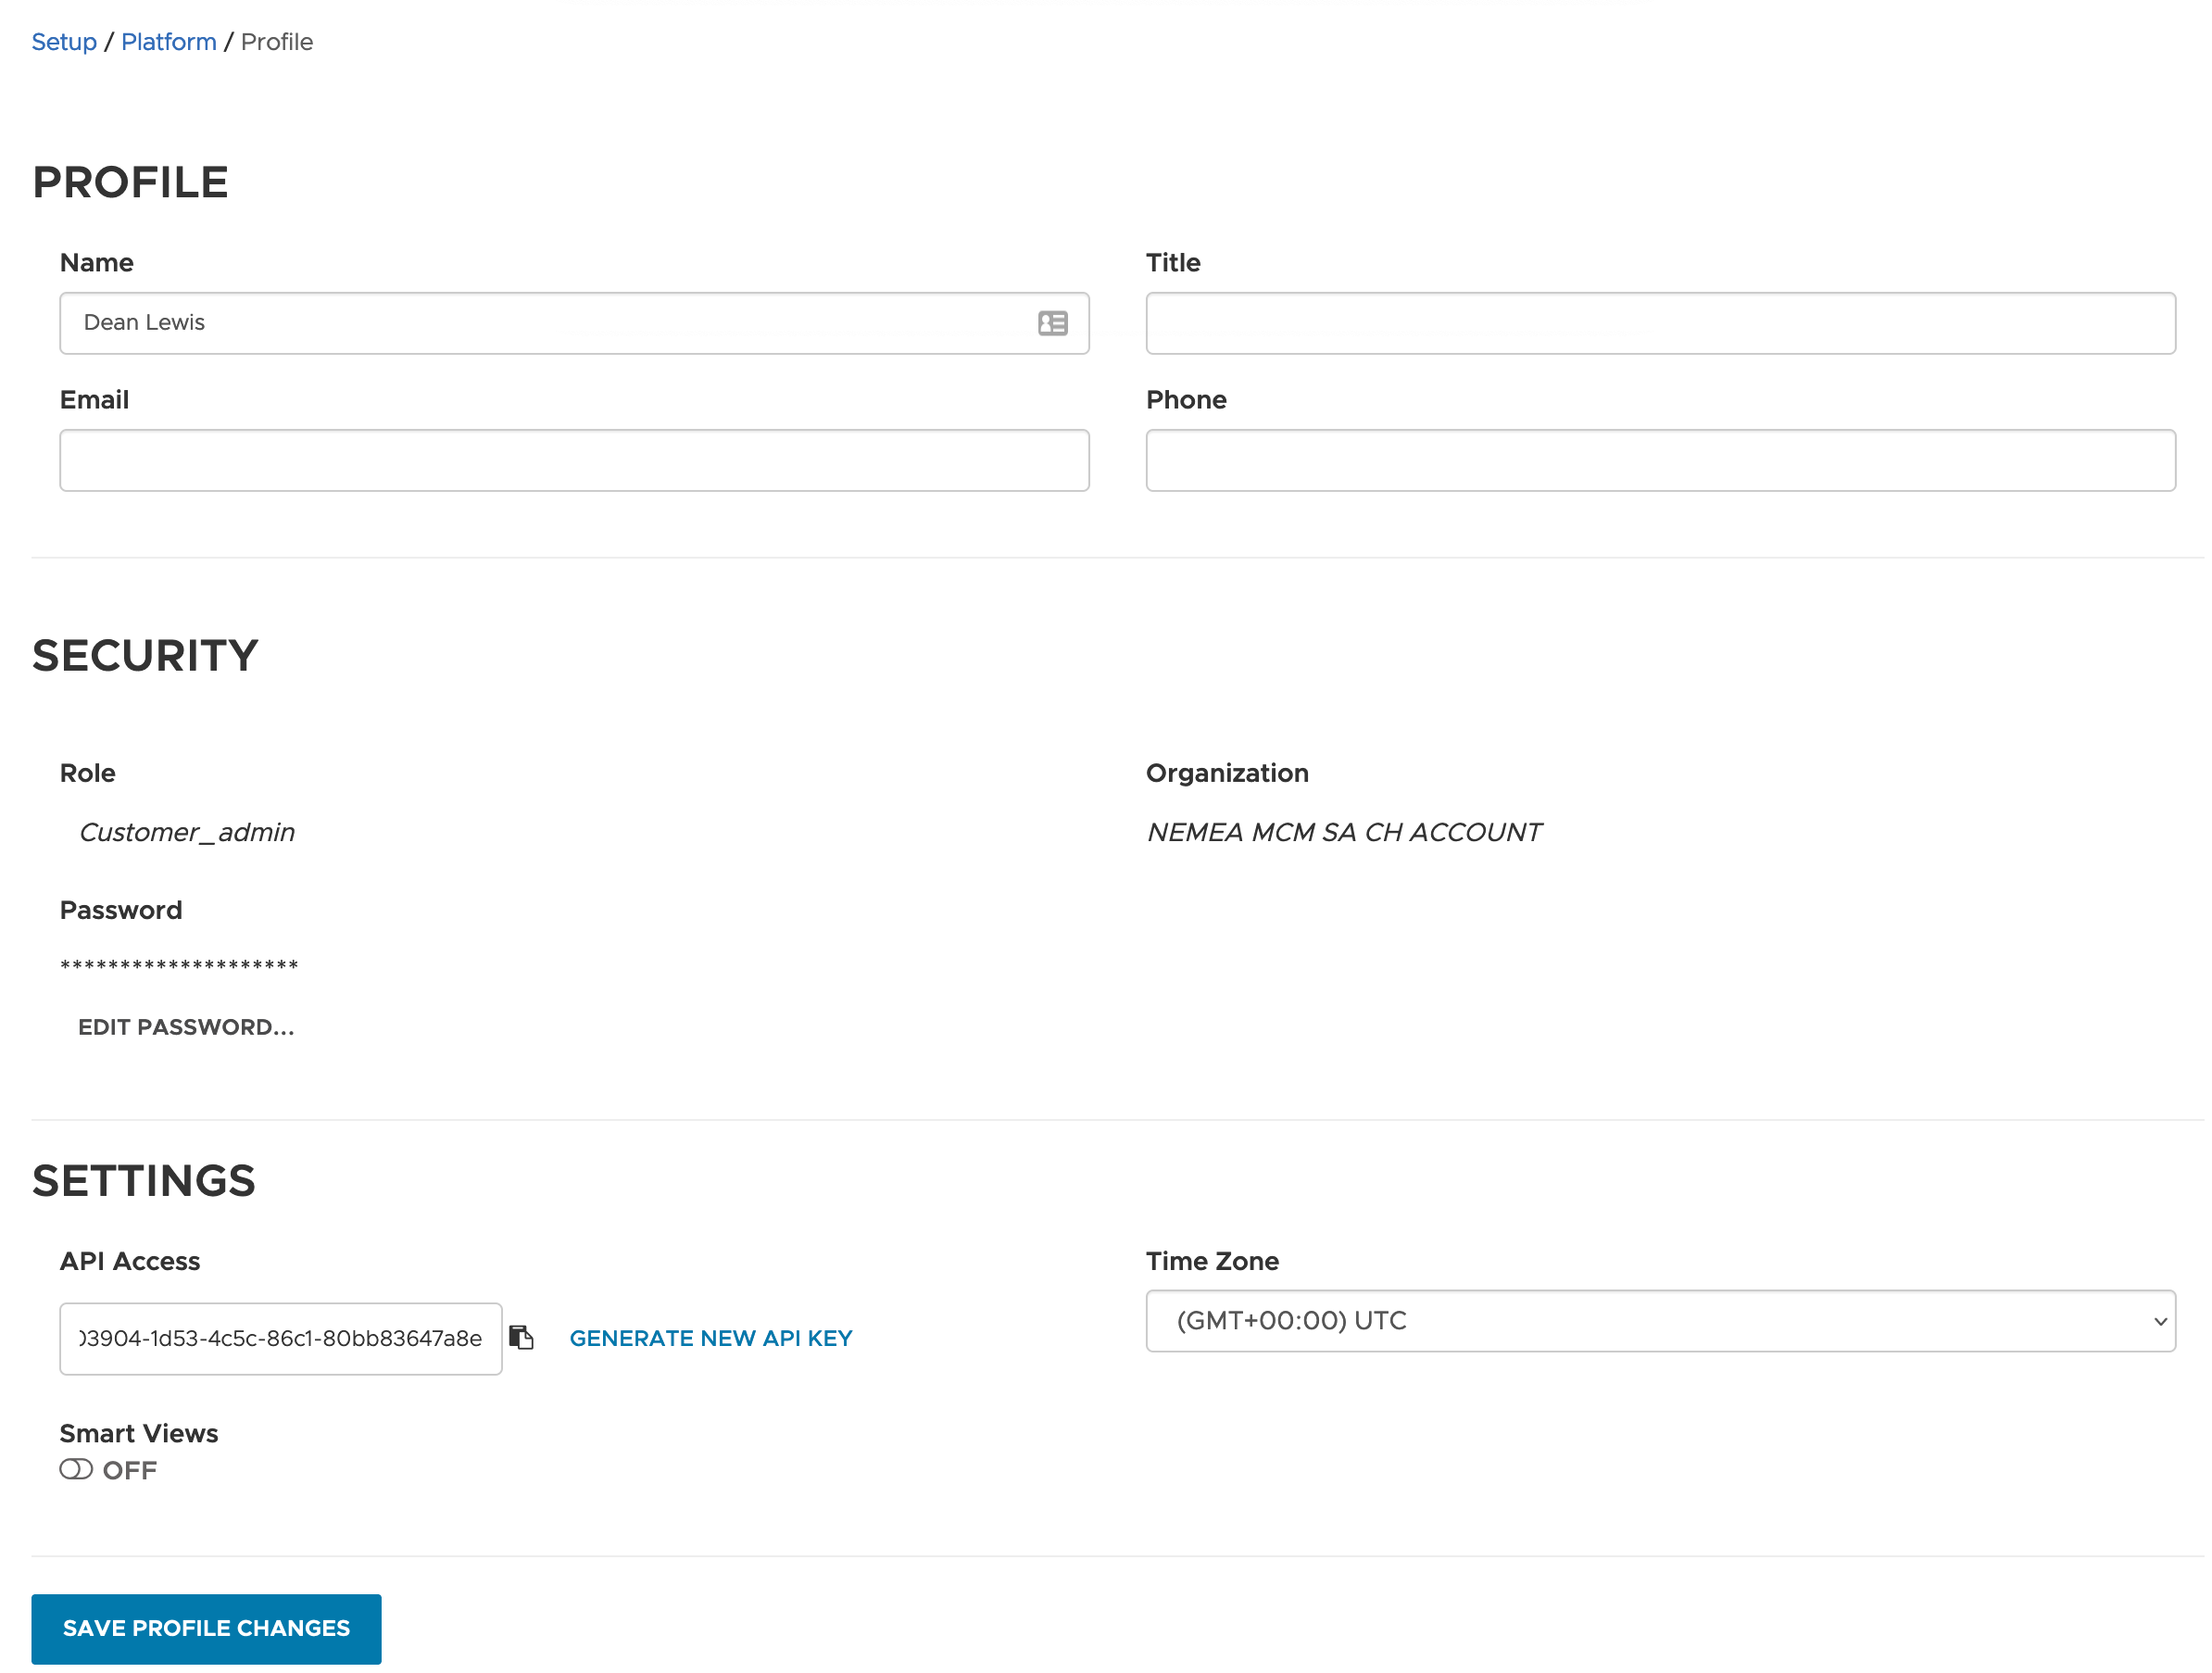
- Log into your CloudHealth Account.
- Click your username in the top right-hand corner
- Click your username on the navigation pane that appears
- At the bottom of your profile information, copy the API Access Key for later use
- by default an API key will not be present, they can generate one (or a new key) by clicking Generate New API Key
Install the Management Pack in vRealize Operations
Log into your vRealize Operations environment.
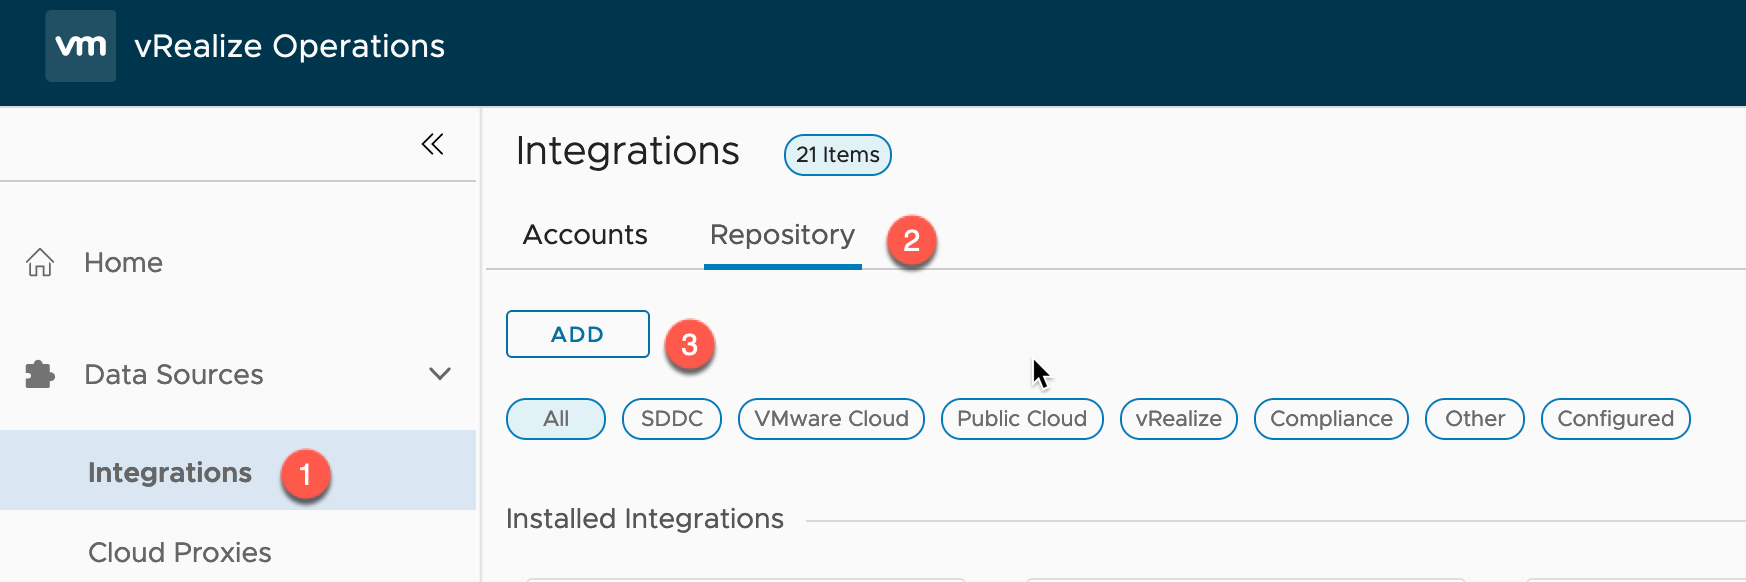
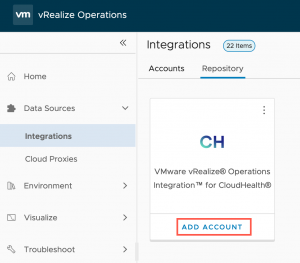
- Click on Integrations
- Click the Repository Tab
- Click Add
- Browse to the Management Pack files location
- Select to Upload
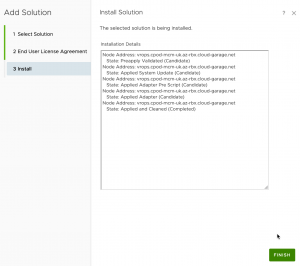
- Once the upload is complete, click next.
- Accept the EULA and click next
- Click finish once the install is complete
Configure the CloudHealth Account for the Management Pack
Now let’s configure out CloudHealth Management Pack.
- Click on Data Sources > Integrations, on the left-hand navigation pane.
- Click to Add Account for the CloudHealth integration tile.
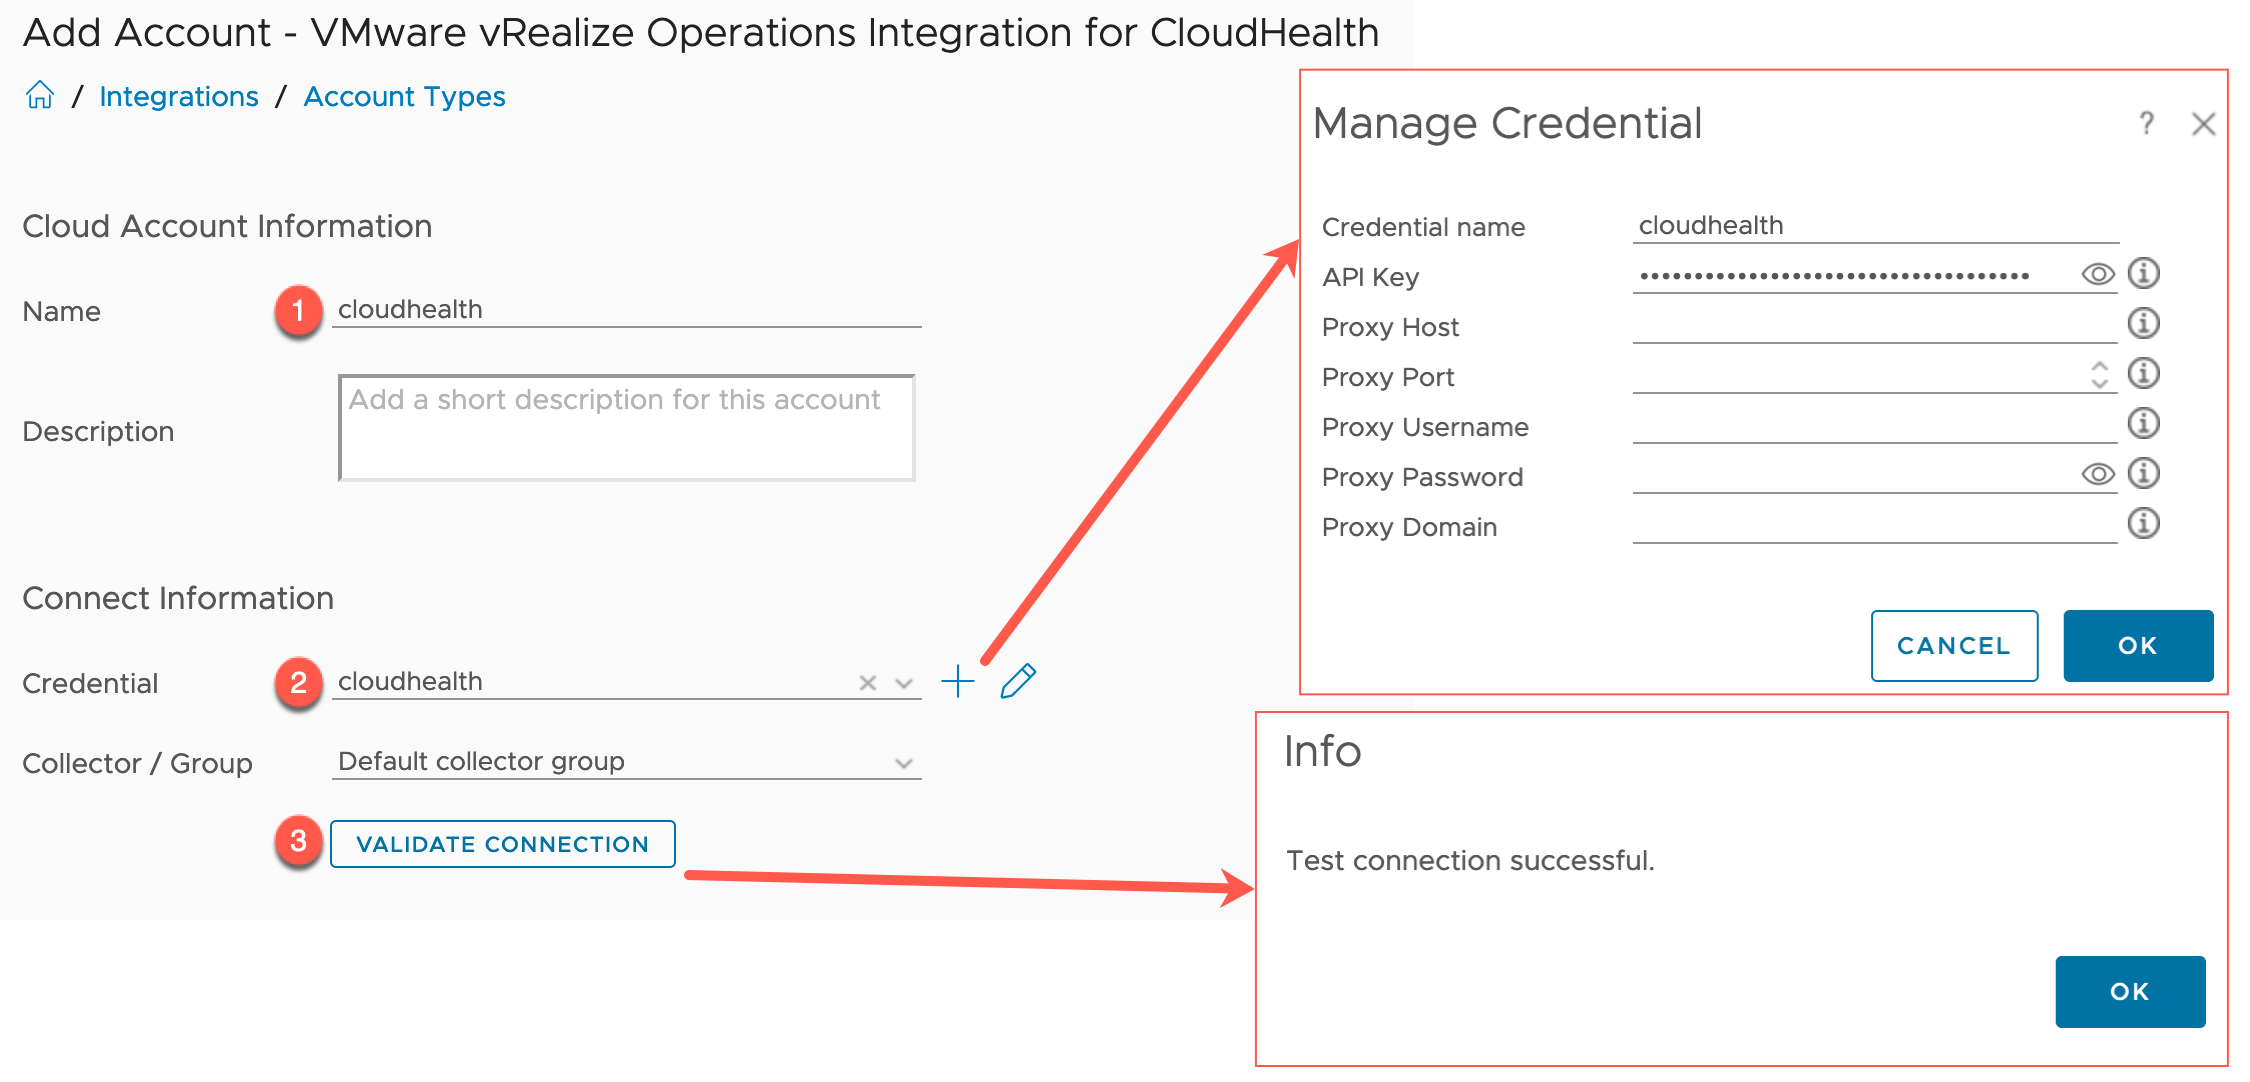
- Provide a name for this integration
- Click the + button to create a new credential
- Provide a credential name
- Provide the API Key
- Provide any Proxy settings as necessary
- Select the newly created credential
- Select which collector/group to use for the connectivity.
- Select to validate the connection
- Click save on the integration
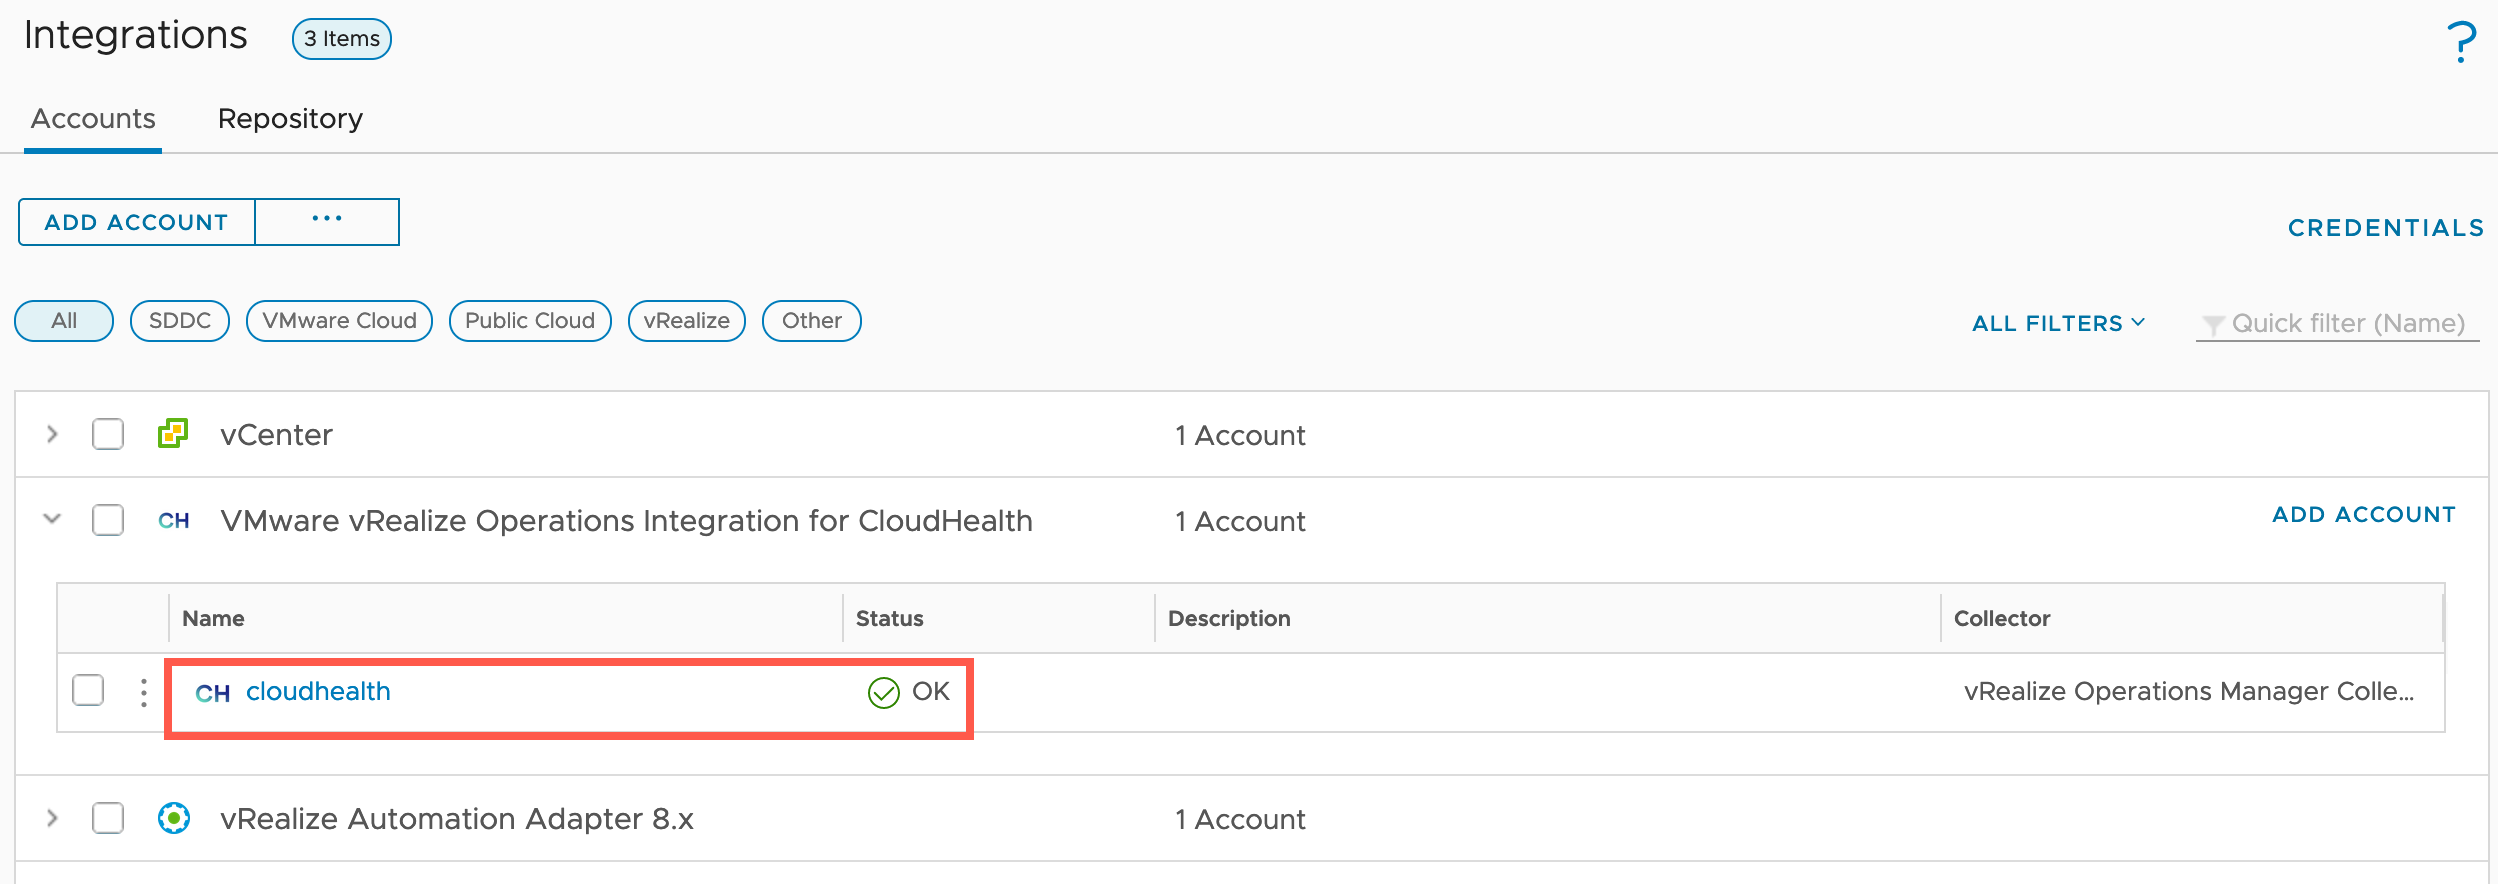
After a few minutes, if the Management Pack adapter can successfully connect to CloudHealth, you’ll see a green tick.
Validate the integration status in CloudHealth
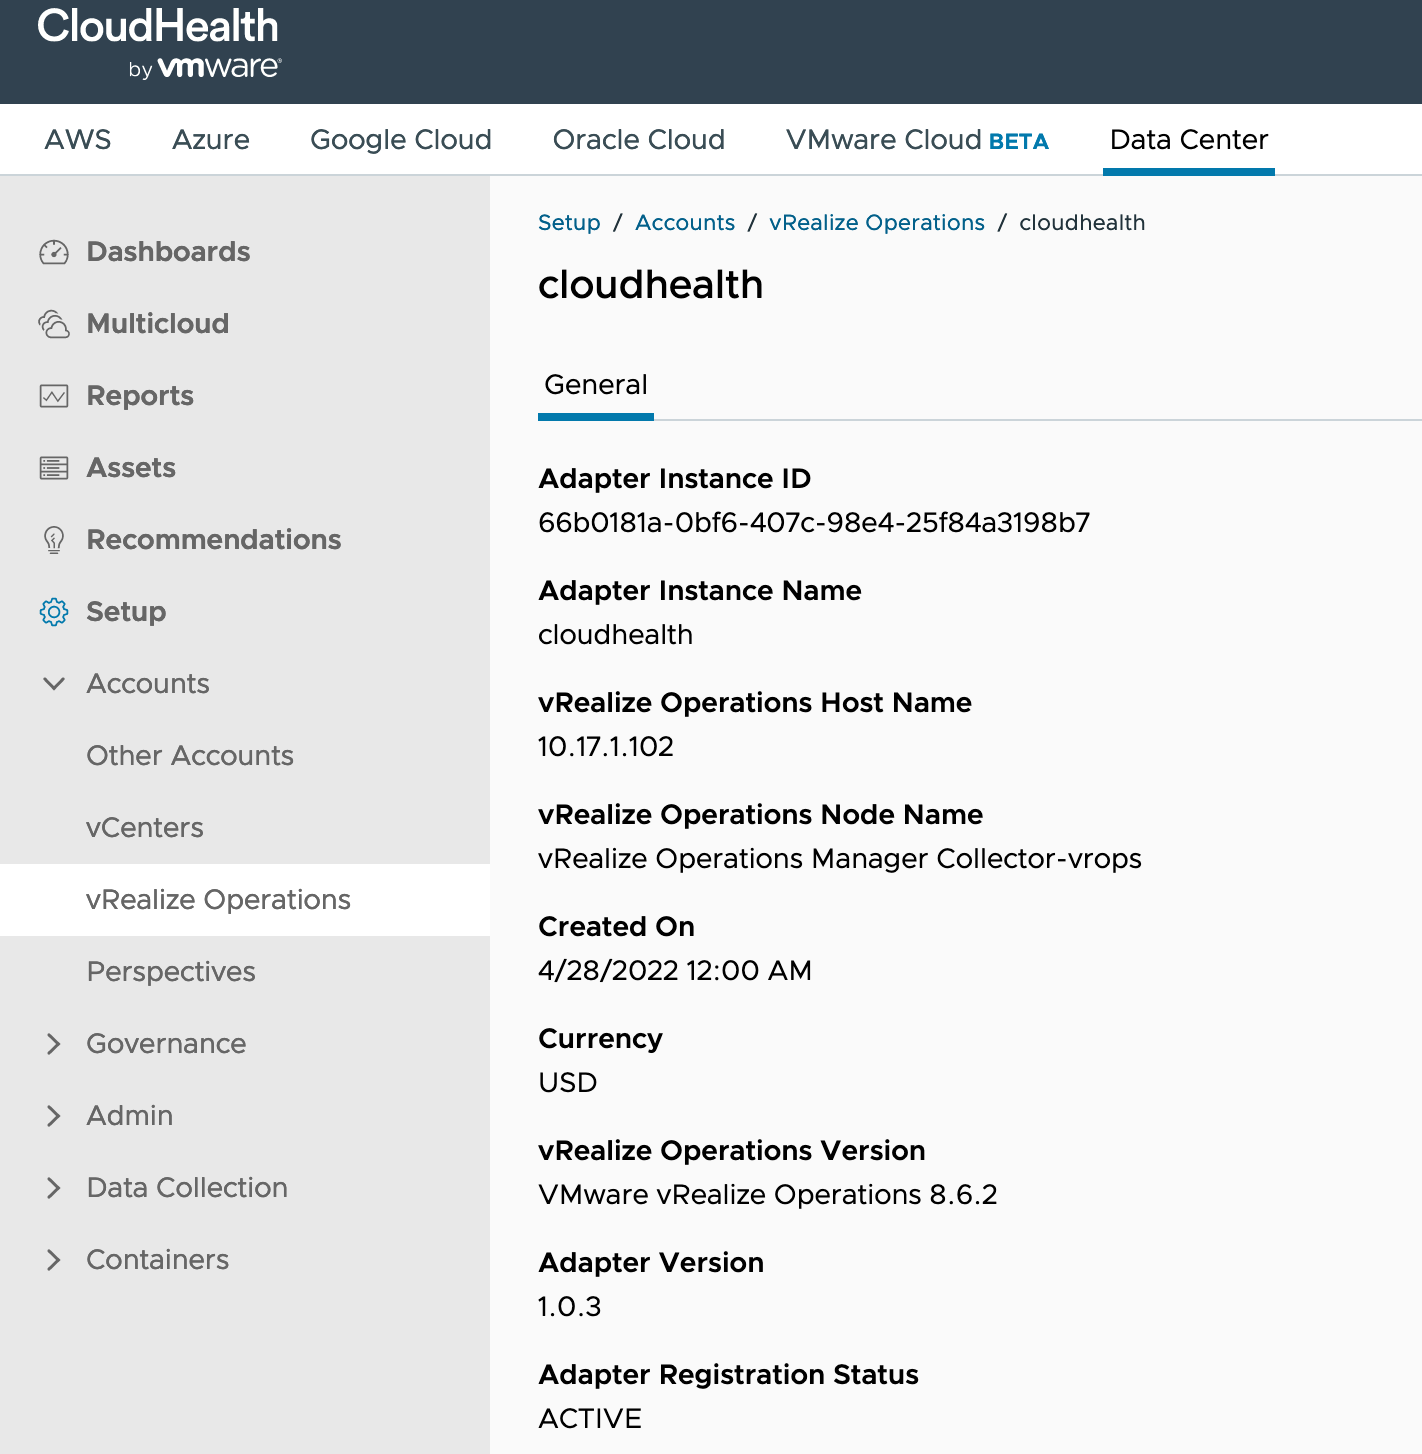
Moving back to the CloudHealth interface, you will now see an adapter instance populated under the vRealize Operations account screen.
It will take around 24 hours for the first full sync to take place from your vRealize Operations environment, to populate CloudHealth with data. Then like data collection for costing for your public cloud environments, your Data Center costing will be updated on a daily basis.
Clicking on this Instance ID will give you more details about the integrated vRealize Operations environment.
Viewing the CloudHealth Data Center data
Now that our instance is configured and we have exceeded the minimum waiting time of 24 hours for the initial sync, we’ll can now start to see data populating in CloudHeath from vROPs.
In this section of the blog, I am going to cover at a high level some of the areas within CloudHealth to visualise the data.
Creating a Perspective
Before we dive into some of those views and reports, I want to highlight the ability to create a perspective.
- CloudHealth Perspectives are “lenses” through which you want to view your infrastructure. They provide a framework for categorizing all the assets within your infrastructure. Sample perspectives might include Environment, Application, Department, Function, Project, or Cost Center.
To create a perspective, go to:
- Accounts > Perspectives
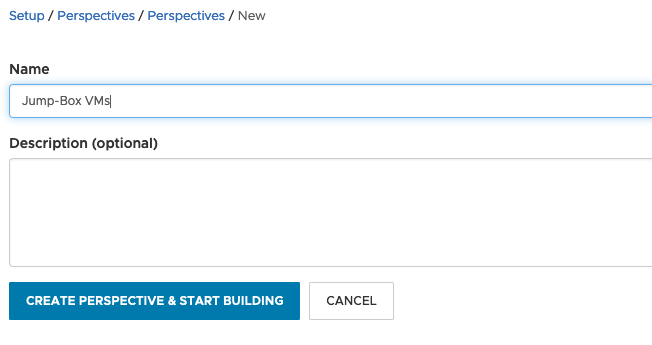
- Click New Perspective
- Provide a name
- Provide a description
Click Create Perspective.
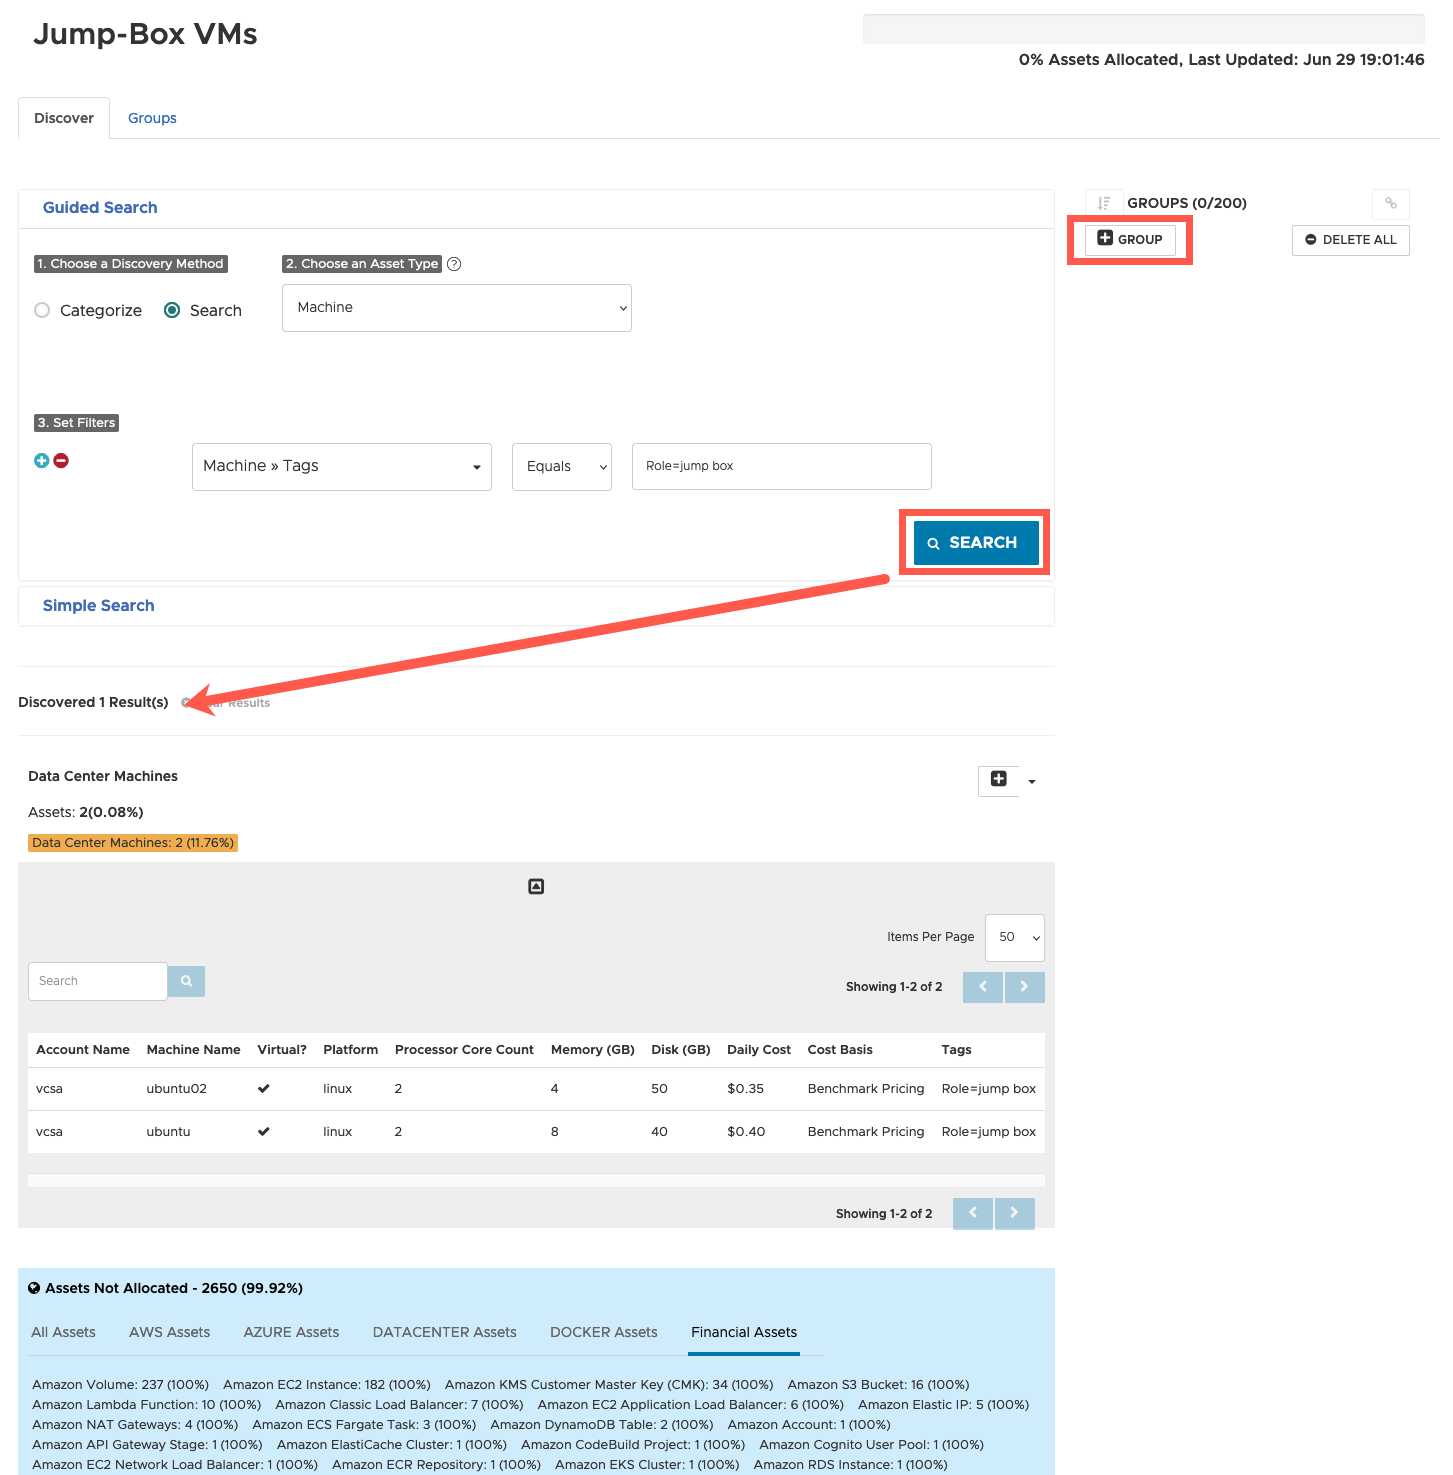
This first example shows how to configure a static perspective, which will not update with any new objects that meet your criteria in the future. Therefore, it is recommended to great a dynamic perspective, which I’ll show next.
In this dialog box, you have several filters available to build up how to identify the resources which will be part of your perspective. In the example below, I’m creating a filter to identify vSphere virtual machines that are configured with the vSphere tag “Role= jump-box”.
Once the filter is built, click Search. This will return any resources that match the filter. Once you are happy with the returned results, click the “+Groups” button, to save the filter.
Exiting back to the perspective view, you will see the newly created perspective. This will show a red circle symbol, to indicate that this perspective is not yet available for use within reports.
Perspectives are activated during the nightly sync period. After this, the icon will turn to a green tick symbol.
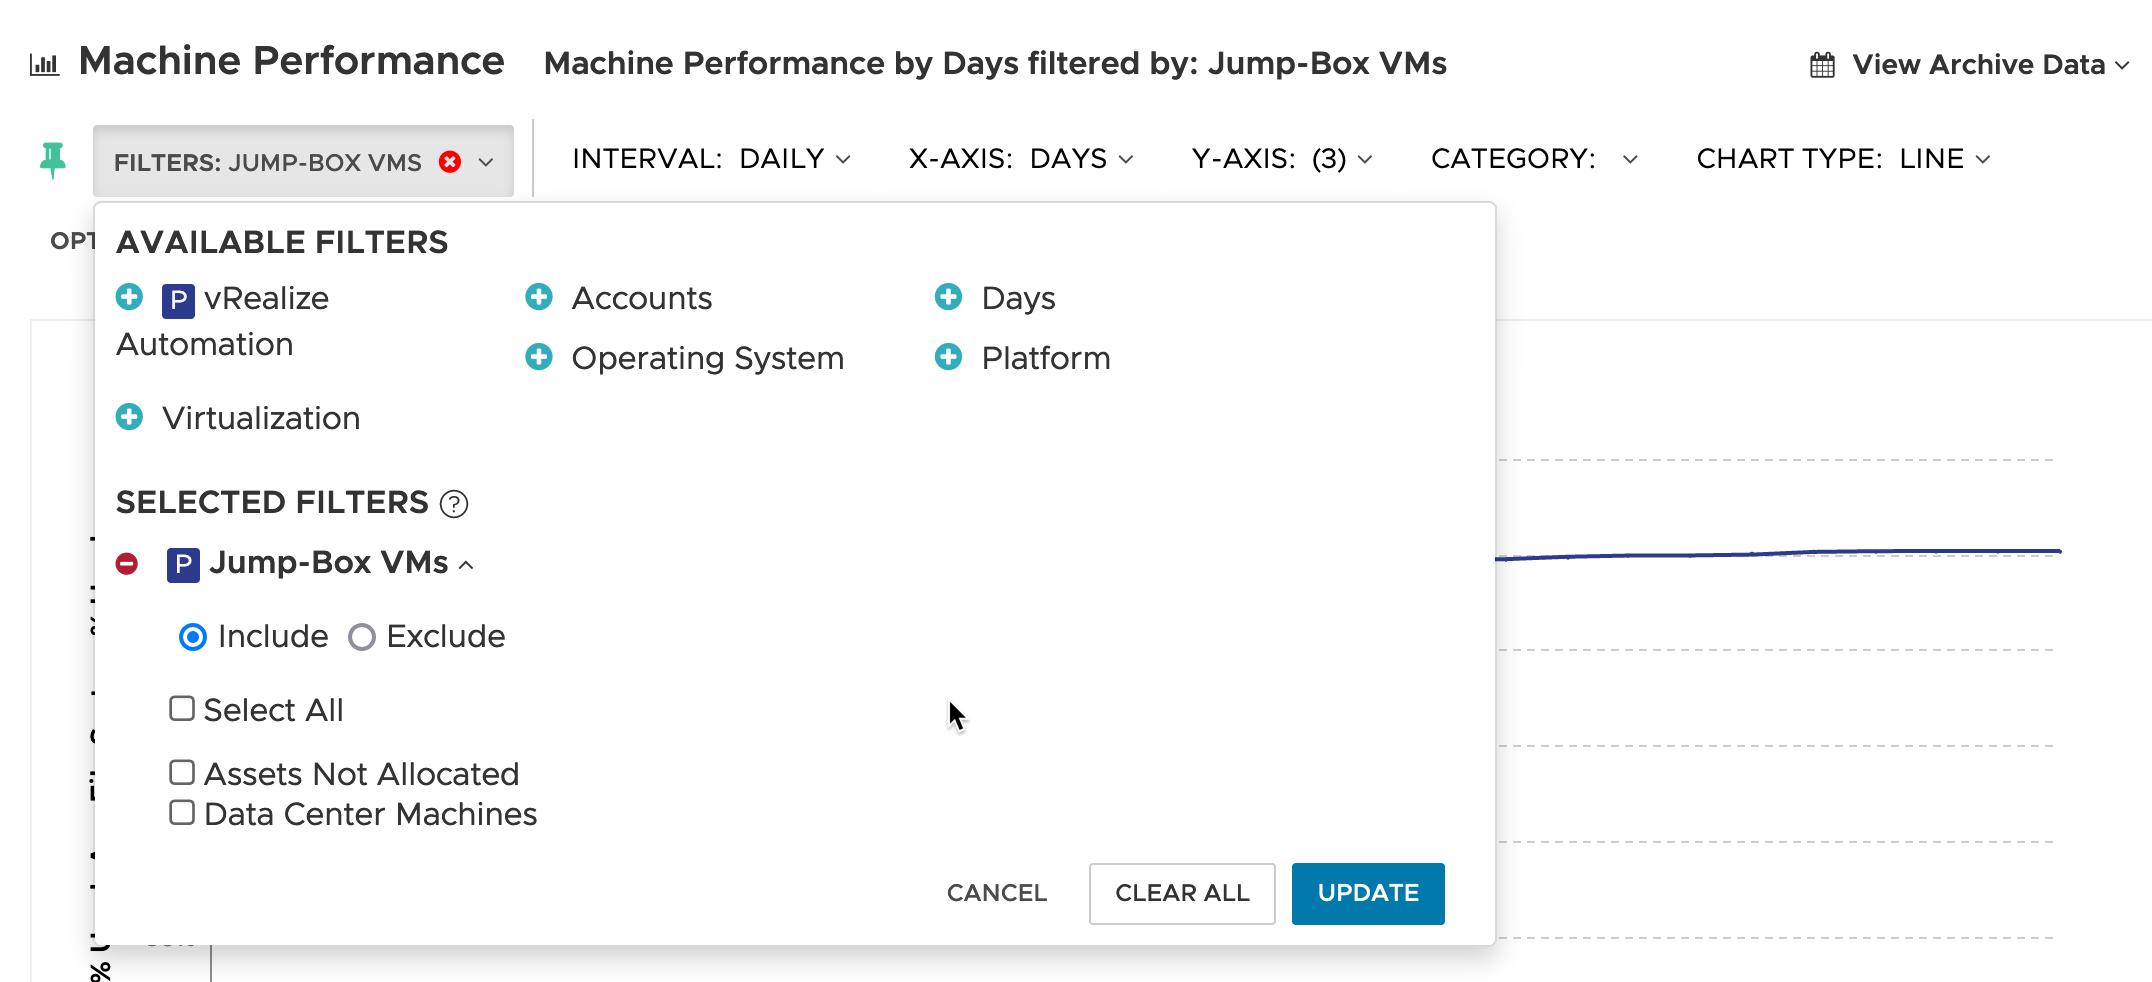
Once the perspective is showing a green tick, when visualising any reports, you’ll be able to select this as an available filter.
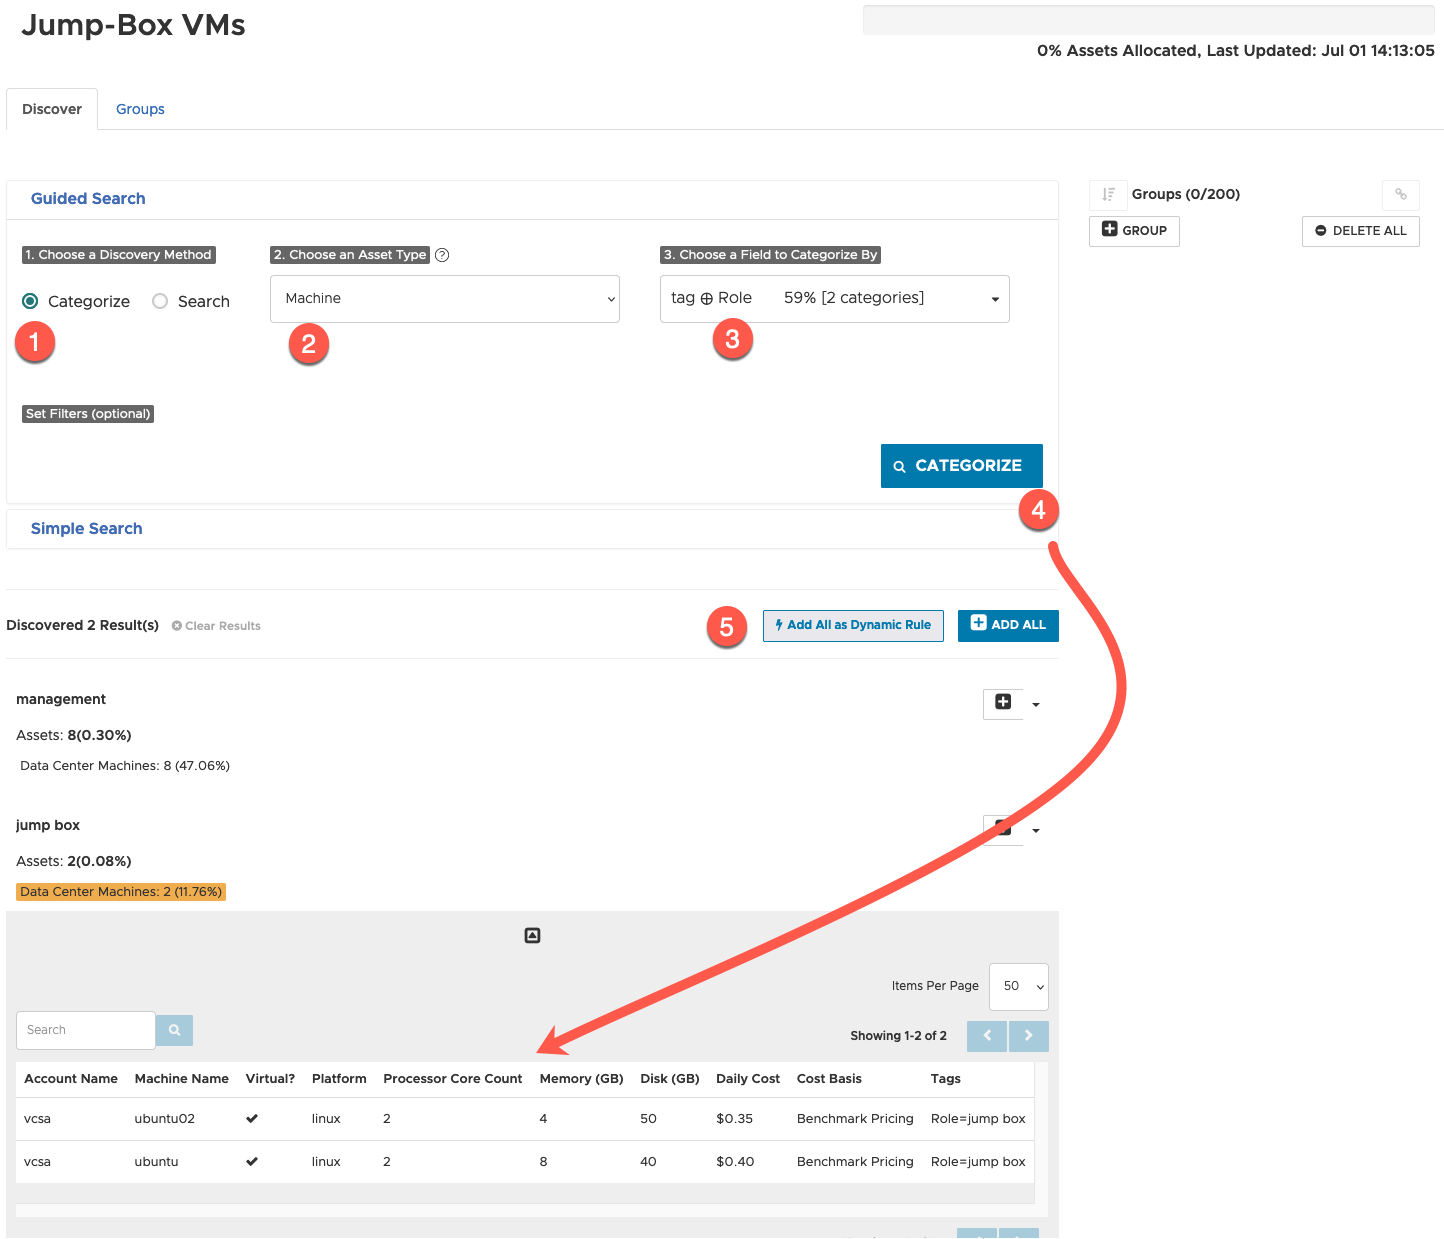
Now to create a dynamic perspective, which will update the list of objects based on your criteria, so in the future, if there is a new VM added to the environment with a vSphere tag, this will be added to the perspective, and become part of any report filters.
- Select Categorize
- Choose the asset type
- Choose the field to catogize your assets against
- In this example, we are using the vSphere tags
- Click Catagorize
This will now show you which Catagories are available, for example, the two vSphere Tag Categories, which can be expanded to show the assets grouped within them.
- Click “Add all in Dynamic Rule” button
Provide a Dynamic Group name, and choose a colour to represent the groups in a block. (for easier identification as you built more complex perspectives). Click “Add Dynamic Group”.
On the right-hand side you’ll now see the group is created, and the lightning symbol indicates that this is a dynamic group.
Dashboards
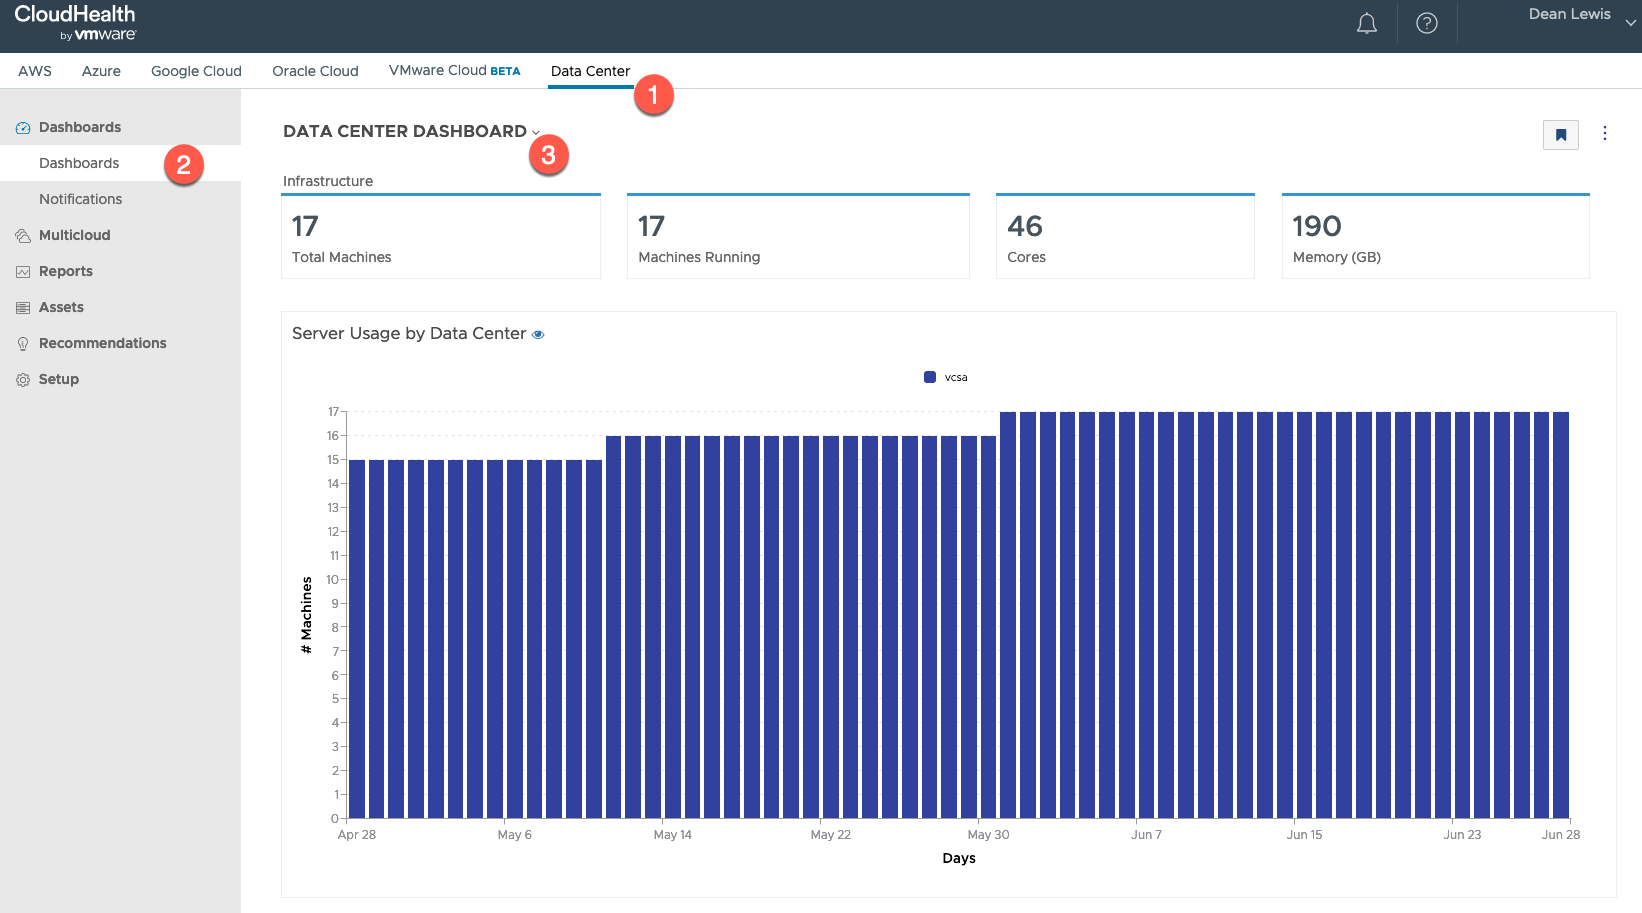
The dashboards’ view is the default when viewing the Data Center tab in CloudHealth. Out of the box, there is only one available dashboard in this view, which shows a count for the number of monitored virtual machines.
Clicking into the Dashboard list will confirm only a single dashboard is available. You can create further dashboards, select the filters and visualisations as necessary.
Multicloud Cost History
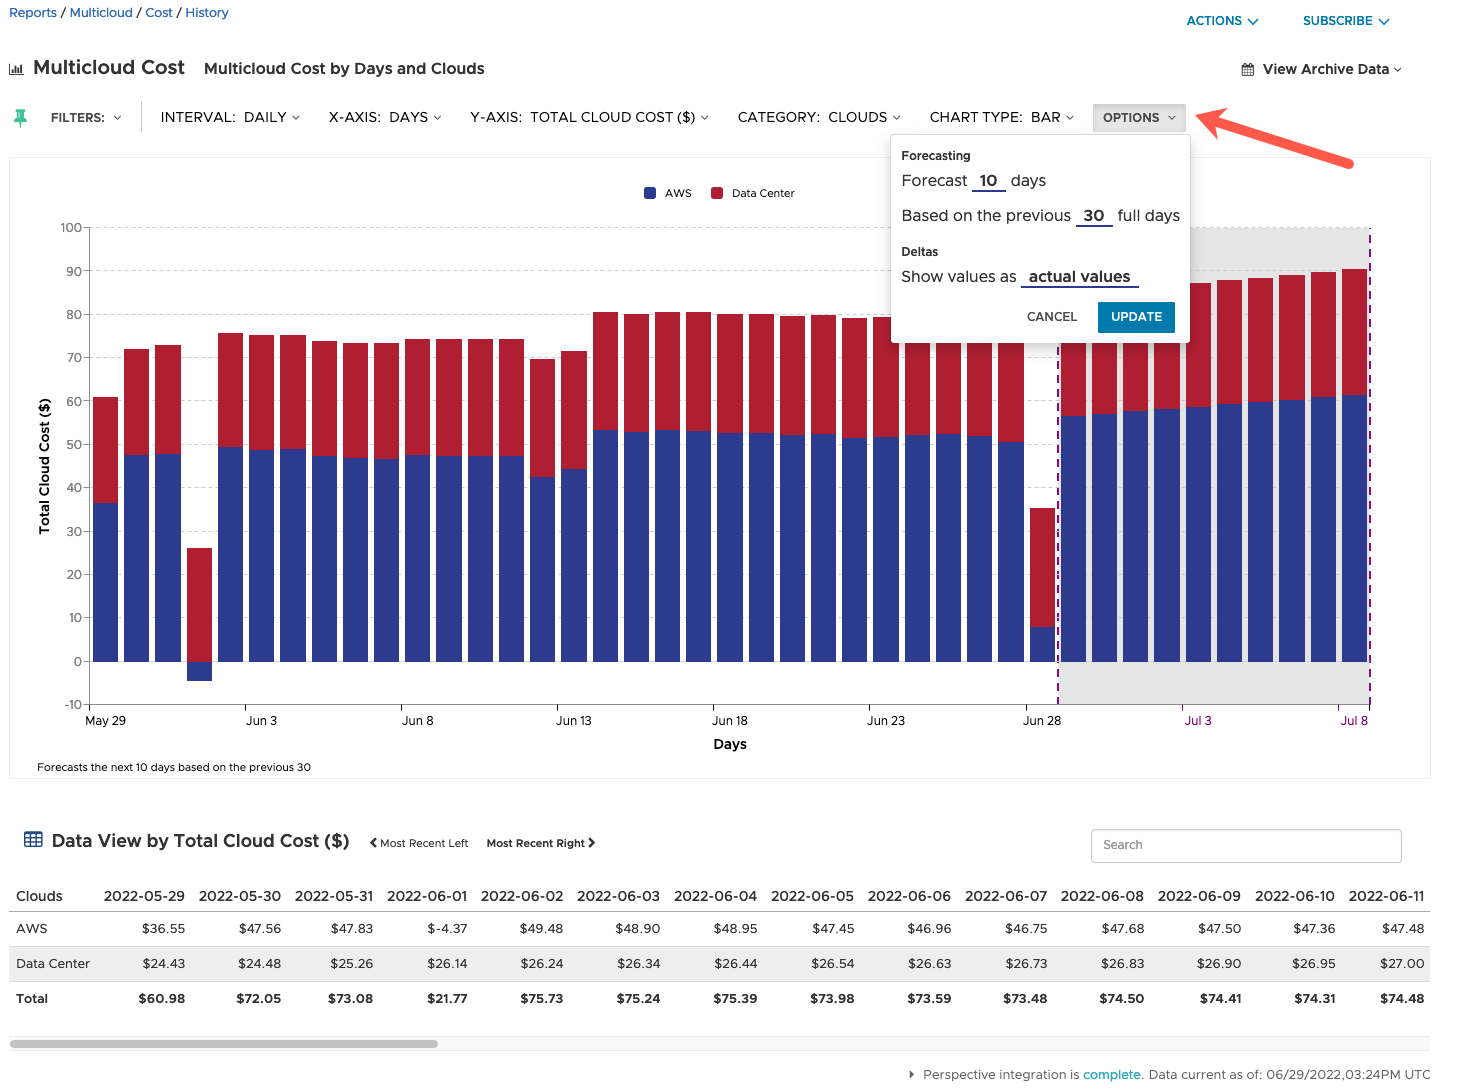
Under the Multicloud tab on the left-hand navigation, there is only one tab “Cost History”, to visualise the costs of all your monitored private and public clouds within CloudHealth.
The same filters are available throughout these different views. In the below example, I also included the feature to show forecasted costs 10 days ahead of time, which is highlighted within a grey box in the graph.
Below the graph is the table data for the view.
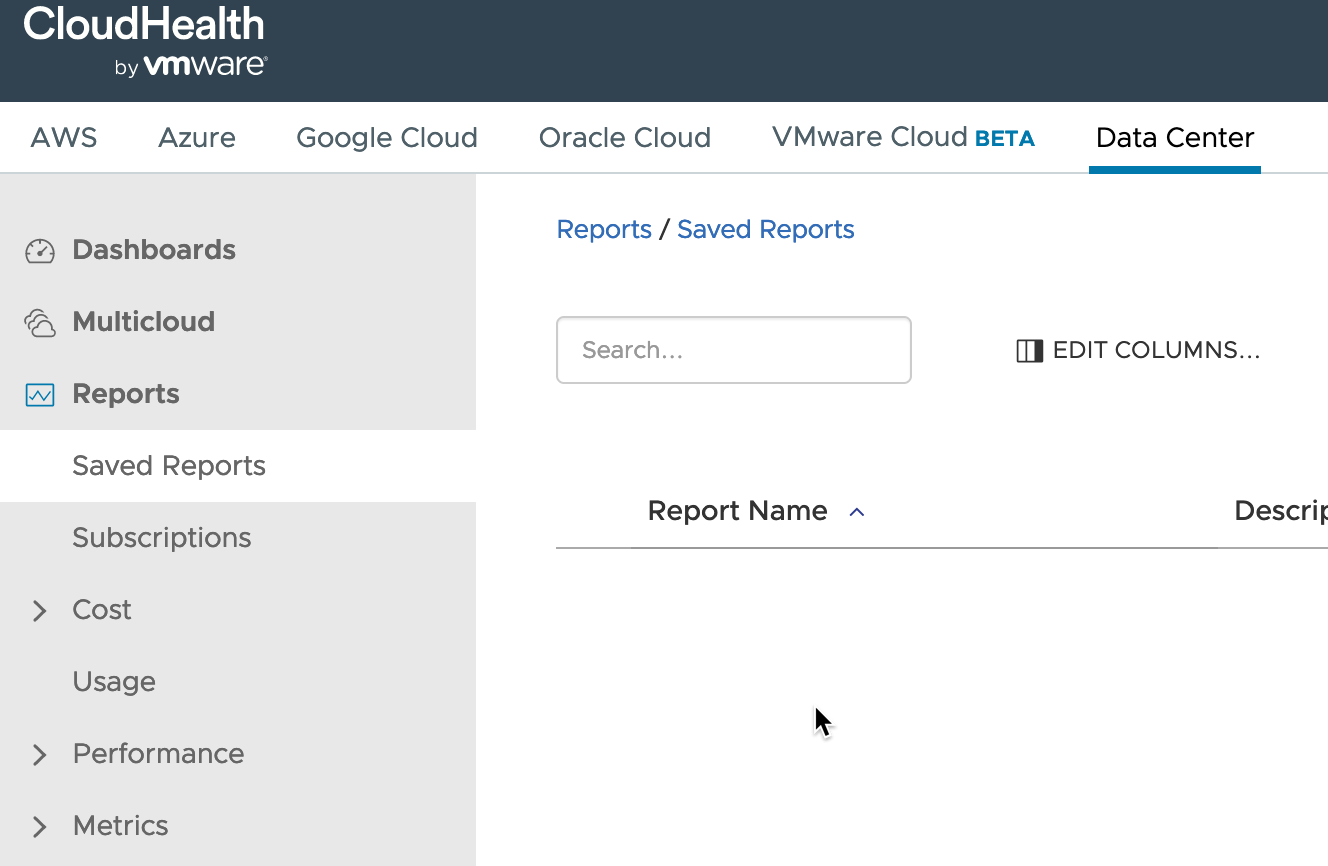
Reports
Under reports tab, you have several areas: Cost, Usage, Performance, Metrics.
You can generate your own reports or save existing ones with any user modifications.
Below is the Machine Usage report, where I’ve highlighted the configurations for the Y-Axis.
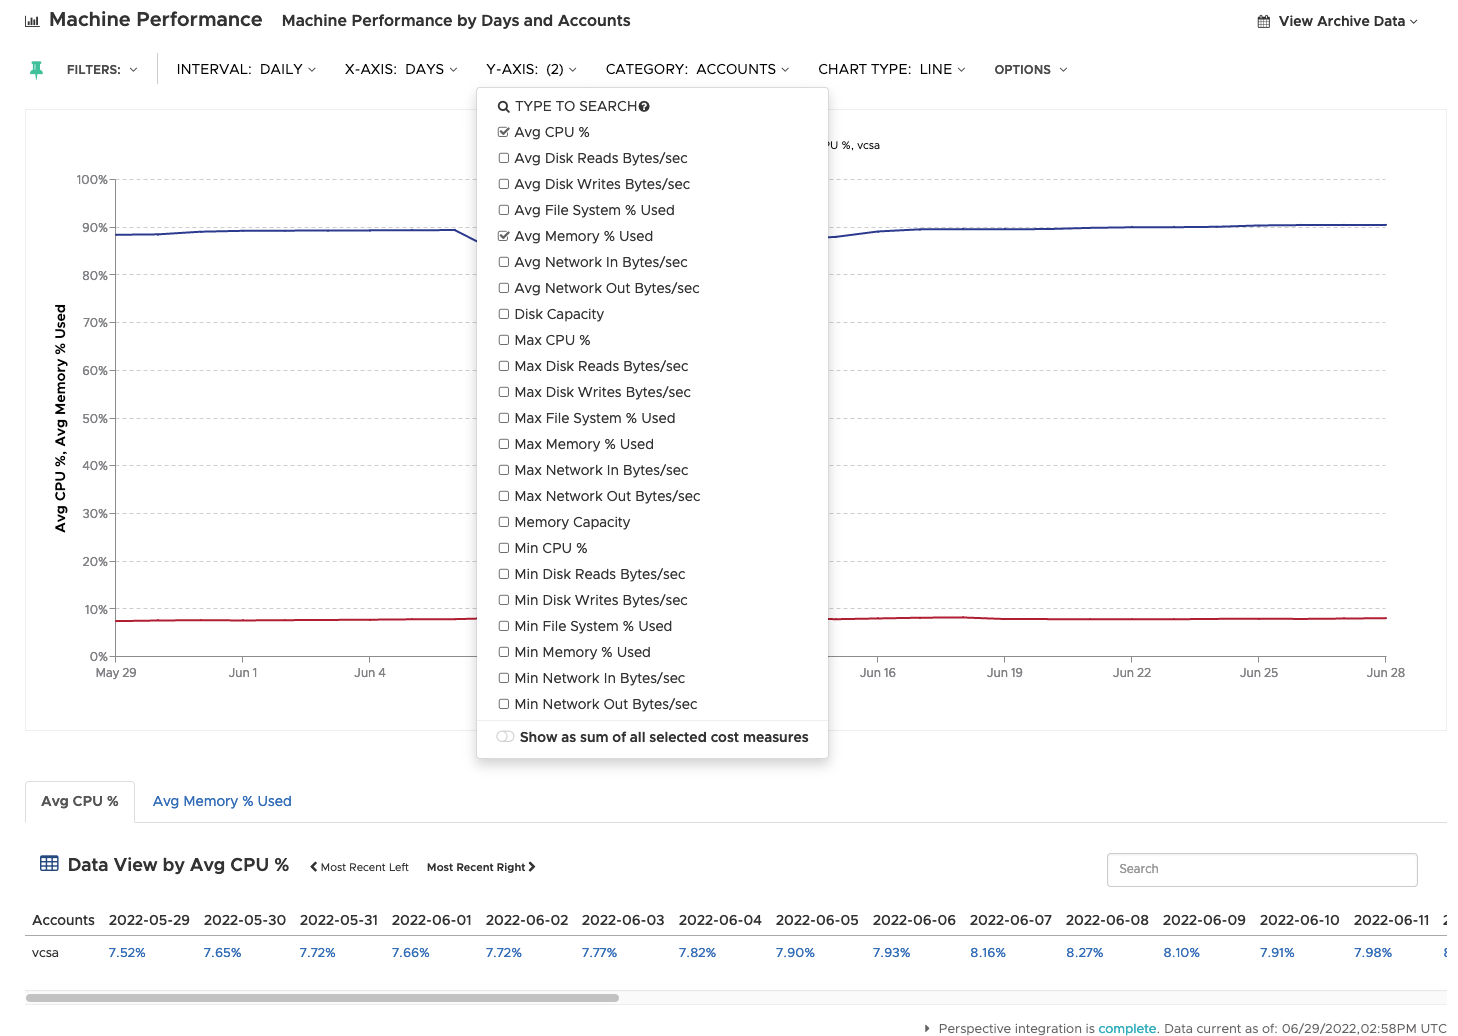
In the Machine Performance report, there are a number of metrics which can be charted out.
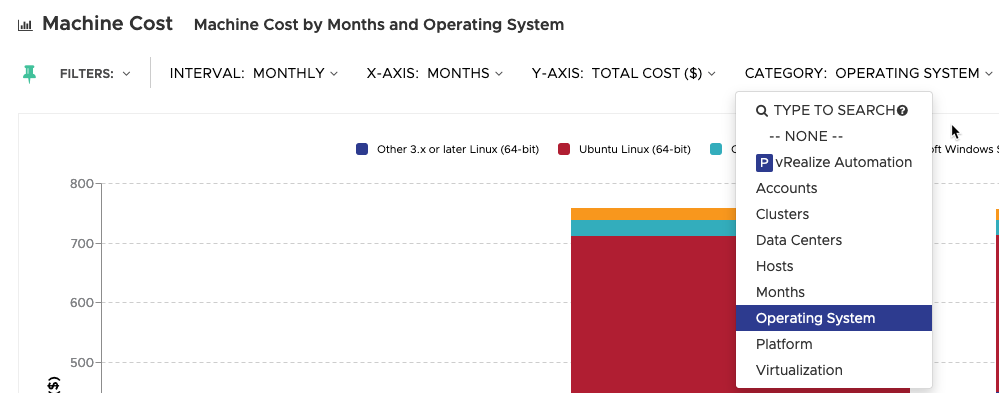
In the Machine Cost report, I’m showing the categories available to group together items on the bar chart.
Each of this configuration items on the reports, are available across all reports.
Assets
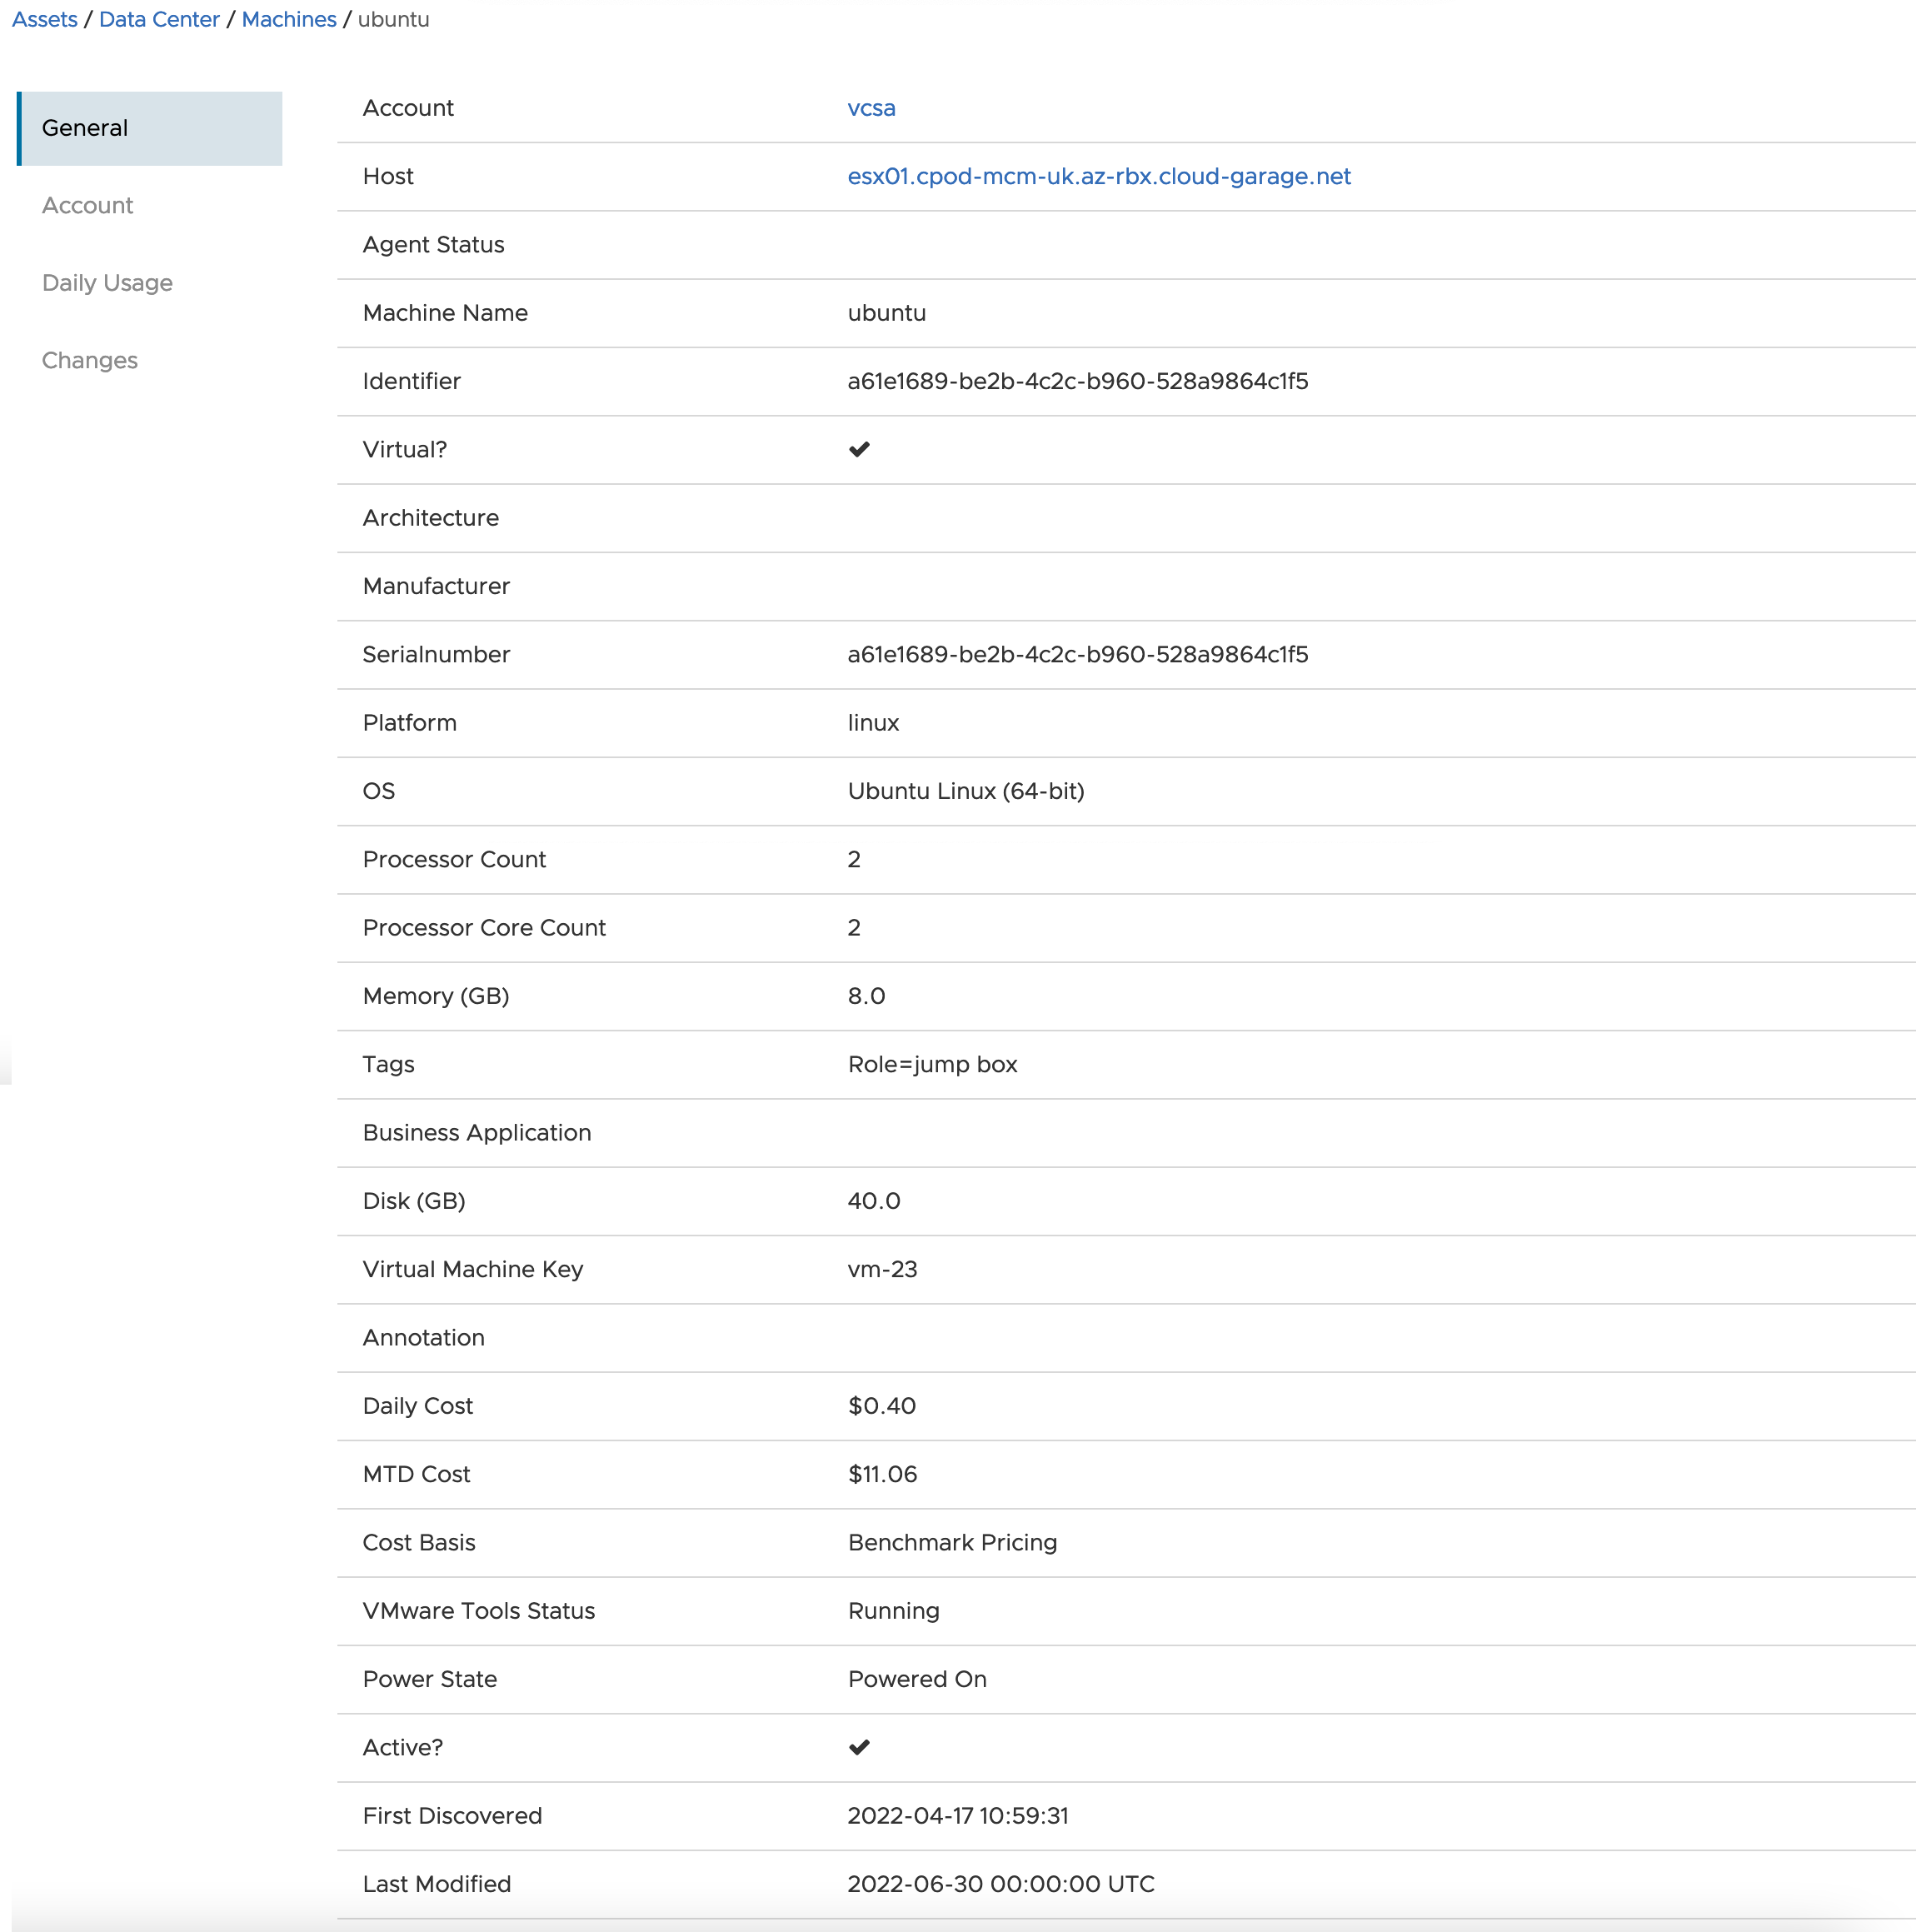
The Assets tab gives individual Resource object information. As we are interested mainly in Virtual machines, this is the view I am showing below in the screenshot.
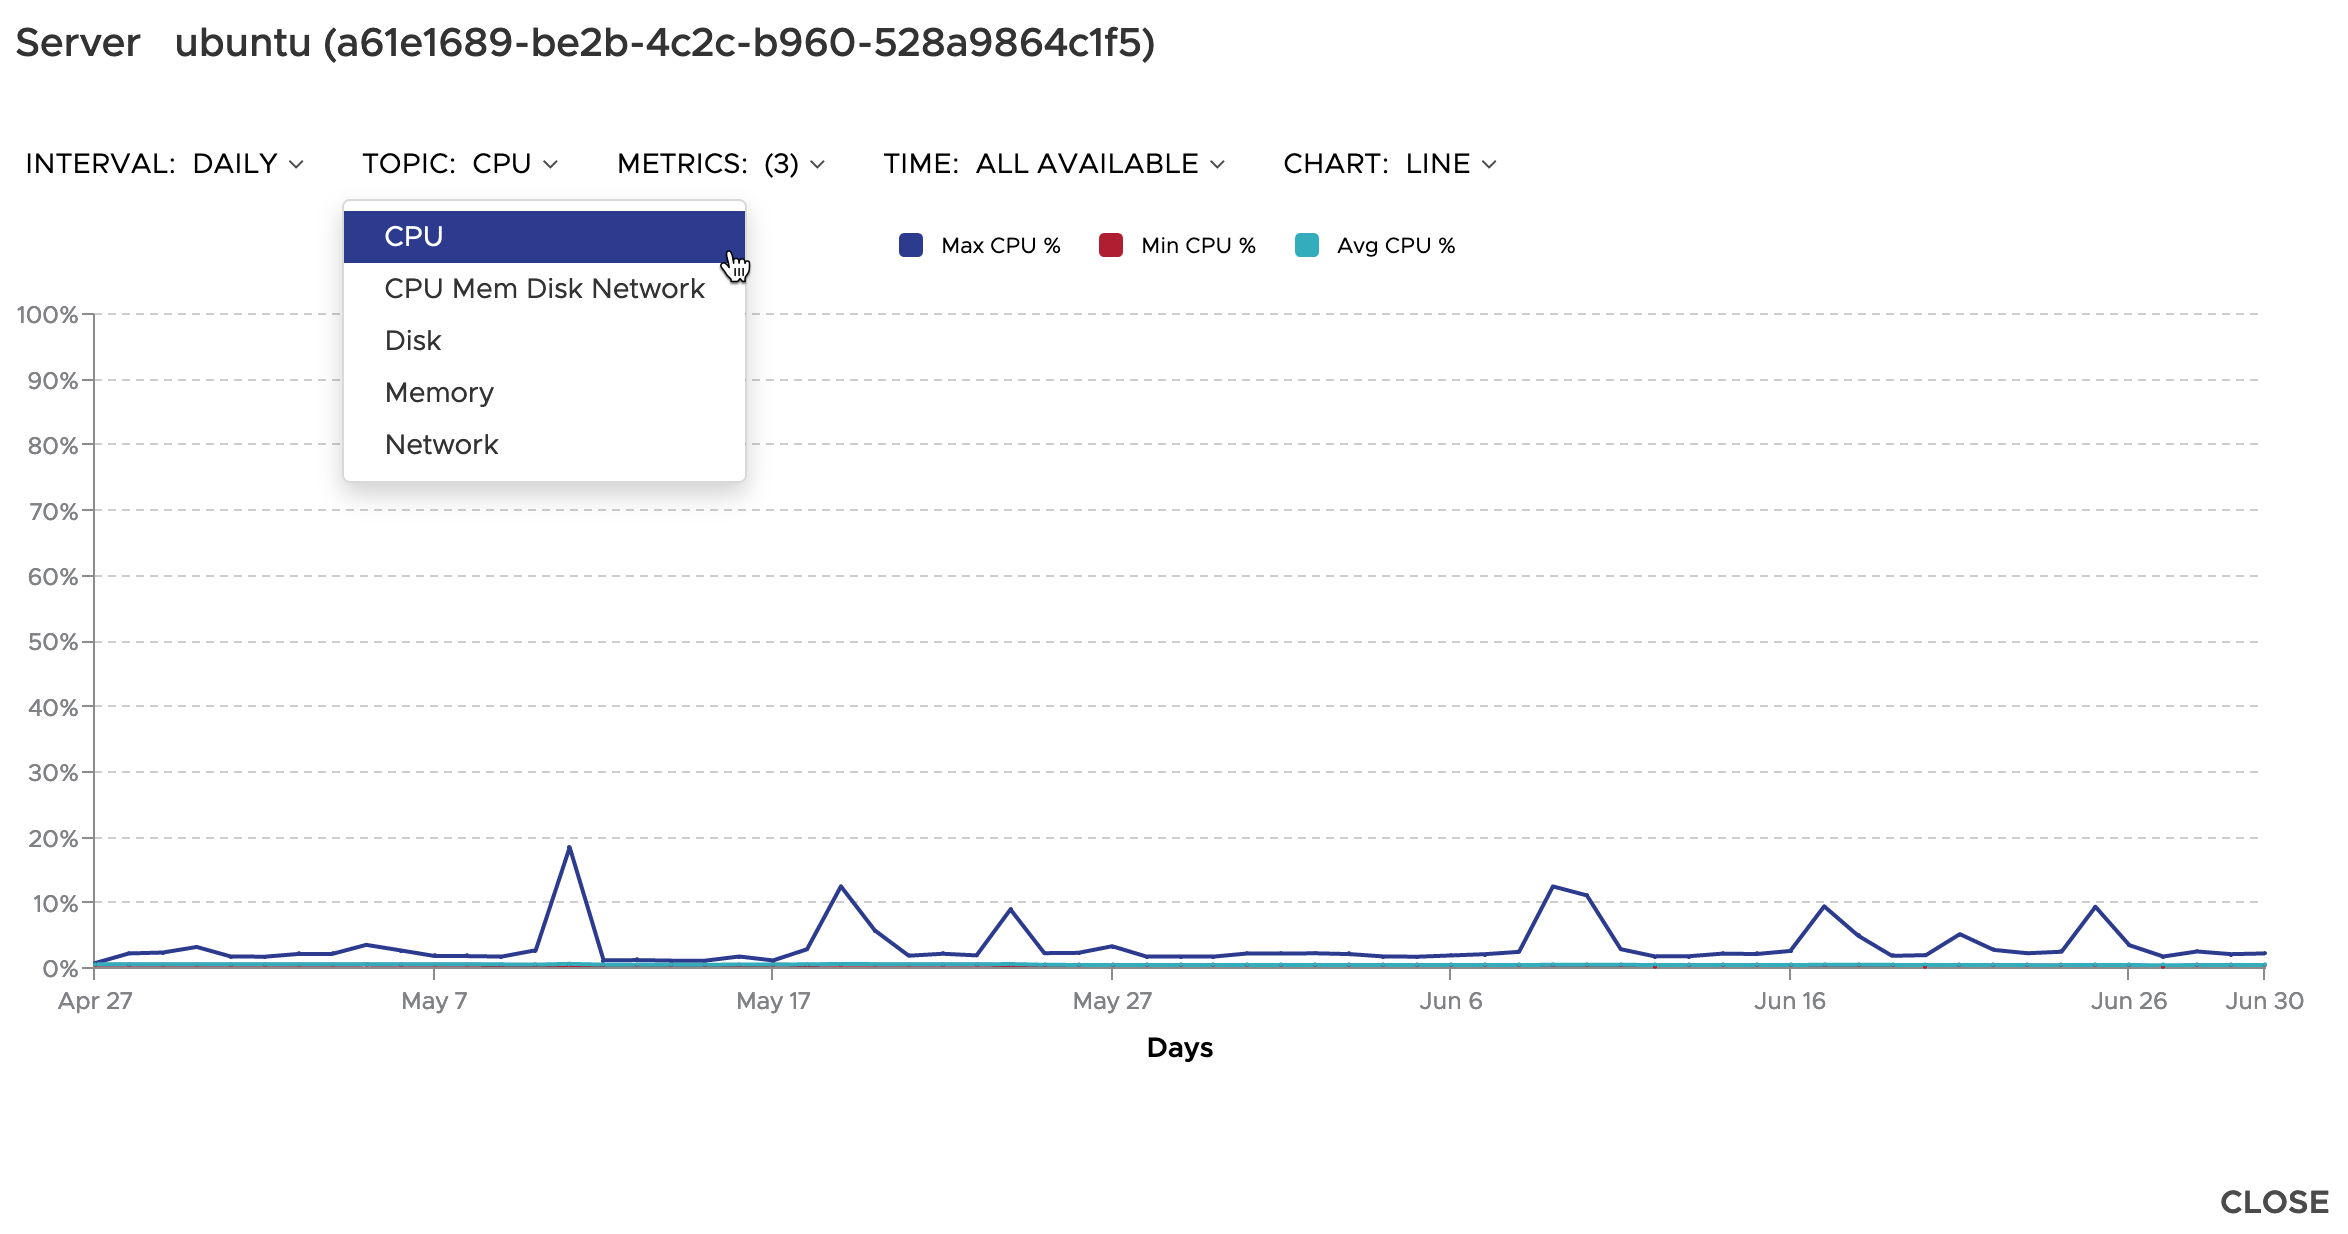
The Graph icon next to any object (purple arrow), shows a quick metric chart dialog box, as per the screenshot below. There are a number of items that can be charted out.
Clicking the Eye icon (green arrow), takes you into the full details view of the resource object.
Migration Assessment
The last area I wanted to cover in this blog post, is probably one of the features I get asked about the most.
“Can CloudHealth tell me the cost to migrate my VMs to the public cloud?”
Yes, it can! The migration assessment is everything you expect it to be. The user interface should be self-explanatory by now:
- Select Migration Assessment under the recommendations tab.
- Click New Assessment.
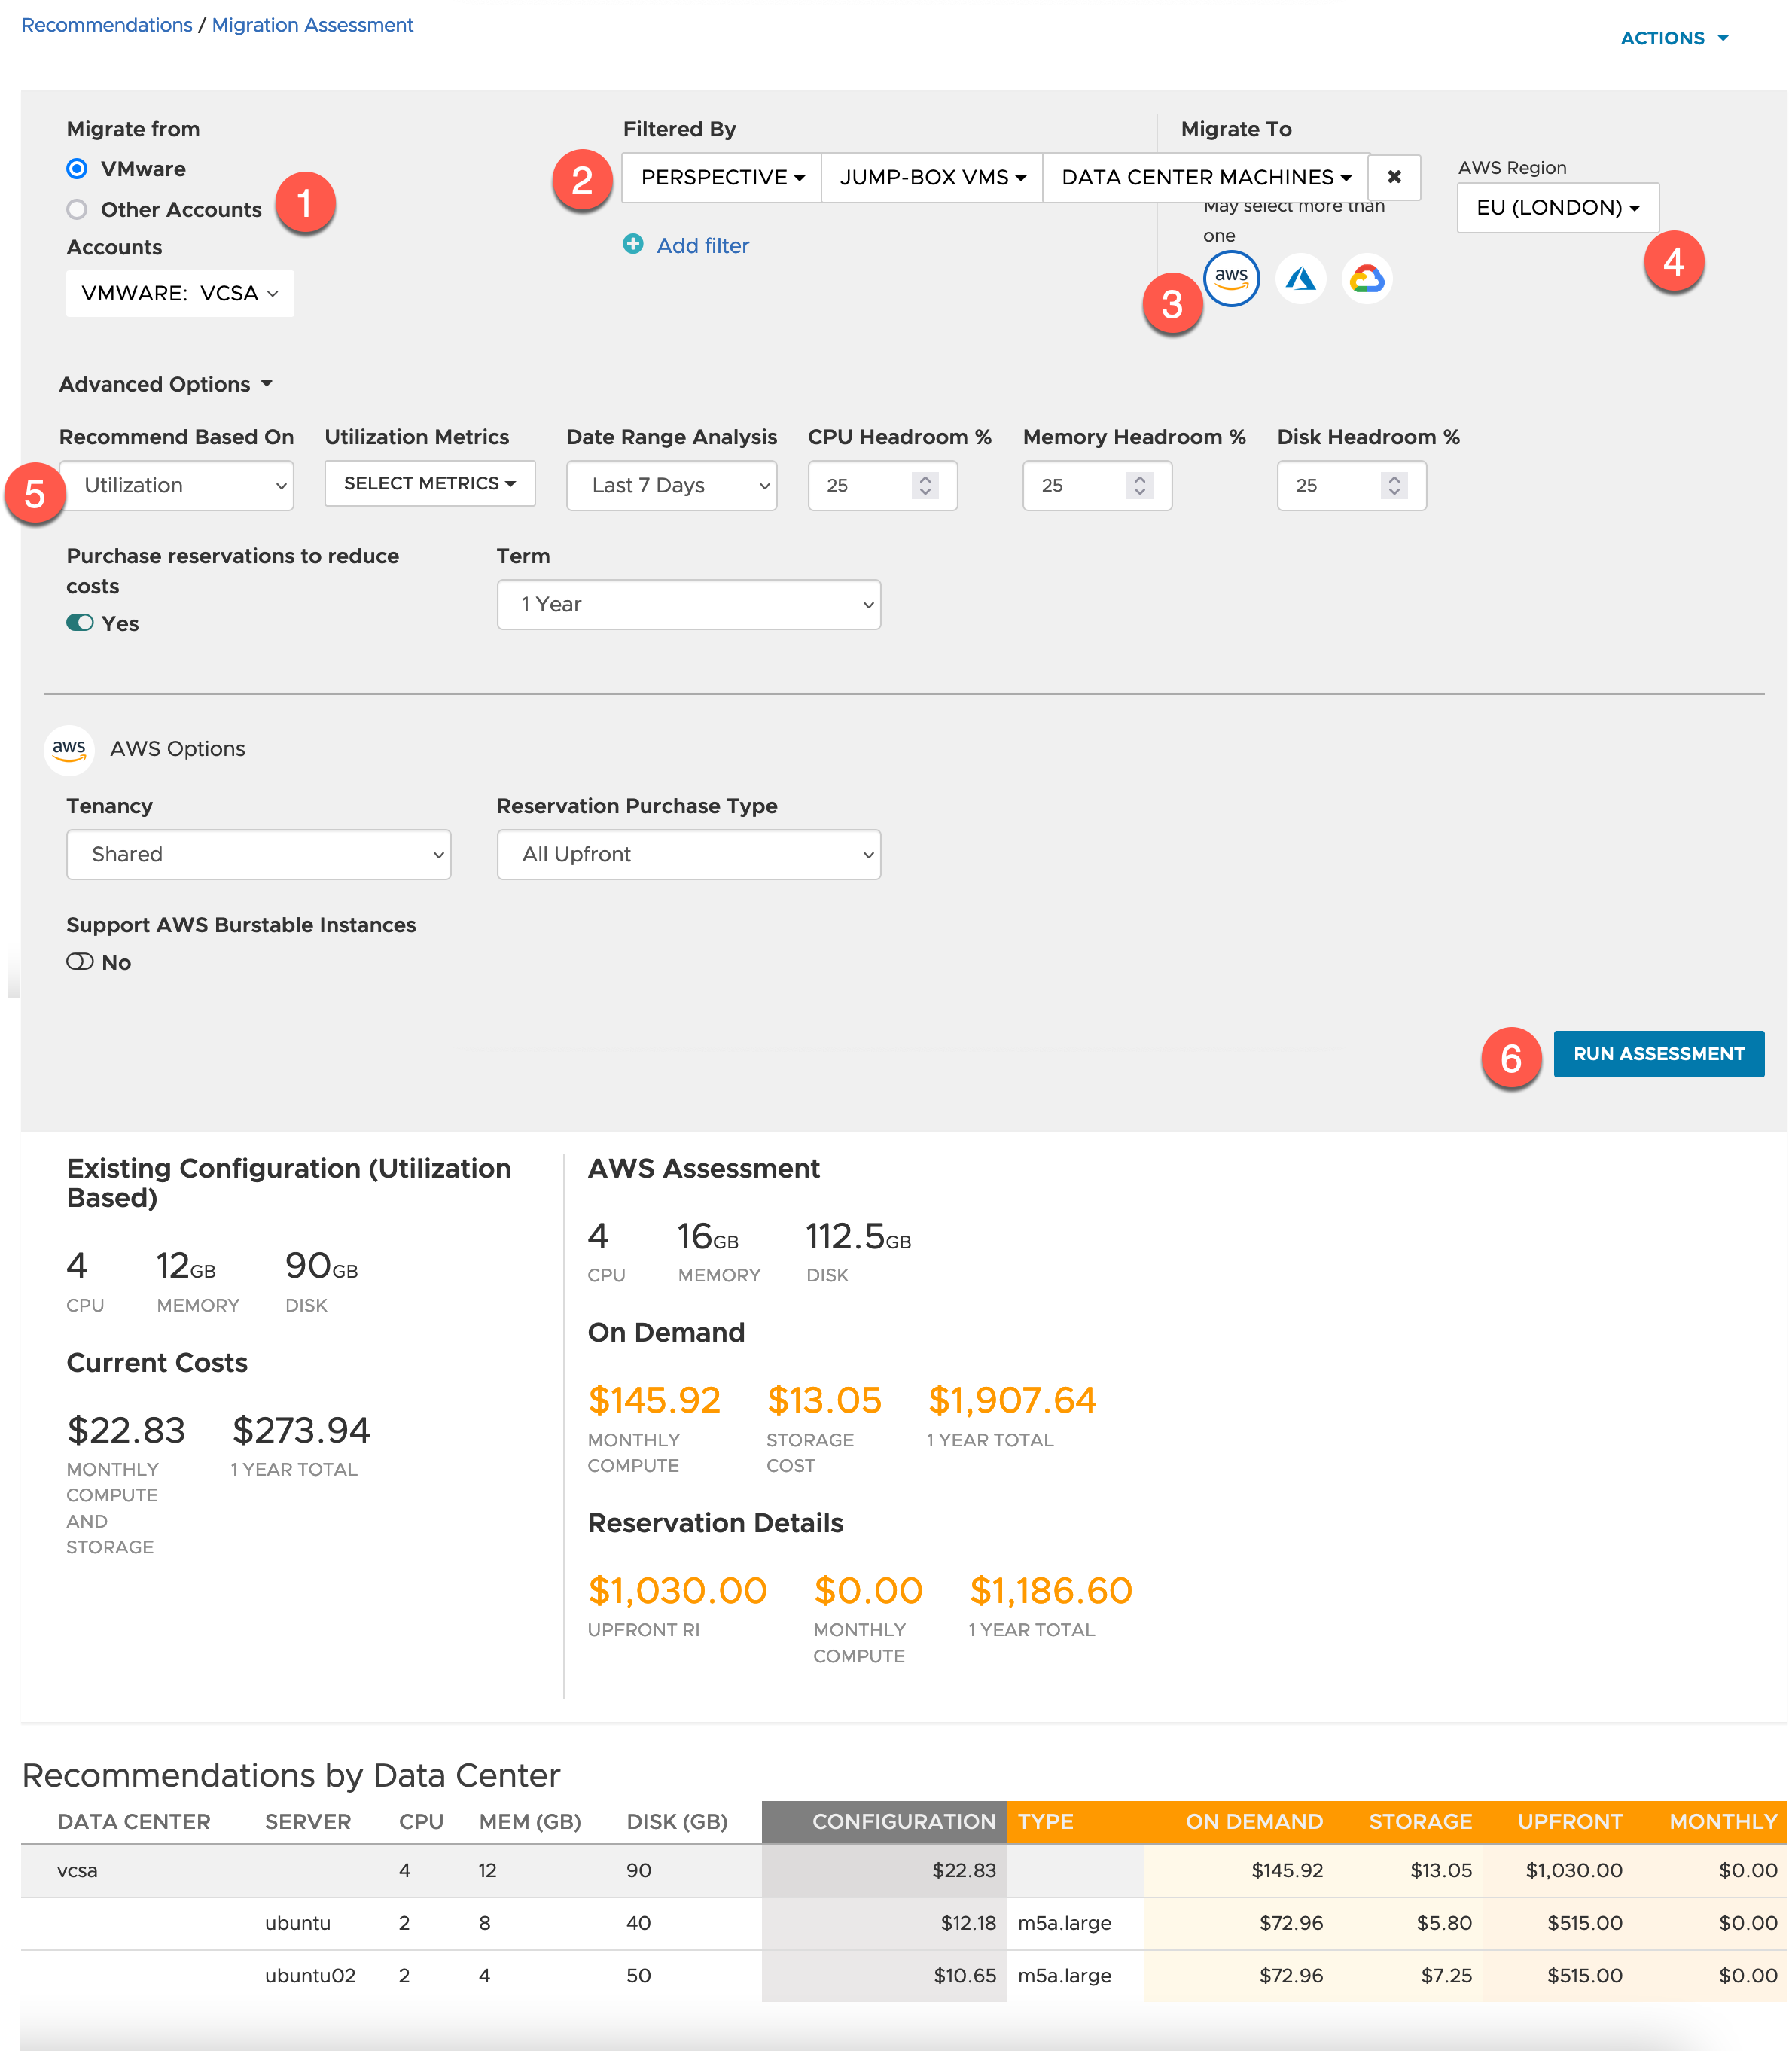
The assessment form is easy to follow:
- Select where you are migrating from
- Select any filters, I chose my earlier configured perspective
- Select which cloud to provide as a compare
- Select the region to migrate to
- Select metrics the recommendations will be made on
- Run the assessment
Once the assessment is run, the bottom of the form, you’ll see the calculated results.
This is where you start to see some of the differentials from the What-If migration features from vRealize operations. CloudHealth not only suggests the instance types for your virtual machines, but also helps you understand the cost implication of cost saving measures such as Reserved Instances.
Clicking the actions button, you can save the assessment or export the data to a CSV file.
Summary
Getting this CloudHealth integration setup is quick and simple and provides the additional contextual data you need when considering a full multi-cloud environment from a financial operations point of view by bringing your on-premises datacenter information alongside your public cloud environments.
I wrote this blog post, to detail out how the integration works, and show the types of data that is made available. Hopefully for those of you who made it to the end, this provides a useful resource.
Special shout out to Anthony Poh for reviewing this blog post and providing me additional information.
Regards
