Kubernetes

Kubernetes command line: tips and tricks

In this blog post, I have collected together a number of tips, tricks and snippets I’ve learned along the away whilst learning Kubernetes.

- Configure tab completion
- Selecting all namespaces in commands
- Restarting nodes
- Setting default storage class
- Resource usage
- Delete pods that are stuck terminating
- Using the watch command
- Troubleshooting
- - Run an interactive pod for debugging issues
- - - Alpine & BusyBox
- - Check etcd is running on master nodes
- - Get deployed pod image
- - Get Kubelet Service Logs
- - Get events from all namespaces, sorted by creation time
- Other Resources
- - Visual guide on troubleshooting Kubernetes deployments
- - Tool: Stern for tailing multiple Kubernetes objects logs
- - Useful Aliases to create for managing Kubernetes

I would also highly recommend the awesome Kubectl Cheat Sheet to be one of your go to references.

Configure Tab completion
source <(kubectl completion bash)
Selecting all name spaces in commands

rather than using “–all-namespaces” you can use “-A”

kubectl get pods --all-namespaces

kubectl get pods -A
Restarting Nodes

SSH to problematic node and run

/etc/init.d/kubelet restart

Source

Setting default storage class

Remove default storage class setting

kubectl patch storageclass {SC_NAME} -p '{"metadata": {"annotations":{"storageclass.kubernetes.io/is-default-class":"false"}}}'

Configure storage class as default

kubectl patch storageclass {SC_NAME} -p '{"metadata": {"annotations":{"storageclass.kubernetes.io/is-default-class":"true"}}}'

Source

Resource Usage

Requires metrics-server to be installed and running (github)

Pods;

#Check what pods are using the most memory in the cluster:
kubectl top pod --all-namespaces  | sort -rnk4 | head -40
 
#Check what pods are using the most CPU in the cluster:
kubectl top pod --all-namespaces  | sort -rnk3 | head -80

Nodes;

#Check which nodes are using the most memory in the cluster:
kubectl top nodes --all-namespaces  | sort -rnk4 | head -40
 
#Check which nodes are using the most CPU in the cluster:
kubectl top nodes --all-namespaces  | sort -rnk3 | head -80

Verify Kubelet is exposing Node metrics;

kubectl get --raw /api/v1/nodes/{Node_Name}/proxy/stats/summary

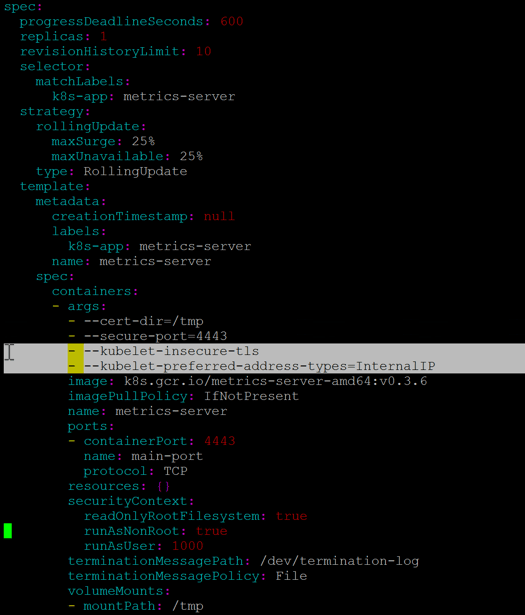
To get kube-metrics working I had to add the following to the deployment. (Highlighted in bold).

kubectl edit deployment metrics-server -n kube-system
#############
name: metrics-server
spec:
containers:
- args:
 - --kubelet-preferred-address-types=InternalIP
 - --kubelet-insecure-tls

kube metrics kubelet insecure tls kubelet preferred address types

Delete pods that are stuck terminating
kubectl get pods --all-namespaces | grep Terminating | while read line; do pod_name=$(echo $line | awk '{print $2}') && name_space=$(echo $line | awk '{print $1}' ); kubectl delete pods $pod_name -n $name_space --grace-period=0 --force ; done
Using the Watch command

Really simple one, but when deploying things, sometimes you don’t the feedback you need from the system. However using the Linux watch command infront of your Kubernetes commands, you can;

watch -n 2 kubectl get pods -n {namespace}

In the above example, this command will refresh your page every 2 seconds and list out the available pods and status.

Troubleshooting:
Run an interactive pod for debugging

This will create a pod of one of the below images, which will be removed when you exit out of the session.

Apline;

kubectl run -i --rm -t alpine-$USER --image=alpine --restart=Never -- /bin/sh

Press enter

BusyBox

kubectl run -i --tty --rm debug --image=busybox --restart=Never -- sh

Press enter

Source

Kubectl create apline image troubleshooting

Check etcd is running on master nodes

Check etcd pods have been created by Kubelet

sudo crictl pods --name=etcd-member

or 

sudo crictl ps -A

Check etcd logs on master nodes

sudo crictl logs $(sudo crictl ps --pod=$(sudo crictl pods --name=etcd-member --quiet) --quiet)

Source

Get pod deployed image
Kubectl get pod {name} -n {namespace} -o "jsonpath={range .status.containerStatuses[*]}{.name}{'\t'}{.state}{'\t'}{.image}{'\n'}{end}"

Example: 

root@k8s-master# kubectl get pods nginx -o "jsonpath={range .status.containerStatuses[*]}{.name}{'\t'}{.state}{'\t'}{.image}{'\n'}{end}"

nginx map[running:map[startedAt:2020-06-10T15:44:40Z]] nginx:latest

Get Kubelet Service logs

SSH to your node and run the following

journalctl -f -u kubelet.service
Get events from all namespaces, sorted by creation time
kubectl get events -A  --sort-by='.metadata.creationTimestamp'
Other Resources

A visual guide on troubleshooting Kubernetes deployments

Tool: Stern allows you to tail multiple pods on Kubernetes and multiple containers within the pod. Each result is colour coded for quicker debugging.

This can be more useful than the Kubectl logs command, which you need to know your individual pods name.

Tail logs of all pods of the deployment/service
 CMD: stern -n {Namespace} {deployment}
 
Same as above but starting with logs in the last minute
 CMD: stern -n {Namespace} {deployment} -s 1m

Useful Alias, can be used without ZSH

Regards

Tanzu Mission Control Header

VMware Tanzu Mission Control – Getting started with your first cluster

In this blog post we will cover the following topics

- What is Tanzu Mission Control?
- So, this isn't just for VMware environments?
- Getting Started Tanzu Mission Control
- - TMC Resource Hierarchy
- - Creating a Cluster Group
- - Attaching a cluster to Tanzu Mission Control
- - Viewing your Cluster Objects
- - - Overview
- - - Nodes
- - - Namespaces
- - - Workloads
- Where can I demo/test/trial this myself?

The follow up blog posts are;

Tanzu Mission Control 
- Getting Started Tanzu Mission Control 
- Cluster Inspections 
- Workspaces and Policies  
- Data Protection 
- Deploying TKG clusters to AWS 
- Upgrading a provisioned cluster 
- Delete a provisioned cluster 
- TKG Management support and provisioning new clusters
- TMC REST API - Postman Collection
- Using custom policies to ensure Kasten protects a deployed application

What is Tanzu Mission Control?

Tanzu Mission control is a cloud offering, which gives you a single point of control, monitoring and management, regardless of the Kubernetes deployment and their location (e.g Tanzu Kubernetes Grid, OpenShift Container Platform, Azure Kubernetes to name but a few).

Key Capabilities;

  • Manage Kubernetes Cluster Lifecycle through the deployment and day 2 operations
  • Attach Clusters for centralized operations and management
  • Centralized policy management
    • Apply access, network and container registry policies consistently across your Kubernetes clusters and namespaces
  • Global visibility for diagnosing and troubleshooting issues with your Kubernetes clusters
  • Inspection runbooks to validate the configuration of your clusters
    • Current offerings are;
      • Conformance; validating binaries running in your cluster to ensure proper configuration and running.
      • CIS benchmark; evaluation against the CIS Benchmark for Kubernetes published by the Center for Internet Security.
      • Lite; node conformance test to validate your nodes meet the Kubernetes requirements.

So, this isn’t just for VMware environments?

Nope, this is a cloud and Kubernetes neutral offering. You can attach CNCF conformant Kubernetes clusters to Tanzu Mission Control no matter where they are running: on vSphere, in any public clouds, or through other Kubernetes vendors.

Getting Started Tanzu Mission Control

TMC Resource Hierarchy

In the Tanzu Mission Control resource hierarchy, there are three levels at which you can specify policies.

  • Organization
  • Object groups (Cluster groups and Workspaces)
  • Kubernetes objects (Clusters and Namespaces)

You can set direct policies for a given object, but each object can also inherit based on the parent objects. So pretty much what you’ve been used to in the past with policies and hierarchies.

Creating a Cluster Group

A Cluster Group is a logical object to bring together multiple Kubernetes clusters. You can set user access policies to be able to view/edit/control cluster group objects and their child objects (clusters).

Cluster groups provide an infrastructure view, and all clusters must be attached to a group.

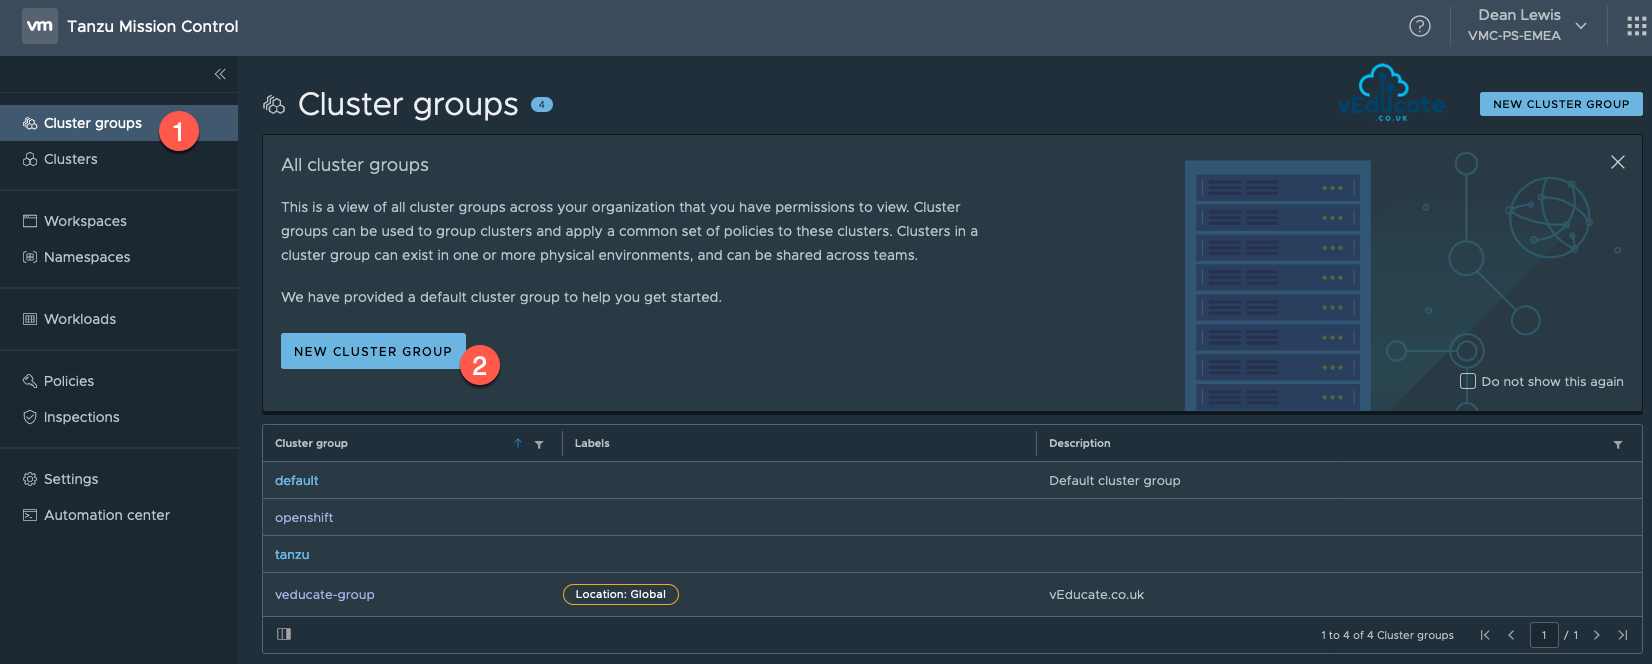
To create a Cluster Group;

  • Select the Cluster Group from the navigation
  • Click New Cluster Group
  • Supply a name, description and labels are optional and can be edited after creation

Tanzu Mission Control Create Clusters Group

Tanzu Mission Control New Cluster Group Continue reading VMware Tanzu Mission Control – Getting started with your first cluster

Tanzu Mission Control Header

VMware Tanzu Mission Control – Workspaces and Policies

In this blog post we will cover the following topics

- Tanzu Mission Control 
- - Workspaces 
- - - Creating a workspace
- - - Creating a managed Namespace
- - - Viewing a managed Namespace
- - Policy Driven Cluster Management
- - - Creating a Image Registry Policy
- - - Creating a Network Policy

The follow up blog posts are;

Tanzu Mission Control 
- Getting Started Tanzu Mission Control 
- Cluster Inspections 
- Workspaces and Policies  
- Data Protection 
- Deploying TKG clusters to AWS 
- Upgrading a provisioned cluster 
- Delete a provisioned cluster 
- TKG Management support and provisioning new clusters
- TMC REST API - Postman Collection
- Using custom policies to ensure Kasten protects a deployed application

Workspaces

Workspaces provide an application view, where you logically group Kubernetes Namespaces together, regardless of the cluster to which they are attached.

This is in contrast to Cluster Groups, which are focused on the infrastructure view.

These Workspaces can be created to align to your projects or applications, from a hierarchy point of view, you would then authorize your users to these Workspaces, so that they can monitor and manage the namespaces related to their function.

Creating a Workspace

Click the Workspace navigation view on the left-hand side, and then New Workspace.

Tanzu Mission Control New Workspace

Specify your Workspace name, and provide the optional description and labels, these can be added after creation if needed.

Tanzu Mission Control New Workspace Creation

Now you have a Workspace, it’s no good without any associated Namespaces, so let’s continue.

Creating a managed Namespace

All Namespaces attached to a Workspace will be managed Namespaces under TMC.

To create a managed Namespace, you can do this in one of four places;

  • Within the Workspace Navigation view
  • Inside the Workspace Object itself
  • On the Namespace Navigation view
  • On the Cluster Object > Navigation Tab

Continue reading VMware Tanzu Mission Control – Workspaces and Policies

Tanzu Mission Control Header

VMware Tanzu Mission Control – Cluster Inspections

In this blog post we will cover the following topics

- Tanzu Mission Control 
- - Cluster Inspections Overview
- - What Inspections are available
- - Performing Inspections
- - Viewing Inspections

The follow up blog posts are;

Tanzu Mission Control 
- Getting Started Tanzu Mission Control 
- Cluster Inspections 
- Workspaces and Policies  
- Data Protection 
- Deploying TKG clusters to AWS 
- Upgrading a provisioned cluster 
- Delete a provisioned cluster 
- TKG Management support and provisioning new clusters
- TMC REST API - Postman Collection
- Using custom policies to ensure Kasten protects a deployed application

Cluster Inspections Overview

This for me is one of the best features of Tanzu Mission Control, and an area which I expected will be developed further in the future.

Cluster inspections provide a point-in-time report of the condition of the cluster, you might want to run them periodically (to avoid drifting out of conformance) and any time you make significant alterations, such as after you patch or upgrade a cluster.

This capability is achieved by using Sonobuoy, an open source community standard, which provides diagnostics of your Kubernetes environments through conformance testing and additional plugins.

What Inspections are available?

The following cluster inspections are available from the Overview and Inspection tabs of the cluster detail page in the Tanzu Mission Control console.

  • Conformance inspection;

Validates the binaries running on your cluster and ensures that your cluster is properly installed, configured, and working. You can view the generated report from within Tanzu Mission Control to assess and address any issues that arise. For more information, see the Kubernetes Conformance documentation at https://github.com/cncf/k8s-conformance/tree/master/docs.

  • CIS benchmark inspection;

Evaluates your cluster against the CIS Benchmark for Kubernetes published by the Center for Internet Security.

  • Lite inspection;

Is a node conformance test that validates whether nodes meet requirements for Kubernetes. For more information, see Validate node setup in the Kubernetes documentation.

Tanzu Mission Control Openshift Cluster Inspections

Performing Inspections

To perform an inspection, there are two ways; from the inspections tab when view a cluster object (as in the above screenshot).

Or you can do this from the Inspections navigation page, as below.

Tanzu Mission Control Openshift Cluster Inspections Navigation Page Continue reading VMware Tanzu Mission Control – Cluster Inspections

vRealize Operations Openshift Container Platform Monitoring header

vRealize Operations – Monitoring OpenShift Container Platform environments

The latest release of  vRealize Operations (the “manager” part of the product name has now been dropped), brings the ability to manage your Kubernetes environments from the vSphere infrastructure up.

The Kubernetes integration in vRealize Operations 8.1;

  • vSphere with Kubernetes integration:
    • Ability to discover vSphere with Kubernetes objects as part of the vCenter Server inventory.
    • New summary pages for Supervisor Cluster, Namespaces, Tanzu Kubernetes cluster, and vSphere Pods.
    • ​Out-of-the-box dashboards, alerts, reports, and views for vSphere with Kubernetes.
  • The VMware Management Packs that are new and those that are updated for vRealize Operations Manager 8.1 are:
    • VMware vRealize Operations Management Pack for Container Monitoring 1.4.3

Where does OpenShift Container Platform fit in?

All though the above highlighted release notes point towards vSphere with Kubernetes (aka project pacific), the Container monitoring management pack has been available for a while and has received a number of updates.

vRealize Operations Management Pack for Containers compatiibility

This management pack can be used with any of your Kubernetes setups. Bringing components into your infrastructure monitoring view;

  • Kubernetes;
    • Clusters
    • Nodes
    • Pods
    • Containers
    • Services

So this means you can add in your OCP environment for monitoring.

Configuring vRealize Operations to monitor your OpenShift Clusters

Grab the latest Container monitoring management pack to be installed in your vRealize Operations environment.

  1. Log in to the vRealize Operations Manager with administrator privileges.
  2. In the menu, select Administration and in the left pane select Solutions > Repository.
  3. On the Repository tab, click Add/Upgrade.
  4. Browse to locate the temporary folder and select the PAK file.
  5. Click Upload. The upload might take several minutes.
  6. Read and accept the EULA,and click Next.
  7. When the vRealize Operations Management Pack for Container Monitoring is installed, click Finish.

vRealize Operations add Management Pack

To link any Kubernetes to your environment for monitoring, you need to install the cAdvisor Daemon.  For OCP I used the cAdvisor YAML Definition on HostPort, secondly you need to create some credentials to authenticate to your cluster from your connection in vROPs. Continue reading vRealize Operations – Monitoring OpenShift Container Platform environments