Just a quick blog post on deleting unnecessary or unneeded bundles from VCF – SDDC Manager.
There is two parts to this.
- Getting your Bundle ID you want to delete from the API
- Deleting the Bundle using a script on the SDDC Manager appliance.
In your SDDC Manager:
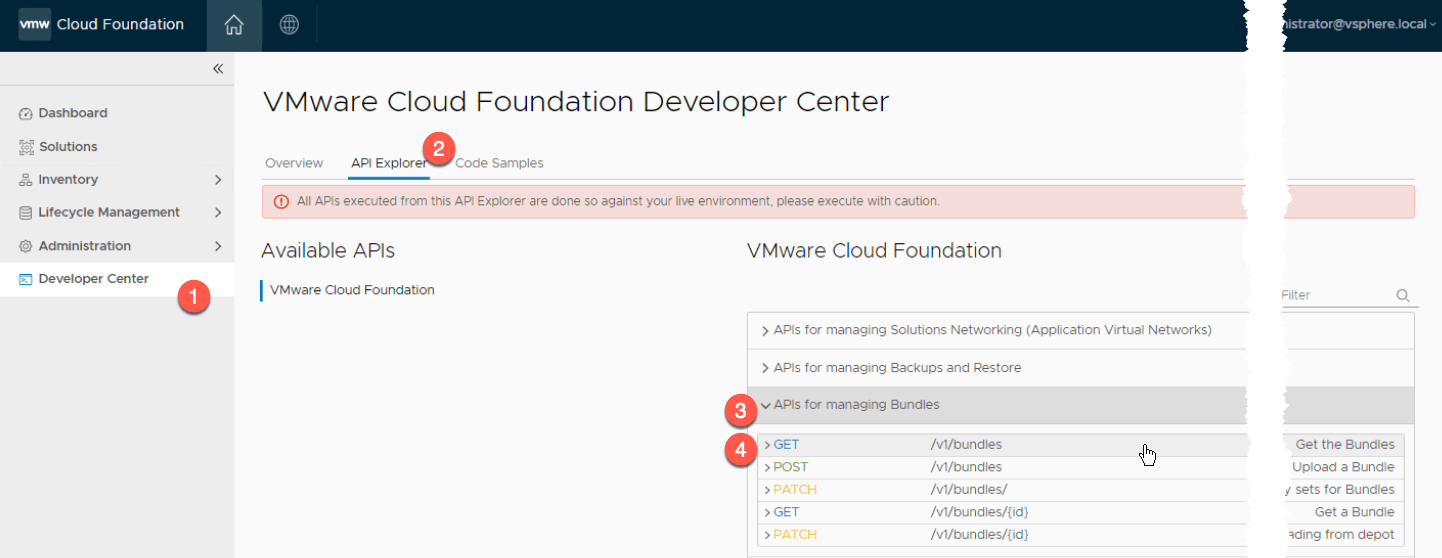
- Click Development Center
- Click API Explorer
- Expand “APIs for managing bundles”
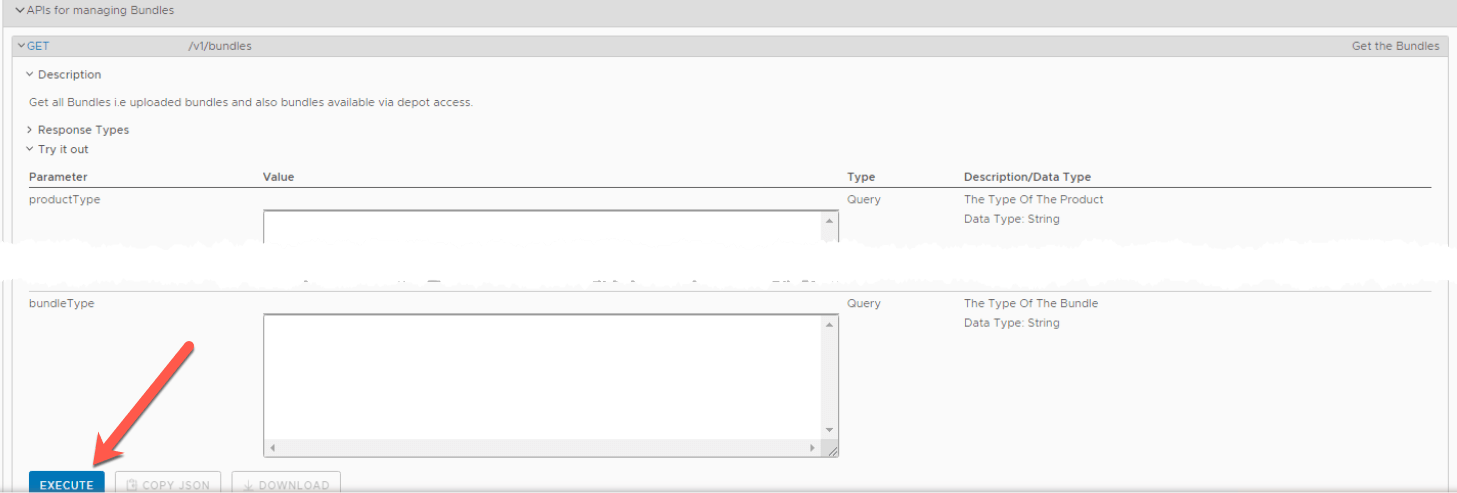
- Expand the first “GET” command
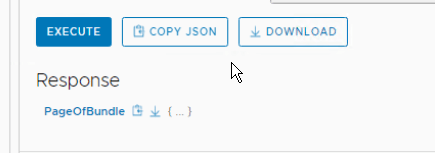
- Click Execute, no need to fill anything in
- Download or Copy the response output.
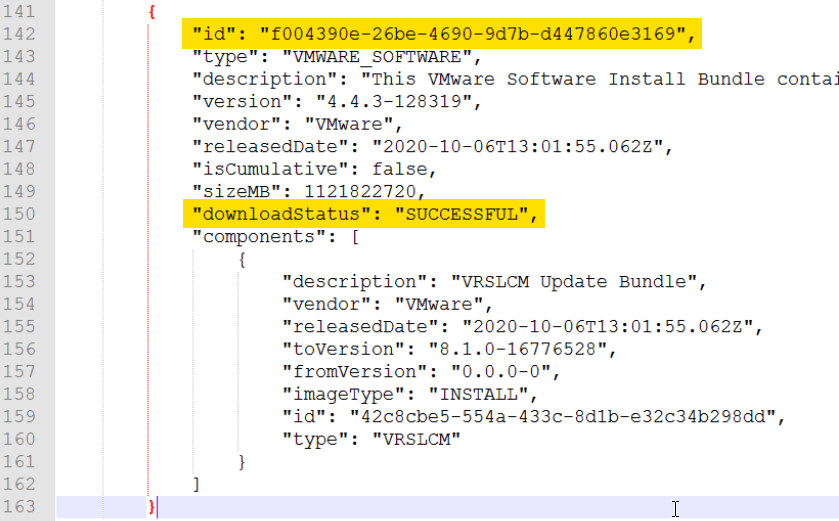
- Find your Bundle ID within your output, you need to look for the top level ID of the JSON block, and ensure that this bundle says successfully downloaded.
SSH to your SDDC Manager and elevate to root.
# su
{provide password to elevate to root}
# /opt/vmware/vcf/lcm/lcm-app/bin/bundle_cleanup.py {Bundle_id}

Example below
# /opt/vmware/vcf/lcm/lcm-app/bin/bundle_cleanup.py f004390e-26be-4690-9d7b-d447860e3169
You will see the following output when the script has run.
-----------------------------------------------------
LOG FILE : /var/log/vmware/vcf/lcm/bundle_cleanup.log
-----------------------------------------------------
2021-03-08 12:18:31,809 [INFO] root: Performing cleanup for bundle with IDs : [' f004390e-26be-4690-9d7b-d447860e3169']
2021-03-08 12:18:31,809 [INFO] root: Execute cmd: psql --host=localhost -U postg res -d lcm -tc "select count(*) from upgrade where upgrade_status in ('INPROGRES S','CANCELLING');"
2021-03-08 12:18:31,848 [INFO] root: b' 0\n'
2021-03-08 12:18:31,848 [INFO] root: b'\n'
2021-03-08 12:18:31,848 [INFO] root: RC: 0
2021-03-08 12:18:31,849 [INFO] root: Out: 0

2021-03-08 12:18:31,849 [INFO] root: Stopping LCM service.
2021-03-08 12:18:31,849 [INFO] root: Execute cmd: systemctl stop lcm
2021-03-08 12:18:32,290 [INFO] root: RC: 0
2021-03-08 12:18:32,290 [INFO] root: Out:
2021-03-08 12:18:32,291 [INFO] root: Removing LCM NFS mount.
2021-03-08 12:18:32,291 [INFO] root: Execute cmd: rm -rf /nfs/vmware/vcf/nfs-mou nt/bundle/f004390e-26be-4690-9d7b-d447860e3169
2021-03-08 12:18:32,683 [INFO] root: RC: 0
2021-03-08 12:18:32,684 [INFO] root: Out:
2021-03-08 12:18:32,684 [INFO] root: Execute cmd: psql --host=localhost -U postg res -d lcm -tc "select upload_id from bundle_upload where bundle_id = 'f004390e- 26be-4690-9d7b-d447860e3169';"
2021-03-08 12:18:32,704 [INFO] root: b'\n'
2021-03-08 12:18:32,705 [INFO] root: RC: 0
2021-03-08 12:18:32,705 [INFO] root: Out:

2021-03-08 12:18:32,705 [INFO] root: Bundle with ID : f004390e-26be-4690-9d7b-d4 47860e3169 not found in bundle upload table
2021-03-08 12:18:32,706 [INFO] root: Execute cmd: psql --host=localhost -U postg res -d lcm -tc "select download_id from bundledownload_by_id where bundle_id = ' f004390e-26be-4690-9d7b-d447860e3169';"
2021-03-08 12:18:32,724 [INFO] root: b' 0fb2e30e-d991-4b63-8686-42fab98a1c9e\n'
2021-03-08 12:18:32,724 [INFO] root: b'\n'
2021-03-08 12:18:32,725 [INFO] root: RC: 0
2021-03-08 12:18:32,725 [INFO] root: Out: 0fb2e30e-d991-4b63-8686-42fab98a1c9e

2021-03-08 12:18:32,725 [INFO] root: Execute cmd: curl -s -X DELETE localhost/ta sks/registrations/0fb2e30e-d991-4b63-8686-42fab98a1c9e
2021-03-08 12:18:32,830 [INFO] root: RC: 0
2021-03-08 12:18:32,830 [INFO] root: Out:
2021-03-08 12:18:32,830 [INFO] root: Execute cmd: psql --host=localhost -U postg res -d lcm -tc "select upgrade_id from upgrade where bundle_id = 'f004390e-26be- 4690-9d7b-d447860e3169';"
2021-03-08 12:18:32,852 [INFO] root: b'\n'
2021-03-08 12:18:32,853 [INFO] root: RC: 0
2021-03-08 12:18:32,853 [INFO] root: Out:

2021-03-08 12:18:32,853 [INFO] root: Bundle with ID : f004390e-26be-4690-9d7b-d4 47860e3169 not found in upgrade table
2021-03-08 12:18:32,854 [INFO] root: Execute cmd: psql --host=localhost -U postg res -d lcm -tc "select upgrade_id from upgrade where bundle_id = 'f004390e-26be- 4690-9d7b-d447860e3169';"
2021-03-08 12:18:32,873 [INFO] root: b'\n'
2021-03-08 12:18:32,874 [INFO] root: RC: 0
2021-03-08 12:18:32,874 [INFO] root: Out:

2021-03-08 12:18:32,874 [INFO] root: Bundle with ID : f004390e-26be-4690-9d7b-d4 47860e3169 not found in upgrade table
2021-03-08 12:18:32,875 [INFO] root: Execute cmd: psql --host=localhost -U postg res -d lcm -tc "select count(*) from bundle where bundle_id = 'f004390e-26be-469 0-9d7b-d447860e3169';"
2021-03-08 12:18:32,894 [INFO] root: b' 1\n'
2021-03-08 12:18:32,895 [INFO] root: b'\n'
2021-03-08 12:18:32,895 [INFO] root: RC: 0
2021-03-08 12:18:32,895 [INFO] root: Out: 1

2021-03-08 12:18:32,896 [INFO] root: Deleting bundle & upgrade info for bundle I D : f004390e-26be-4690-9d7b-d447860e3169
2021-03-08 12:18:32,896 [INFO] root: Execute cmd: psql --host=localhost -U postg res -d lcm -c "delete from bundle where bundle_id = 'f004390e-26be-4690-9d7b-d44 7860e3169';"
2021-03-08 12:18:32,923 [INFO] root: b'DELETE 1\n'
2021-03-08 12:18:32,924 [INFO] root: RC: 0
2021-03-08 12:18:32,924 [INFO] root: Out: DELETE 1

2021-03-08 12:18:32,924 [INFO] root: Execute cmd: psql --host=localhost -U postg res -d lcm -tc "select count(*) from image where bundle_id = 'f004390e-26be-4690 -9d7b-d447860e3169';"
2021-03-08 12:18:32,943 [INFO] root: b' 1\n'
2021-03-08 12:18:32,943 [INFO] root: b'\n'
2021-03-08 12:18:32,943 [INFO] root: RC: 0
2021-03-08 12:18:32,944 [INFO] root: Out: 1

2021-03-08 12:18:32,944 [INFO] root: Deleting bundle f004390e-26be-4690-9d7b-d44 7860e3169 in image table
2021-03-08 12:18:32,944 [INFO] root: Execute cmd: psql --host=localhost -U postg res -d lcm -c "delete from image where bundle_id = 'f004390e-26be-4690-9d7b-d447 860e3169';"
2021-03-08 12:18:32,967 [INFO] root: b'DELETE 1\n'
2021-03-08 12:18:32,967 [INFO] root: RC: 0
2021-03-08 12:18:32,967 [INFO] root: Out: DELETE 1

2021-03-08 12:18:32,968 [INFO] root: Execute cmd: psql --host=localhost -U postg res -d lcm -tc "select count(*) from partner_bundle_metadata where bundle_id = ' f004390e-26be-4690-9d7b-d447860e3169';"
2021-03-08 12:18:32,990 [INFO] root: b' 0\n'
2021-03-08 12:18:32,990 [INFO] root: b'\n'
2021-03-08 12:18:32,990 [INFO] root: RC: 0
2021-03-08 12:18:32,990 [INFO] root: Out: 0

2021-03-08 12:18:32,990 [INFO] root: Bundle with ID : f004390e-26be-4690-9d7b-d4 47860e3169 not found in partner_bundle_metadata table
2021-03-08 12:18:32,991 [INFO] root: Starting LCM service.
2021-03-08 12:18:32,991 [INFO] root: Execute cmd: systemctl start lcm
2021-03-08 12:18:33,135 [INFO] root: RC: 0
2021-03-08 12:18:33,136 [INFO] root: Out:
Going back into your SDDC Manager UI, and clicking the Bundle Management page, you will see your bundle has now been deleted.
It will take a few minutes for the Bundle services to restart, and you may see the message “Depot still initializing”.
Regards
