gke header

GKE – User cannot create resource – requires one of [“container.roles.create”] permission(s)

The Issue

I stood up my first ever GKE cluster! Woo, go me!

However when I was trying to setup Tanzu Service Mesh, I hit issues such as:

Error from server (Forbidden): error when creating "operator-deployment.yaml": roles.rbac.authorization.k8s.io is forbidden: User "[email protected]" cannot create resource "roles" in API group "rbac.authorization.k8s.io" in the namespace "vmware-system-tsm": requires one of ["container.roles.create"] permission(s).
The Cause

This is because your initial Kubernetes login has no cluster level permissions, due to the RBAC setup.

The Fix

You need to create some new Cluster Level roles and bind to them with your account, or use the existing ones.

As this is a demo environment. I just bound my account to the out-of-the-box cluster-admin ClusterLevelRole (that is a mouthful!).

kubectl create clusterrolebinding cluster-admin-binding \
--clusterrole=cluster-admin \
--user=[gcp user email]

# Example
kubectl create clusterrolebinding cluster-admin-binding \
--clusterrole=cluster-admin \
[email protected]

If you need to double check with google account you are using, you can run:

gcloud info | grep Account

Regards

Dean Lewis

google cloud header

Google Cloud – Invitation email not received – Project IAM role pending

The Issue

For me, it started off with having some odd issues in a GKE cluster, where I didn’t have permissions to do things at a cluster level. After some digging it pointed to the wrong IAM roles on the Google Cloud Project.

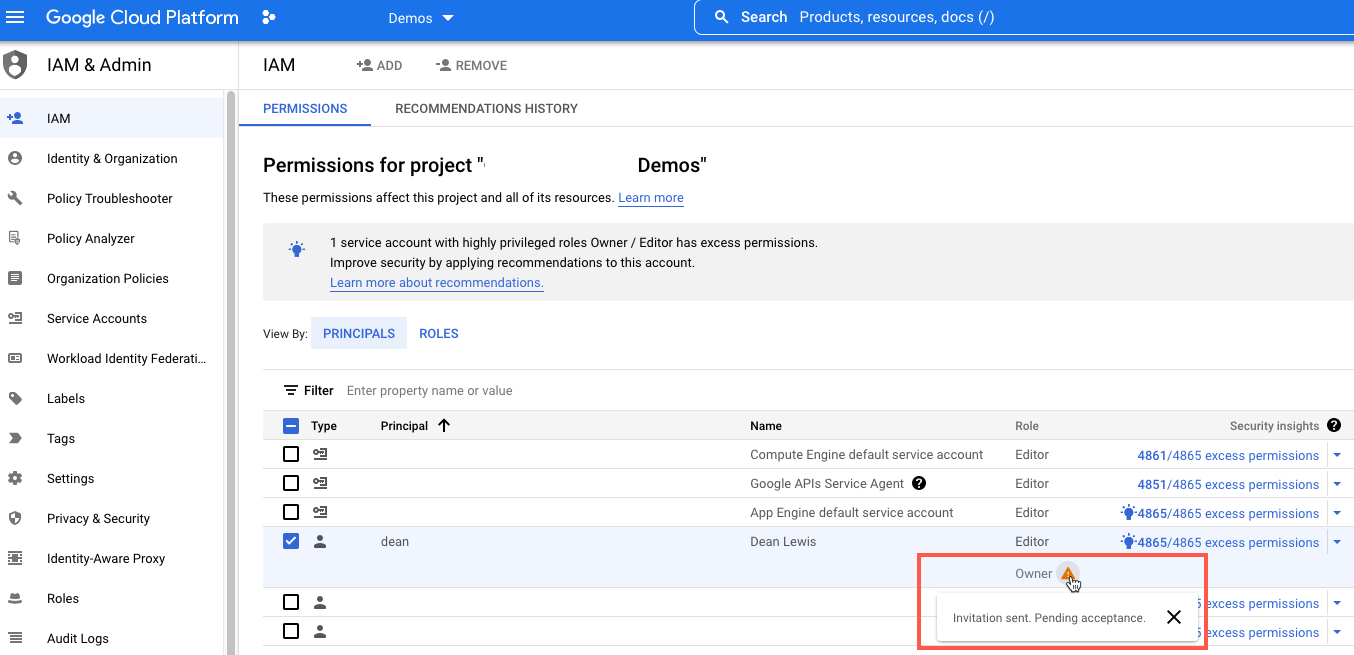
When I investigated this, I found I wasn’t yet confirmed as the owner of the project. It said an email was sent, but I had received nothing!

google cloud - IAM - Invitation sent pending acceptance

The Cause

Maybe something wrong with Googles SMTP? Or spam filters on the receivers side. But it doesn’t help you cannot resent the email!

The Fix

You can accept the invitation by going to the below link.

https://console.cloud.google.com/invitation?project=[your-project-id]&account=[the-account-email-invited]&memberEmail=[the-account-email-invited]

Example
https://console.cloud.google.com/invitation?project=veducate-demo&[email protected]&[email protected]

Regards

Dean Lewis

Red Hat OpenShift + VMware Header

OpenShift 4.10 on VMware – Introducing the out-of-the-box vSphere CSI Driver installation

OpenShift Container Platform defaults to using an in-tree (non-CSI) plug-in to provision vSphere storage.

What’s New?

In OpenShift 4.9, the out-of-the-box installation of the vSphere CSI driver was tech preview. This has now moved to GA!

This means during an Installer-Provisioned-Installation cluster bring up, the vSphere CSI driver will be enabled.

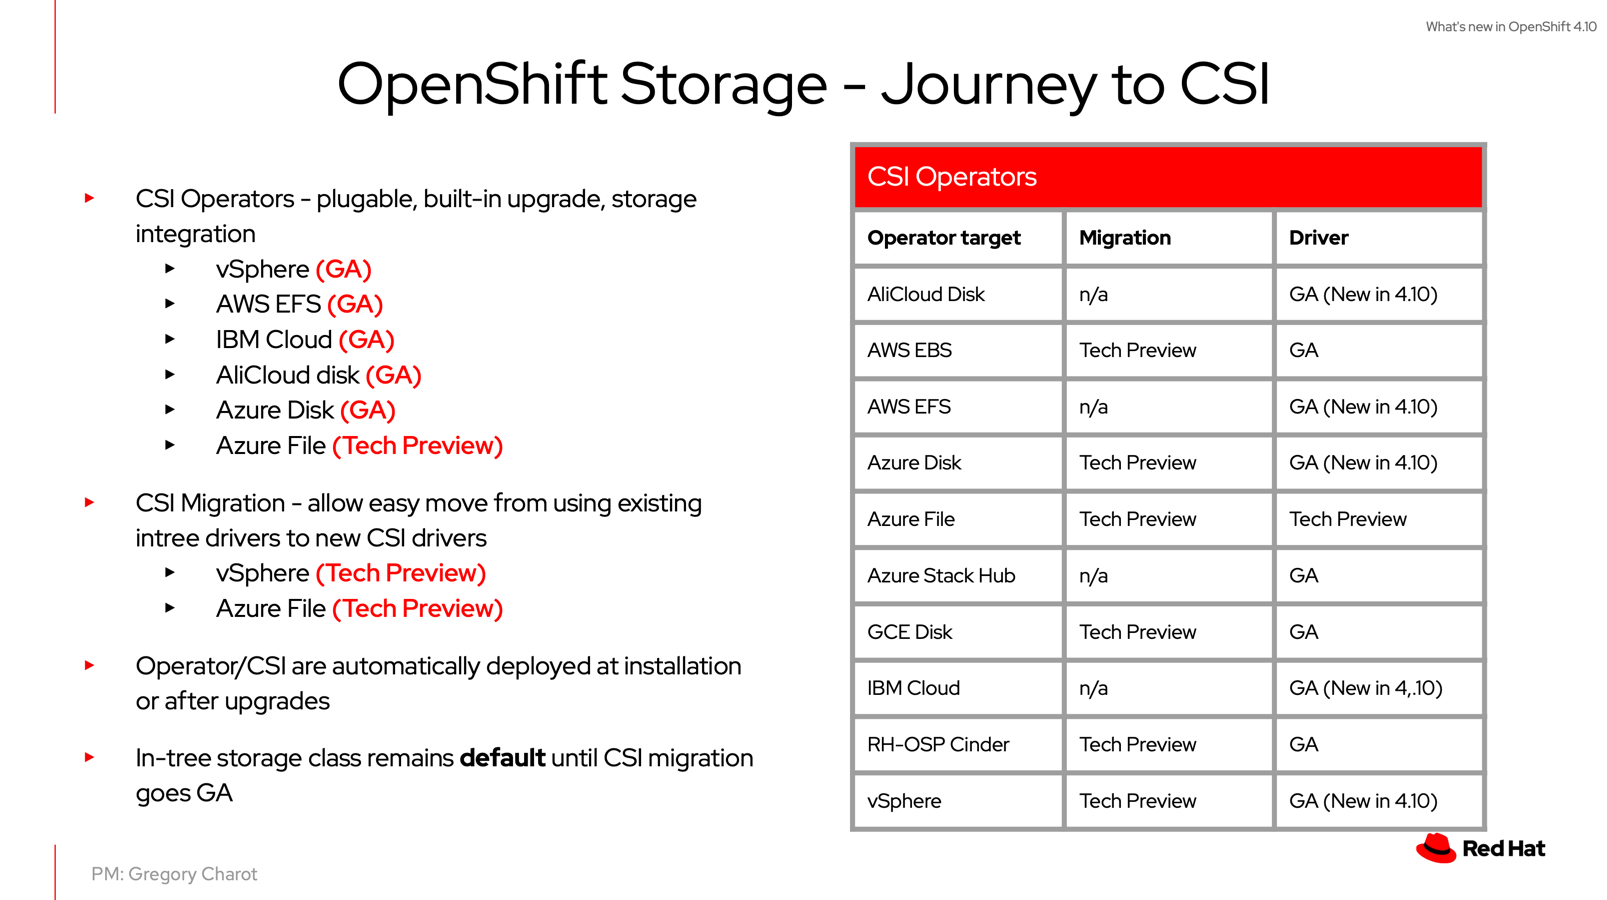
This is part of the future “journey” of OpenShift to CSI drivers. As you may be aware, the original storage implementations “in-tree” drivers will be removed from future versions of Kubernetes, making way for the CSI Drivers, a better storage integration implementation.

OpenShift Storage - Journey to CSI

Therefore, the Red Hat team have been working with the upstream native vSphere CSI Driver, which is open-source and VMware Storage team, to integrating into the OpenShift installation.

The aim here is two-fold, take further advantage of the VMware platform, and to enable CSI Migration. So that is easier for customers to migrate their existing persistent data from in-tree provisioned storage constructs to CSI provisioned constructs.

How do I enable this?

Continue reading OpenShift 4.10 on VMware – Introducing the out-of-the-box vSphere CSI Driver installation

vRealize Operations Management Pack Builder Header

vRealize Operations Management Pack Builder – Building your first management pack

What is the Management Pack Builder?

Well, it’s exactly as the name suggests, a tool for building your own vRealize Operations Management Pack, to bring data into vROPs whereby there is no existing Management Pack today.

How do I get access to it?

You can sign up for the BETA here. Currently VMware is taking feedback from customers to help shape the future of this product.

You can find documentation and videos on the product on this page.

Note: VMware does not commit to delivering features discussed in this program in any generally available product.
Installing the Appliance
I’m not going to go into detail here, it’s a simple appliance that you deploy as an OVA file and provide the networking configuration as either DHCP or Static IP.
Setup the Management Pack Builder

Log into the appliance using “admin/admin” and you will be prompted to change your password.

You will need to licence the product (using the beta key).

  • Click the little person icon in the top right
  • Select “Licence”
  • Apply the licence

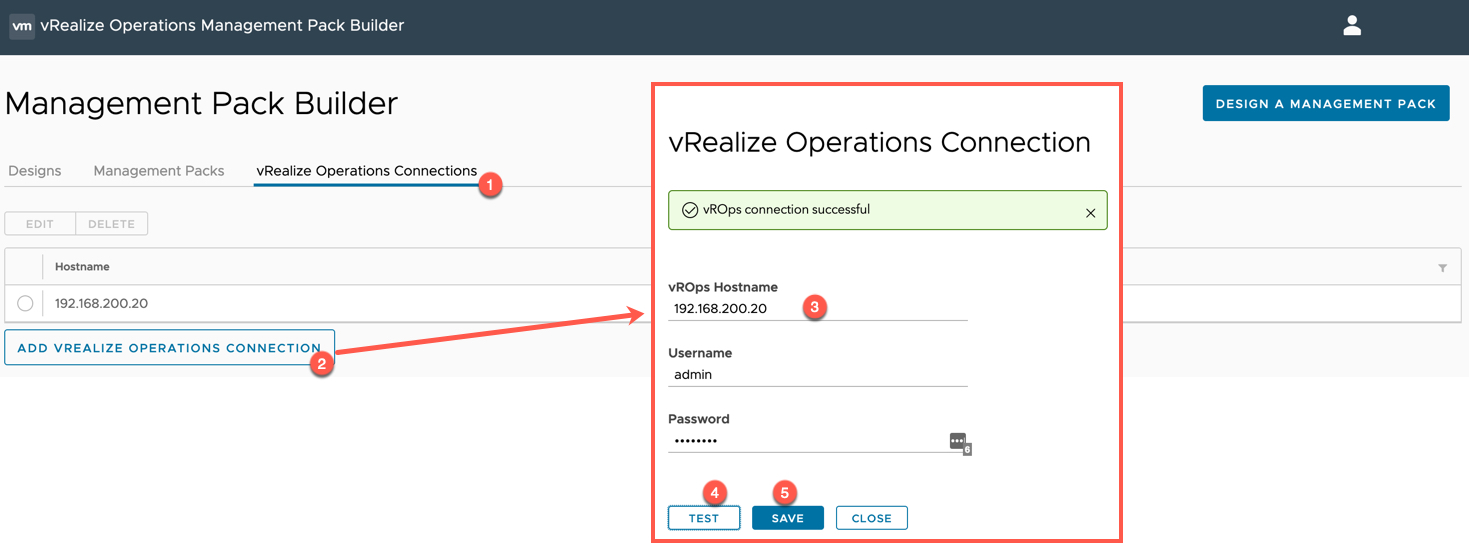
Next, we need to create a connection to our vRealize Operations environment. While this step is not necessary at all to get started. If you want to create relationships for data objects with existing vROPs objects, you need to configure this connection.

  • Select the “vRealize Operations Connections Tab”
  • Click “Add vRealize Operations Connection” button
  • Input your details
    • Click Test
    • Click Save

vRealize Operations Management Pack Builder - vRealize Operations Connector

Creating your first management pack

Continue reading vRealize Operations Management Pack Builder – Building your first management pack

Tanzu Observability Header

Tanzu Observability – First look at monitoring OpenShift & VMware Cloud on AWS

Recently, I was involved in some work to assist the VMware Tanzu Observability team to assist them in updating their deliverables for OpenShift. Now it’s generally available, I found some time to test it out in my lab.

For this blog post, I am going to pull in metrics from my VMware Cloud on AWS environment and the Red Hat OpenShift Cluster which is deployed upon it.

What is Tanzu Observability?

We should probably start with what is Observability, I could re-create the wheel, but instead VMware has you covered with this helpful page.

Below is the shortened table comparison.
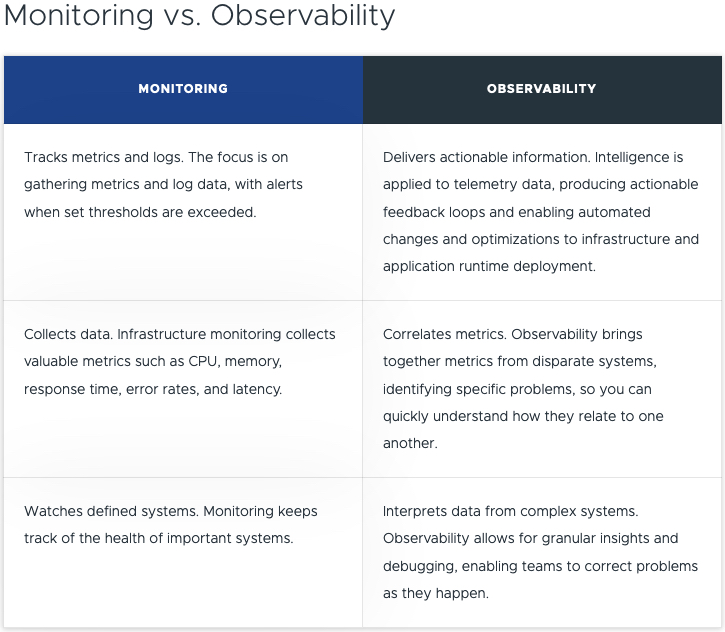
Monitoring vs. Observability

As a developer you want to focus on developing the application, but you also do need to understand the rest of the stack to a point. In the middle, you have a Site Reliability Engineer (SRE), who covers the platform itself, and availability to ensure the app runs as best it can. And finally, we have the platform owner, where the applications and other services are located.

Somewhere in the middle, when it comes to tooling, you need to cover an example of the areas listed below:

  • Application Observability & Root Cause Analysis
    • App-aware Troubleshooting & Root Cause Analysis
  • Distributed Tracing
  • CI/CD Monitoring
  • Analytics with Query Language and high reliability, granularity, cardinality, and retention
  • Full-Stack Apps & Infra Telemetry as a Service
  • Infra Monitoring
    • Performance Optimization
    • Capacity and Cost Optimization
    • Configuration and Compliance

So now you are thinking, OK, but VMware has vRealize Operations that gives me a lot of data, so why is there a new product for this?

vRealize Operations and Tanzu Observability come together – delivering full stack monitoring and observability from both the infra-up and app-down perspective, equipping both teams in the org to meet common goals.
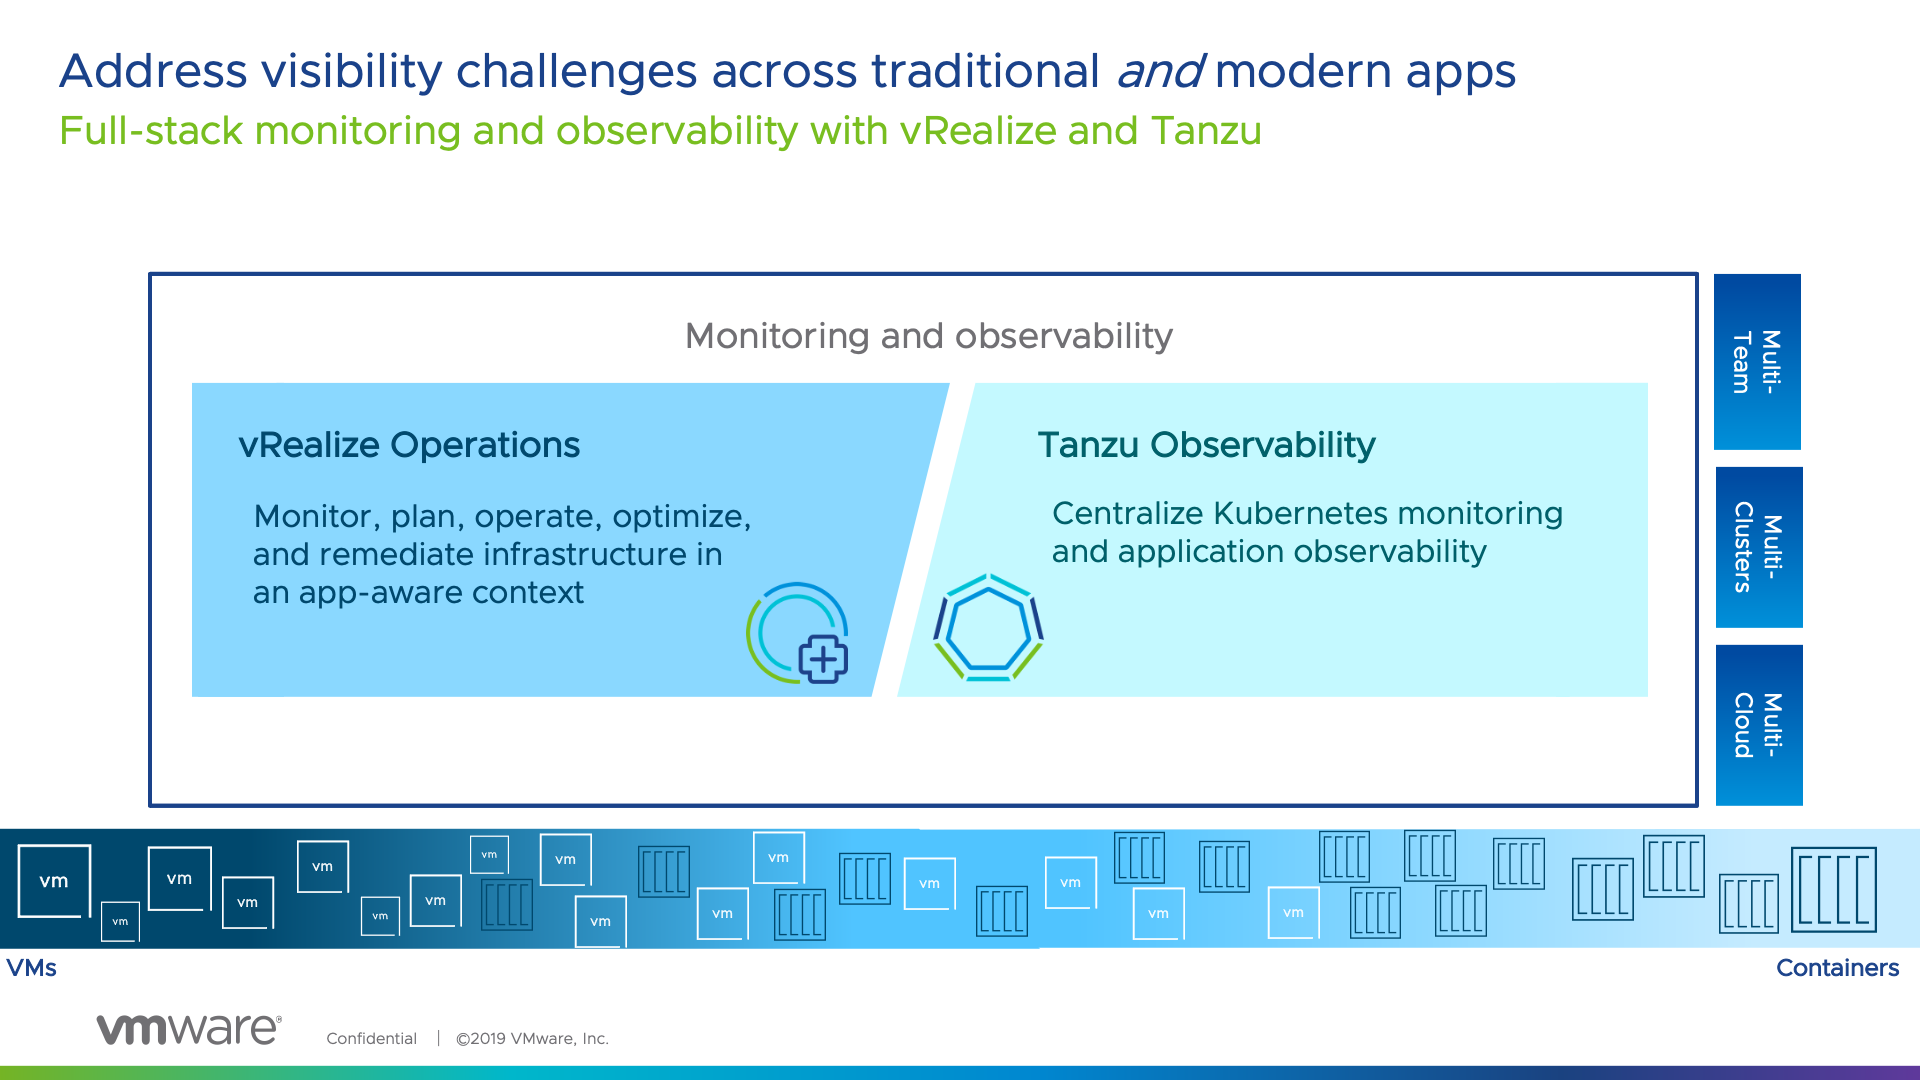
Monitoring & Observability

It is about the right tool for the right team and bringing together harmony between them. Which is why at VMware, the focus has been on covering the needs of team across the two products.

vRealize Operations is going to give you SLA metrics for your infrastructure and even application awareness. However Tanzu Observability brings more application focused features to allow you as a business, report on Application Experience of your end users/customers, at an SLA/SLO/KPI approach with extensibility to provide an Experience Level Agreement (XLA) type capability.

VMware Tanzu Observability by Wavefront delivers enterprise-grade observability and analytics at scale. Monitor everything from full-stack applications to cloud infrastructures with metrics, traces, event logs, and analytics.

High level features include:

To follow this blog, you can also easily get yourself access to Tanzu Observability.

Configuring data ingestion into Tanzu Observability using the native integrations

Configuring the OpenShift (Kubernetes) Integration using Helm

First, we need to create an API Key that we can use to connect our locally deployed wavefront services to the SaaS service to send data. Continue reading Tanzu Observability – First look at monitoring OpenShift & VMware Cloud on AWS