Category Archives: VMware

vRLI Header

VMC vCenter email alerts not supported – Workaround with vRealize Log Insight Cloud

The Issue

When configuring a VMware Cloud on AWS (VMC) SDDC vCenter, Administrators trying to use the vCenter Alerts email feature find they cannot complete the configuration, as the necessary options such as setting email server settings are greyed out.

Thanks to Bilal Ahmed for discussing this issue with me, so we could find a solution.
The Cause

Today this feature is not supported in VMware Cloud on AWS

The Workaround

By creating the vCenter Alert, even if it triggers to alert a placeholder email address. This will generate a vCenter event which is captured by vRealize Log Insight Cloud (vRLIC), the offering which is included with VMC (the freemium version included with VMC will sufficed for the workaround).

Within vRealize Log Insight you can generate an email alert from a query.

Obviously, a full monitoring suite is where you should be really heading for these types of information gathering and notifications such as vRealize Operations Cloud. However, this will suffice as a workaround where that option is not possible.

The vRealize Log Insight Cloud collects and analyzes logs generated in your SDDC.

A trial version of the vRealize Log Insight Cloud add-on is enabled by default in a new SDDC. The trial period begins when a user in your organization accesses the vRealize Log Insight Cloud add-on and expires in thirty days. After the trial period, you can choose to subscribe to this service or continue to use a subset of service features at no additional cost. 
Source
Example – Datastore Usage

You can do this for any vCenter Alarm type, but I am using datastore usage space as an example

  • First, we will create the vCenter Alarm

Continue reading VMC vCenter email alerts not supported – Workaround with vRealize Log Insight Cloud

vROPs - Kubernetes - Prometheus - Telegraf - Header

vRealize Operations – Monitoring Kubernetes with Prometheus and Telegraf

In this post, I will cover how to deploy Prometheus and the Telegraf exporter and configure so that the data can be collected by vRealize Operations.

Overview

Delivers intelligent operations management with application-to-storage visibility across physical, virtual, and cloud infrastructures. Using policy-based automation, operations teams automate key processes and improve the IT efficiency.

Is an open-source systems monitoring and alerting toolkit. Prometheus collects and stores its metrics as time series data, i.e. metrics information is stored with the timestamp at which it was recorded, alongside optional key-value pairs called labels.

There are several libraries and servers which help in exporting existing metrics from third-party systems as Prometheus metrics. This is useful for cases where it is not feasible to instrument a given system with Prometheus metrics directly (for example, HAProxy or Linux system stats).

Telegraf is a plugin-driven server agent written by the folks over at InfluxData for collecting & reporting metrics. By using the Telegraf exporter, the following Kubernetes metrics are supported:

Why do it this way with three products?

You can actually achieve this with two products (vROPs and cAdvisor for example). Using vRealize Operations and a metric exporter that the data can be grabbed from in the Kubernetes cluster. By default, Kubernetes offers little in the way of metrics data until you install an appropriate package to do so.

Many customers have now decided upon using Prometheus for their metrics needs in their Modern Applications world due to the flexibility it offers.

Therefore, this integration provides a way for vRealize Operations to collect the data through an existing Prometheus deploy and enrich the data further by providing a context-aware relationship view between your virtualisation platform and the Kubernetes platform which runs on top of it.

vRealize Operations Management Pack for Kubernetes supports a number of Prometheus exporters in which to provide the relevant data. In this blog post we will focus on Telegraf.

You can view sample deployments here for all the supported types. This blog will show you an end-to-end setup and deployment.

Prerequisites
  • Administrative access to a vRealize Operations environment
  • Access to a Kubernetes cluster that you want to monitor
  • Install Helm if you have not already got it setup on the machine which has access to your Kubernetes cluster
  • Clone this GitHub repo to your machine to make life easier
git clone https://github.com/saintdle/vrops-prometheus-telegraf.git
vrops - git clone saintdle vrops-prometheus-telegraf.git
Information Gathering

Note down the following information:

  • Cluster API Server information
kubectl cluster-info

vROPs - kubectl cluster-info

  • Access details for the Kubernetes cluster
    • Basic Authentication – Uses HTTP basic authentication to authenticate API requests through authentication plugins.
    • Client Certification Authentication – Uses client certificates to authenticate API requests through authentication plugins.
    • Token Authentication – Uses bearer tokens to authenticate API requests through authentication plugin

In this example I will be using “Client Certification Authentication” using my current authenticated user by running:

kubectl config view --minify --raw
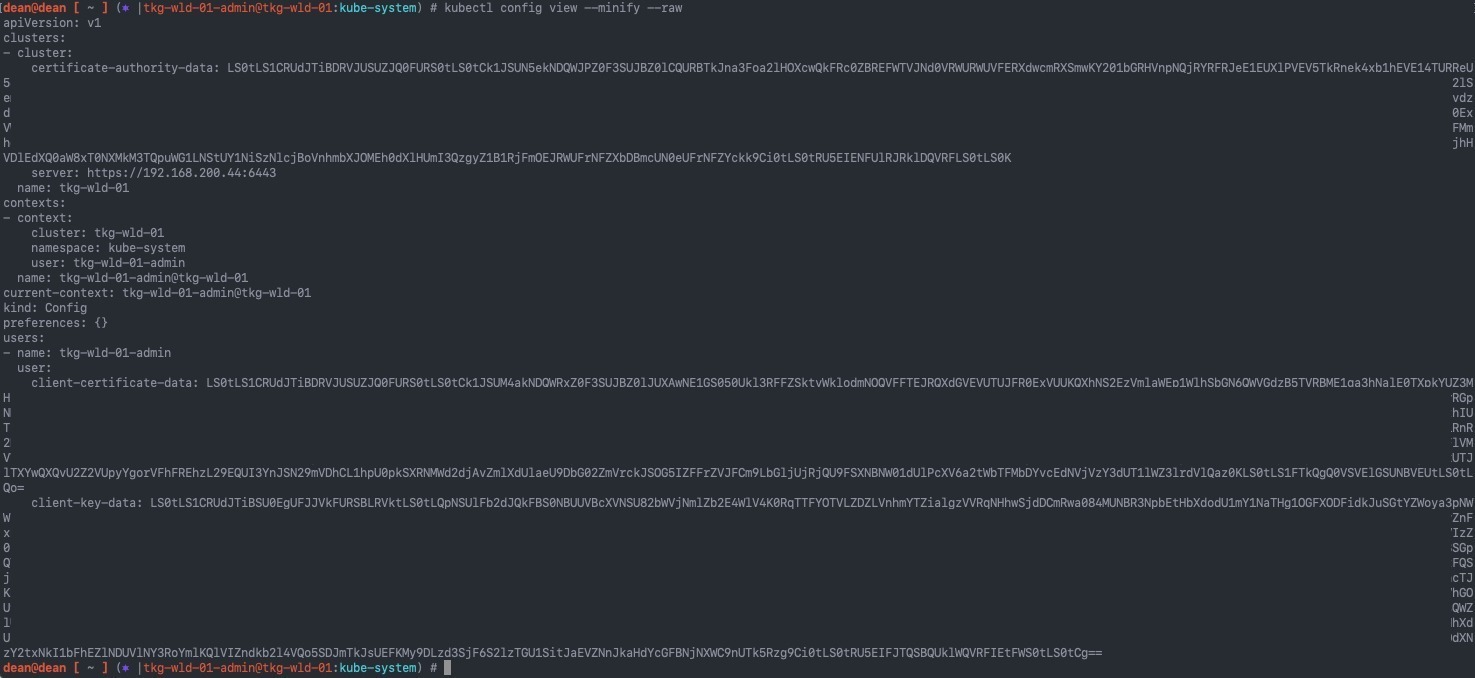
vROPs - kubectl config view --minify --raw

  • Get your node names and IP addresses
kubectl get nodes -o wide

vROPs - kubectl get nodes -o wide

Install the Telegraf Kubernetes Plugin

Continue reading vRealize Operations – Monitoring Kubernetes with Prometheus and Telegraf

vSphere and CSI Header

Upgrading the vSphere CSI Driver (Storage Container Plugin) from v2.1.0 to latest

In this post I’m just documenting the steps on how to upgrade the vSphere CSI Driver, especially if you must make a jump in versioning to the latest version.

Upgrade from pre-v2.3.0 CSI Driver version to v2.3.0

You need to figure out what version of the vSphere CSI Driver you are running.

For me it was easy as I could look up the Tanzu Kubernetes Grid release notes. Please refer to your deployment manifests in your cluster. If you are still unsure, contact VMware Support for assistance.

Then you need to find your manifests for your associated version. You can do this by viewing the releases by tag. 

Then remove the resources created by the associated manifests. Below are the commands to remove the version 2.1.0 installation of the CSI.

kubectl delete -f https://raw.githubusercontent.com/kubernetes-sigs/vsphere-csi-driver/v2.1.0/manifests/latest/vsphere-7.0u1/vanilla/deploy/vsphere-csi-controller-deployment.yaml

kubectl delete -f https://raw.githubusercontent.com/kubernetes-sigs/vsphere-csi-driver/v2.1.0/manifests/latest/vsphere-7.0u1/vanilla/deploy/vsphere-csi-node-ds.yaml

kubectl delete -f https://raw.githubusercontent.com/kubernetes-sigs/vsphere-csi-driver/v2.1.0/manifests/latest/vsphere-7.0u1/vanilla/rbac/vsphere-csi-controller-rbac.yaml

vsphere-csi - delete manifests

Now we need to create the new namespace, “vmware-system-csi”, where all new and future vSphere CSI Driver components will run. Continue reading Upgrading the vSphere CSI Driver (Storage Container Plugin) from v2.1.0 to latest

Tanzu Blog Logo Header

First Look – Setup Tanzu Build Services and rebuilding Pac-Man

This blog post will detail how to setup Tanzu Build Services in a test environment, and then create a container image from a dockerfile, fixing several vulnerabilities compared to the current container image.

What is Tanzu Build Service?
Tanzu Build Service uses the open-source Cloud Native Buildpacks project to turn application source code into container images. 

Build Service executes reproducible builds that align with modern container standards, and additionally keeps image resources up-to-date. It does so by leveraging Kubernetes infrastructure with kpack, a Cloud Native Buildpacks Platform, to orchestrate the image lifecycle. 

Build Service helps you develop and automate containerized software workflows securely and at scale.

You can read more about the Tanzu Build Services concepts here.

Pre-Reqs

Have an accessible Image Registry to both your local client and your Kubernetes cluster.

  • I used Dockerhub for my lab environment.

Install the Carvel tools.

  • kapp is a deployment tool that allows users to manage Kubernetes resources in bulk.
  • ytt is a templating tool that understands YAML structure.
  • kbld is needed to map relocated images to k8s config.
  • imgpkg is tool that relocates container images and pulls the release configuration files.
brew tap vmware-tanzu/carvel

brew install ytt kbld kapp imgpkg kwt vendir

Install the kp cli tool.

# Download from the Tanzu Network pages

chmod +x kp-linux-0.4.0 
sudo mv kp-linux-0.4.0 /usr/bin/local/kp

# Install using Brew

brew tap vmware-tanzu/kpack-cli
brew install kp

# Download from GitHub Releases Page
curl -LJO https://github.com/vmware-tanzu/kpack-cli/releases/download/v0.4.2/kp-linux-0.4.2
chmod +x kp-linux-0.4.2
sudo mv kp-linux-0.4.2 /usr/bin/local/kp
Installing Tanzu Build Services

Log in to your registry that will host the Build Services containers and be used by your Kubernetes cluster Continue reading First Look – Setup Tanzu Build Services and rebuilding Pac-Man