AWS EKS Header

Deleting AWS EKS Cluster Fails? Learn How to Fix “Cannot Evict Pod as it Violates Disruption Budget” Error

The Issue

I had to remove a demo EKS Cluster where I had screwed up an install of a Service Mesh. Unfortunately, it was left in a rather terrible state to clean up, hence the need to just delete it.

When I tried the usual eksctl delete command, including with the force argument, I was hitting errors such as:

2021-12-21 23:52:22 [!] pod eviction error ("error evicting pod: istio-system/istiod-76f699dc48-tgc6m: Cannot evict pod as it would violate the pod's disruption budget.") on node ip-192-168-27-182.us-east-2.compute.internal

With a final error output of:

Error: Unauthorized

eksctl delete cluster - Cannot evict pod as it would violate the pod's disruption budget - Error Unauthorized

The Cause

Well, the error message does call out the cause, moving the existing pods to other nodes is failing due to the configured settings. Essentially EKS will try and drain all the nodes and shut everything down nicely when it deletes the cluster. It doesn’t just shut everything down and wipe it. This is because inside of Kubernetes there are several finalizers that will call out actions to interact with AWS components (thanks to the integrations) and nicely clean things up (in theory).

To get around this, I first tried the following command, thinking if delete the nodegroup without waiting for a drain, this would bypass the issue:

 eksctl delete nodegroup standard --cluster veducate-eks --drain=false --disable-eviction

This didn’t allow me to delete the cluster however, I still got the same error messages.

The Fix

So back to the error message, and then I realised it was staring me in the face!

Cannot evict pod as it would violate the pod's disruption budget

What is a Pod Disruption Budget? It’s essentially a way to ensure availability of your pods from someone killing them accidentality.

A PDB limits the number of Pods of a replicated application that are down simultaneously from voluntary disruptions. For example, a quorum-based application would like to ensure that the number of replicas running is never brought below the number needed for a quorum. A web front end might want to ensure that the number of replicas serving load never falls below a certain percentage of the total.

To find all configured Pod Disruption Budgets:

kubectl get poddisruptionbudget -A

Then delete as necessary:

kubectl delete poddisruptionbudget {name} -n {namespace}

eks - kubectl get poddisruptionbudgets -A - kubectl delete poddisruptionbudgets

Finally, you should be able to delete your cluster.

eksctl delete cluster - successful


Regards

Dean Lewis

Helm Pac-Man Header

Creating and hosting a Helm Chart package to install Pac-Man on Kubernetes

If you’ve have been following any of my blogs that relate to Kubernetes, I am sure that you will have seen the use of my demo application Pac-Man, designed to replicate a small production application with a front end UI service, DB back end service and load balancing service.

If not, you can find it here:

In this blog post, I am going to cover how I create a Helm Chart package to install the application on a Kubernetes cluster, and then host it on GitHub so that it can be re-used as necessary between different clusters.

This was on my to-do list for quite a while, as I wanted to explore Helm in more detail and understand how the charts work. What better way to do this than create my own?

What is Helm and why use it?

Helm is a tool that simplifies the installation and lifecycle of Kubernetes applications. As an example, it is a little bit like Brew or Yum for Linux.

Helm uses a package format called charts; these charts are a collection of files that describe a related set of Kubernetes resources. These charts can range from the simple, deploy a single pod, deployment set, etc, to the complex, deploy a full application made up of Deployments, StatefulSets, PVCs, Ingress, etc.

Helm has become over the years one of the defacto client tools to use for simplification of deploying an application to your Kubernetes environment. Take Kasten for example, to deploy their K10 software, their guide gives you only the Helm commands to do so.

You can install Helm from the below script, for other methods please see their official documentation.

curl -fsSL -o get_helm.sh https://raw.githubusercontent.com/helm/helm/main/scripts/get-helm-3

chmod 700 get_helm.sh

./get_helm.sh
Creating a template Helm Chart

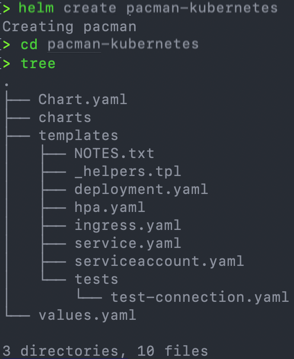
The Helm Client makes it easy to get started from scratch, you can create a template chart by running the following command, which creates a folder of the name you specify, with a number of example files you can use.

helm create {name}

# For this blog post I ran the following

helm create pacman-kubernetes

helm create pacman-kubernetes

In more detail, this structure offers the following: Continue reading Creating and hosting a Helm Chart package to install Pac-Man on Kubernetes

Tanzu Nvidia Header

Deploying Nvidia GPU enabled Tanzu Kubernetes Clusters

In this blog post I’m going to detail how deploy and configure a Nvidia GPU enabled Tanzu Kubernetes Grid cluster in AWS. The method will be similar for Azure, for vSphere there are a number of additional steps to prepare the system. I’m going to essentially follow the official documentation, then run some of the Nvidia tests. Like always, it’s good to get a visual reference and such for these kinds of deployments.

Pre-Reqs
  • Nvidia today only support Ubuntu deployed images in relation to a TKG deployment
  • For this blog I’ve already deployed my TKG Management cluster in AWS
Deploy a GPU enabled workload cluster

It’s simple, just deploy a workload cluster that for the compute plane nodes (workers) that uses a GPU enabled instance.

You can create a new cluster YAML file from scratch, or clone one of your existing located in:

~/.config/tanzu/tkg/clusterconfigs

Below are the four main values you will need to change. As mentioned above, you need a GPU enabled instance, and for the OS to be Ubuntu. The OS version will default if not set to 20.04.

CONTROL_PLANE_MACHINE_TYPE: t3.large
NODE_MACHINE_TYPE: g4dn.xlarge
OS_ARCH: amd64
OS_NAME: ubuntu
OS_VERSION: "20.04

The rest of the file you configure as you would for any workload cluster deployment. Continue reading Deploying Nvidia GPU enabled Tanzu Kubernetes Clusters

vRLI Header

VMC vCenter email alerts not supported – Workaround with vRealize Log Insight Cloud

The Issue

When configuring a VMware Cloud on AWS (VMC) SDDC vCenter, Administrators trying to use the vCenter Alerts email feature find they cannot complete the configuration, as the necessary options such as setting email server settings are greyed out.

Thanks to Bilal Ahmed for discussing this issue with me, so we could find a solution.
The Cause

Today this feature is not supported in VMware Cloud on AWS

The Workaround

By creating the vCenter Alert, even if it triggers to alert a placeholder email address. This will generate a vCenter event which is captured by vRealize Log Insight Cloud (vRLIC), the offering which is included with VMC (the freemium version included with VMC will sufficed for the workaround).

Within vRealize Log Insight you can generate an email alert from a query.

Obviously, a full monitoring suite is where you should be really heading for these types of information gathering and notifications such as vRealize Operations Cloud. However, this will suffice as a workaround where that option is not possible.

The vRealize Log Insight Cloud collects and analyzes logs generated in your SDDC.

A trial version of the vRealize Log Insight Cloud add-on is enabled by default in a new SDDC. The trial period begins when a user in your organization accesses the vRealize Log Insight Cloud add-on and expires in thirty days. After the trial period, you can choose to subscribe to this service or continue to use a subset of service features at no additional cost. 
Source
Example – Datastore Usage

You can do this for any vCenter Alarm type, but I am using datastore usage space as an example

  • First, we will create the vCenter Alarm

Continue reading VMC vCenter email alerts not supported – Workaround with vRealize Log Insight Cloud

vROPs - Kubernetes - Prometheus - Telegraf - Header

vRealize Operations – Monitoring Kubernetes with Prometheus and Telegraf

In this post, I will cover how to deploy Prometheus and the Telegraf exporter and configure so that the data can be collected by vRealize Operations.

Overview

Delivers intelligent operations management with application-to-storage visibility across physical, virtual, and cloud infrastructures. Using policy-based automation, operations teams automate key processes and improve the IT efficiency.

Is an open-source systems monitoring and alerting toolkit. Prometheus collects and stores its metrics as time series data, i.e. metrics information is stored with the timestamp at which it was recorded, alongside optional key-value pairs called labels.

There are several libraries and servers which help in exporting existing metrics from third-party systems as Prometheus metrics. This is useful for cases where it is not feasible to instrument a given system with Prometheus metrics directly (for example, HAProxy or Linux system stats).

Telegraf is a plugin-driven server agent written by the folks over at InfluxData for collecting & reporting metrics. By using the Telegraf exporter, the following Kubernetes metrics are supported:

Why do it this way with three products?

You can actually achieve this with two products (vROPs and cAdvisor for example). Using vRealize Operations and a metric exporter that the data can be grabbed from in the Kubernetes cluster. By default, Kubernetes offers little in the way of metrics data until you install an appropriate package to do so.

Many customers have now decided upon using Prometheus for their metrics needs in their Modern Applications world due to the flexibility it offers.

Therefore, this integration provides a way for vRealize Operations to collect the data through an existing Prometheus deploy and enrich the data further by providing a context-aware relationship view between your virtualisation platform and the Kubernetes platform which runs on top of it.

vRealize Operations Management Pack for Kubernetes supports a number of Prometheus exporters in which to provide the relevant data. In this blog post we will focus on Telegraf.

You can view sample deployments here for all the supported types. This blog will show you an end-to-end setup and deployment.

Prerequisites
  • Administrative access to a vRealize Operations environment
  • Access to a Kubernetes cluster that you want to monitor
  • Install Helm if you have not already got it setup on the machine which has access to your Kubernetes cluster
  • Clone this GitHub repo to your machine to make life easier
git clone https://github.com/saintdle/vrops-prometheus-telegraf.git
vrops - git clone saintdle vrops-prometheus-telegraf.git
Information Gathering

Note down the following information:

  • Cluster API Server information
kubectl cluster-info

vROPs - kubectl cluster-info

  • Access details for the Kubernetes cluster
    • Basic Authentication – Uses HTTP basic authentication to authenticate API requests through authentication plugins.
    • Client Certification Authentication – Uses client certificates to authenticate API requests through authentication plugins.
    • Token Authentication – Uses bearer tokens to authenticate API requests through authentication plugin

In this example I will be using “Client Certification Authentication” using my current authenticated user by running:

kubectl config view --minify --raw

vROPs - kubectl config view --minify --raw

  • Get your node names and IP addresses
kubectl get nodes -o wide

vROPs - kubectl get nodes -o wide

Install the Telegraf Kubernetes Plugin

Continue reading vRealize Operations – Monitoring Kubernetes with Prometheus and Telegraf