Category Archives: Kubernetes

Tanzu Blog Logo Header

Tanzu Service Mesh – Monitor Service Level Objectives and Configure Service Autoscaling

Continuing from the First Look blog post, where we created a distributed application between different public cloud Kubernetes deployments and connected them via Tanzu Service Mesh. We will move onto some of the more advanced capabilities of Tanzu Service Mesh.

In this blog post, we’ll look at how we can setup monitoring of our application components and performance against a Service Level Objective, and then how Tanzu Mission Control and action against violations of the SLO using auto-scaling capabilities.

What is a Service Level Objective and how do we monitor our app?

Service level objectives (SLO/s) provide a structured way to describe, measure, and monitor the performance, quality, and reliability of micro-service apps.

A SLO is used to describe the high-level objective for acceptable operation and health of one or more services over a length of time (for example, a week or a month).

  • For example, Service X should be healthy 99.1% of the time.

In the provided example, Service X can be “unhealthy” 1% of the time, which is considered an “Error Budget”. This allows for downtime for errors that are acceptable (keeping an app up 100% of the time is hard and expensive to achieve), or for the likes of planned routine maintenance.

The key is the specification of which metrics or characteristics, and associated thresholds are used to define the health of the micro-service/application.

  • For example:
    • Error rate is less than 2%
    • CPU Average is Less than 80%

This specification makes up the Service Level Indicator (SLI/s), of which one or multiple can be used to define an overall SLO.

Tanzu Service Mesh SLOs options

Before we configure, let’s quickly discuss what is available to be configured.

Tanzu Service Mesh (TSM) offers two SLO configurations:

  • Monitored SLOs
    • These provide alerting/indicators on performance of your services and if they meet your target SLO conditions based on the configured SLIs for each specified service.
    • This kind of SLO can be configured for Services that are part of a Global Namespace (GNS-scoped SLOs) or services that are part of a direct cluster (org-scoped SLOs).
  • Actionable SLOs
    • These extend the capabilities of Monitored SLOs by providing capabilities such as auto-scaling for services based on the SLIs.
    • This kind of SLO can only be configured for services inside a Global Namespace (GNS-scoped SLO).
    • Each actionable SLO can have only have one service, and a service can only have one actionable SLO.

The official documentation also takes you through some use-cases for SLOs. Alternatively, you can continue to follow this blog post for an example.

Quick overview of the demo environment
  • Tanzu Service Mesh (of course)
    • Global Namespace configured for default namespace in clusters with domain “app.sample.com”
  • Three Kubernetes Clusters with a scaled-out application deployed
    • AWS EKS Cluster
      • Running web front end (shopping) and cart instances
    • Azure AKS Cluster
      • Running Catalog Service that holds all the images for the Web front end
    • GCP GKE
      • Running full copy of the application

In this environment, I’m going to configure a SLO which is focused on the Front-End Service – Shopping, and will scale up the number of pods when the SLIs are breached.

Configure a SLO Policy and Autoscaler
  • Under the Policies header, expand
  • Select “SLOs”
  • Select either New Policy options
Continue reading Tanzu Service Mesh – Monitor Service Level Objectives and Configure Service Autoscaling

gke header

GKE – User cannot create resource – requires one of [“container.roles.create”] permission(s)

The Issue

I stood up my first ever GKE cluster! Woo, go me!

However when I was trying to setup Tanzu Service Mesh, I hit issues such as:

Error from server (Forbidden): error when creating "operator-deployment.yaml": roles.rbac.authorization.k8s.io is forbidden: User "[email protected]" cannot create resource "roles" in API group "rbac.authorization.k8s.io" in the namespace "vmware-system-tsm": requires one of ["container.roles.create"] permission(s).
The Cause

This is because your initial Kubernetes login has no cluster level permissions, due to the RBAC setup.

The Fix

You need to create some new Cluster Level roles and bind to them with your account, or use the existing ones.

As this is a demo environment. I just bound my account to the out-of-the-box cluster-admin ClusterLevelRole (that is a mouthful!).

kubectl create clusterrolebinding cluster-admin-binding \
--clusterrole=cluster-admin \
--user=[gcp user email]

# Example
kubectl create clusterrolebinding cluster-admin-binding \
--clusterrole=cluster-admin \
[email protected]

If you need to double check with google account you are using, you can run:

gcloud info | grep Account

Regards

Dean Lewis

Red Hat OpenShift + VMware Header

OpenShift 4.10 on VMware – Introducing the out-of-the-box vSphere CSI Driver installation

OpenShift Container Platform defaults to using an in-tree (non-CSI) plug-in to provision vSphere storage.

What’s New?

In OpenShift 4.9, the out-of-the-box installation of the vSphere CSI driver was tech preview. This has now moved to GA!

This means during an Installer-Provisioned-Installation cluster bring up, the vSphere CSI driver will be enabled.

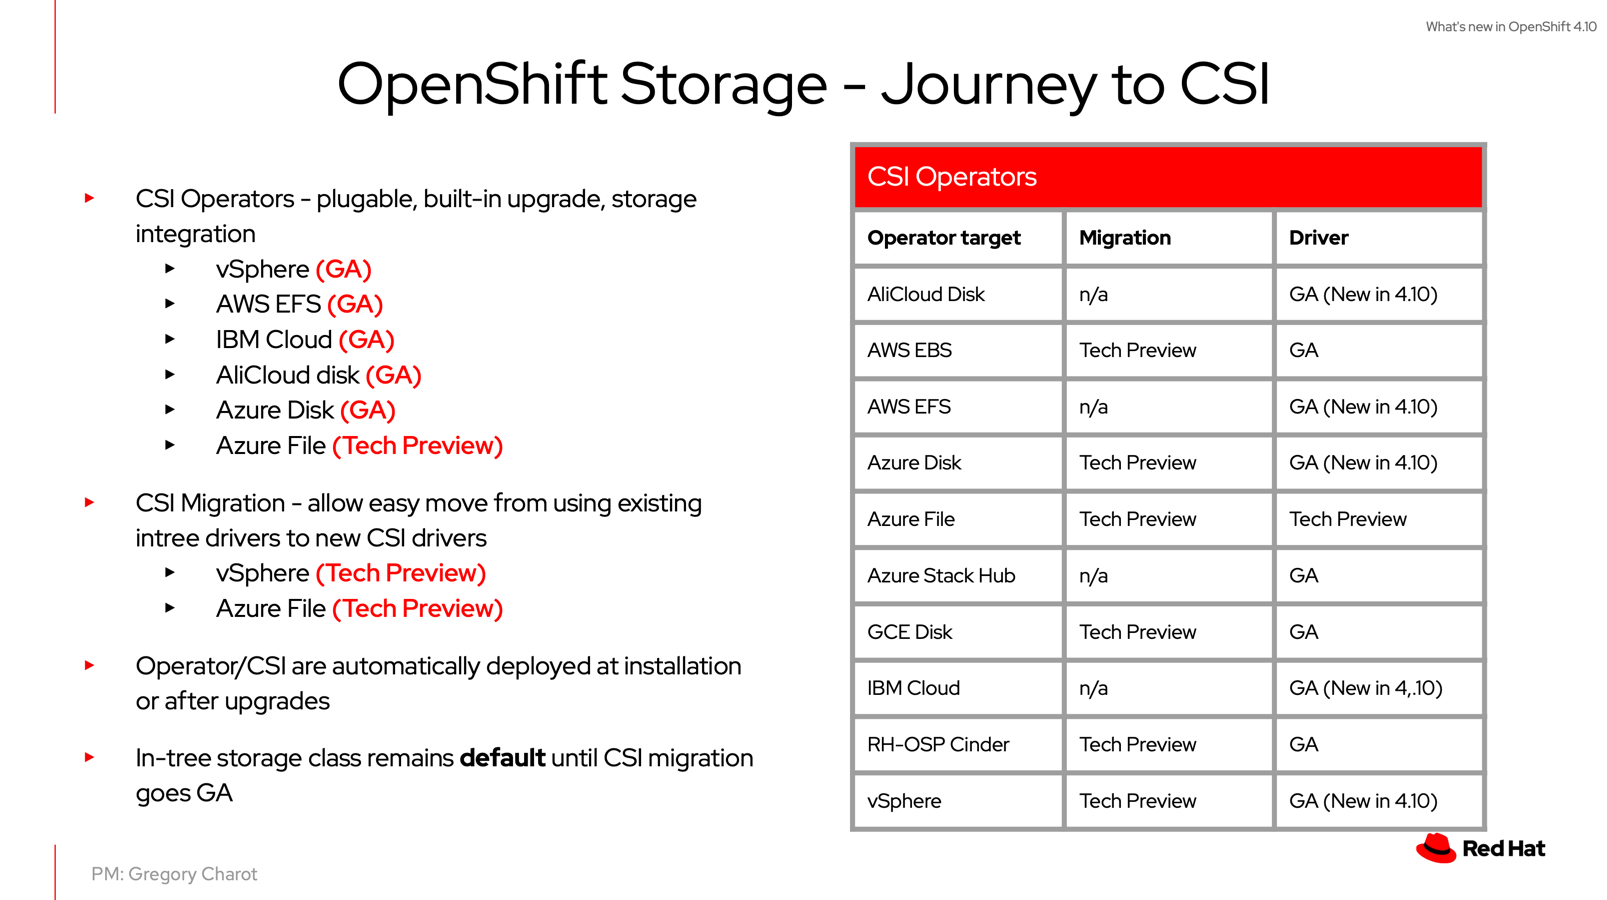
This is part of the future “journey” of OpenShift to CSI drivers. As you may be aware, the original storage implementations “in-tree” drivers will be removed from future versions of Kubernetes, making way for the CSI Drivers, a better storage integration implementation.

OpenShift Storage - Journey to CSI

Therefore, the Red Hat team have been working with the upstream native vSphere CSI Driver, which is open-source and VMware Storage team, to integrating into the OpenShift installation.

The aim here is two-fold, take further advantage of the VMware platform, and to enable CSI Migration. So that is easier for customers to migrate their existing persistent data from in-tree provisioned storage constructs to CSI provisioned constructs.

How do I enable this?

Continue reading OpenShift 4.10 on VMware – Introducing the out-of-the-box vSphere CSI Driver installation

Tanzu Observability Header

Tanzu Observability – First look at monitoring OpenShift & VMware Cloud on AWS

Recently, I was involved in some work to assist the VMware Tanzu Observability team to assist them in updating their deliverables for OpenShift. Now it’s generally available, I found some time to test it out in my lab.

For this blog post, I am going to pull in metrics from my VMware Cloud on AWS environment and the Red Hat OpenShift Cluster which is deployed upon it.

What is Tanzu Observability?

We should probably start with what is Observability, I could re-create the wheel, but instead VMware has you covered with this helpful page.

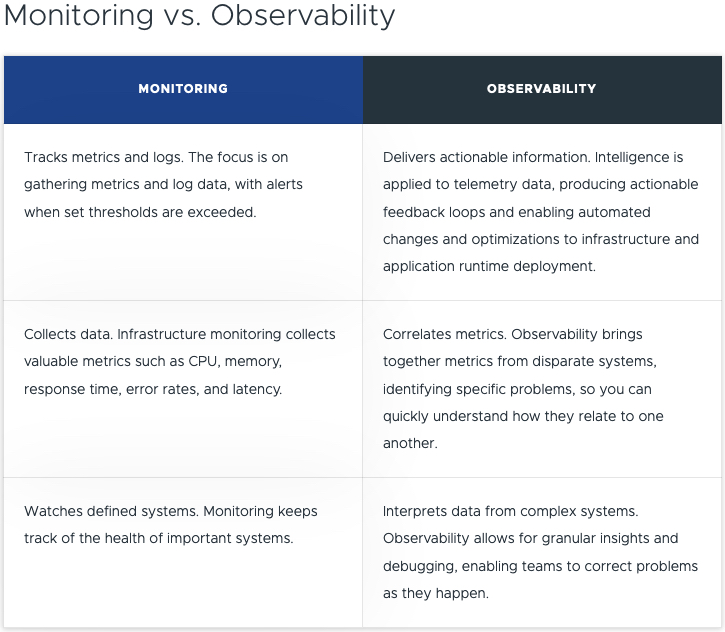
Below is the shortened table comparison.

Monitoring vs. Observability

As a developer you want to focus on developing the application, but you also do need to understand the rest of the stack to a point. In the middle, you have a Site Reliability Engineer (SRE), who covers the platform itself, and availability to ensure the app runs as best it can. And finally, we have the platform owner, where the applications and other services are located.

Somewhere in the middle, when it comes to tooling, you need to cover an example of the areas listed below:

  • Application Observability & Root Cause Analysis
    • App-aware Troubleshooting & Root Cause Analysis
  • Distributed Tracing
  • CI/CD Monitoring
  • Analytics with Query Language and high reliability, granularity, cardinality, and retention
  • Full-Stack Apps & Infra Telemetry as a Service
  • Infra Monitoring
    • Performance Optimization
    • Capacity and Cost Optimization
    • Configuration and Compliance

So now you are thinking, OK, but VMware has vRealize Operations that gives me a lot of data, so why is there a new product for this?

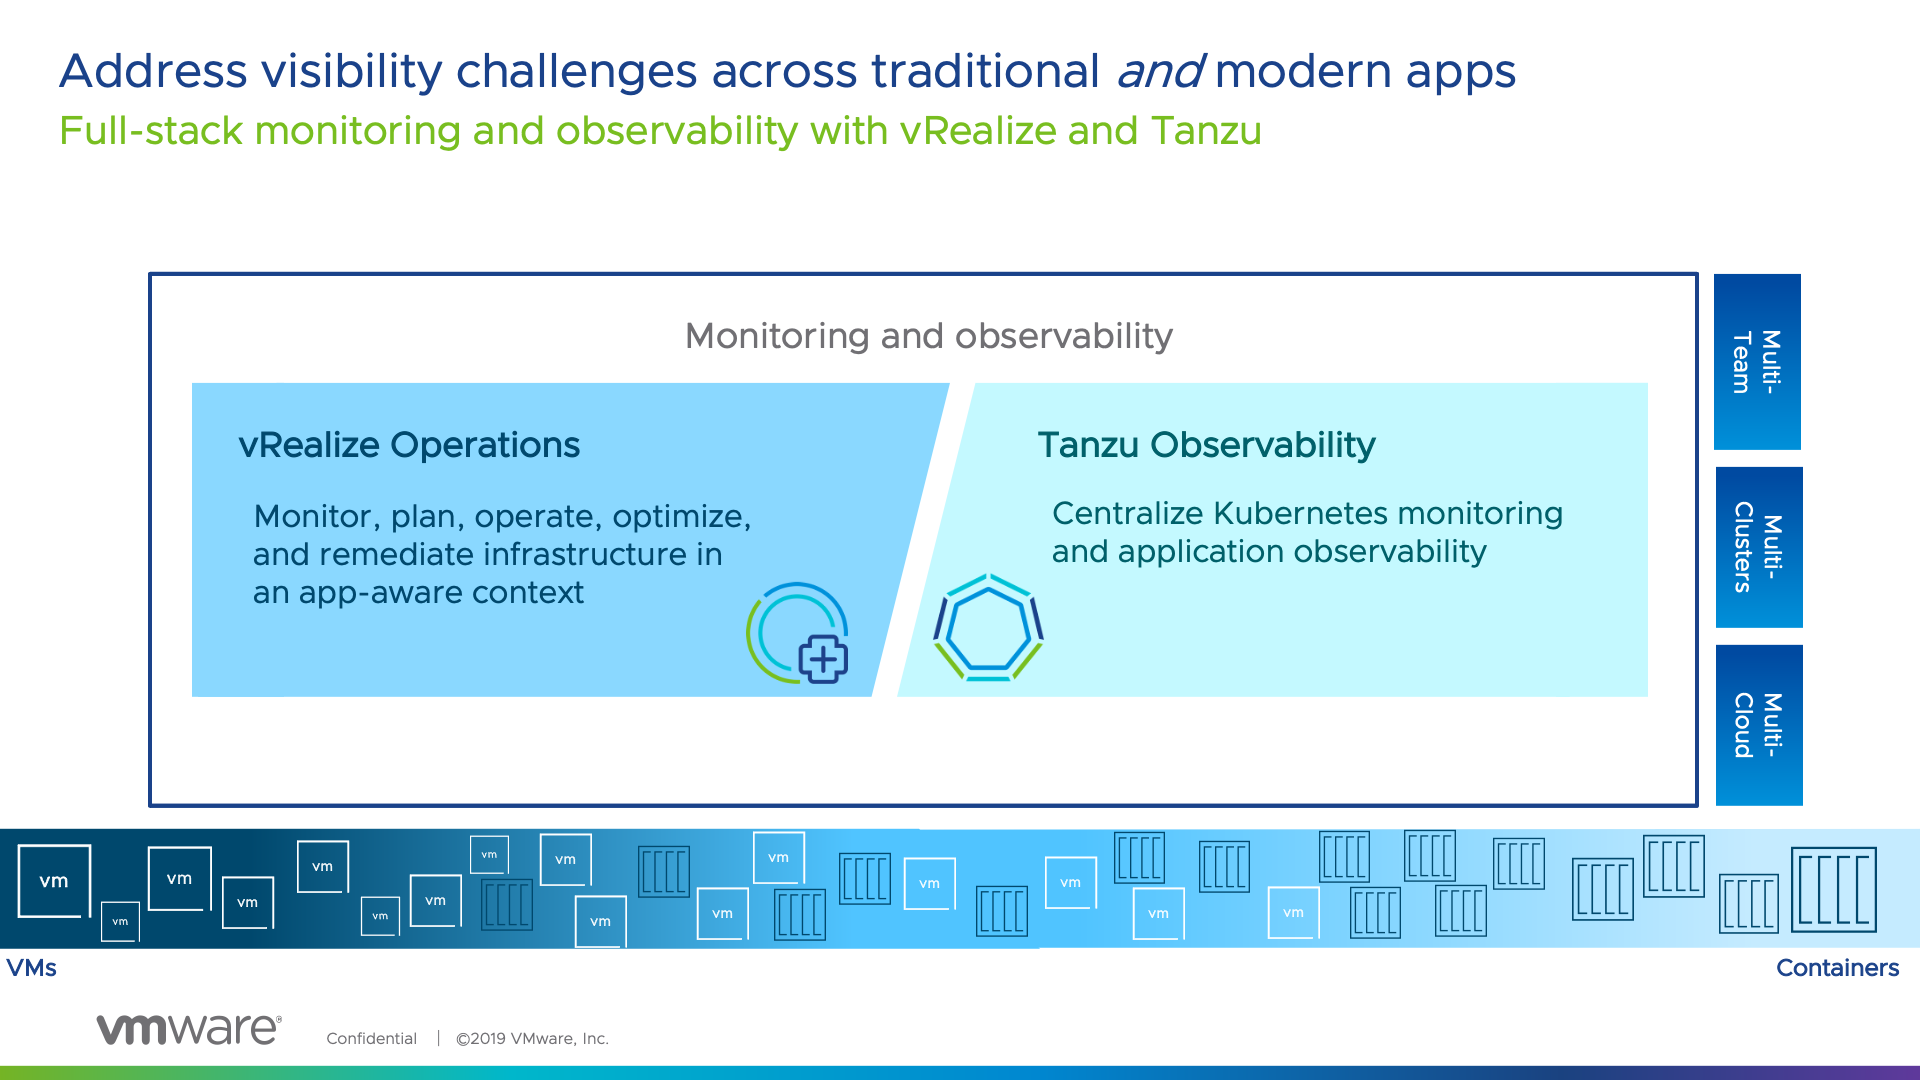
vRealize Operations and Tanzu Observability come together – delivering full stack monitoring and observability from both the infra-up and app-down perspective, equipping both teams in the org to meet common goals.

Monitoring & Observability

It is about the right tool for the right team and bringing together harmony between them. Which is why at VMware, the focus has been on covering the needs of team across the two products.

vRealize Operations is going to give you SLA metrics for your infrastructure and even application awareness. However Tanzu Observability brings more application focused features to allow you as a business, report on Application Experience of your end users/customers, at an SLA/SLO/KPI approach with extensibility to provide an Experience Level Agreement (XLA) type capability.

VMware Tanzu Observability by Wavefront delivers enterprise-grade observability and analytics at scale. Monitor everything from full-stack applications to cloud infrastructures with metrics, traces, event logs, and analytics.

High level features include:

To follow this blog, you can also easily get yourself access to Tanzu Observability.

Configuring data ingestion into Tanzu Observability using the native integrations

Configuring the OpenShift (Kubernetes) Integration using Helm

First, we need to create an API Key that we can use to connect our locally deployed wavefront services to the SaaS service to send data. Continue reading Tanzu Observability – First look at monitoring OpenShift & VMware Cloud on AWS

vRealize Automation - VMware Tanzu Header

Deploying vSphere with Tanzu Clusters using vRA and Cluster Plans

In this blog post I am covering the vRealize Automation native feature that allows you to deploy Tanzu clusters via the Tanzu Kubernetes Grid Service of vCenter.

If you have been following my posts in 2021, I wrote a blog and presented as part of VMworld on how to deploy Tanzu Clusters using vRA Code Stream, due to the lack of native integration.

Now you have either option!

Pre-requisites
  • A working vSphere with Tanzu setup
  • Create a Supervisor Namespace that we can deploy clusters into
    • vRA requires an existing Supervisor namespace to deploy clusters into, despite the separate capability that vRA can create Supervisor namespaces via a Cloud Template
    • This namespace needs a VM Class and Storage Policy to be attached.
Configuring the vRealize Automation Infrastructure settings
  • Create a Cloud Account for your vCenter
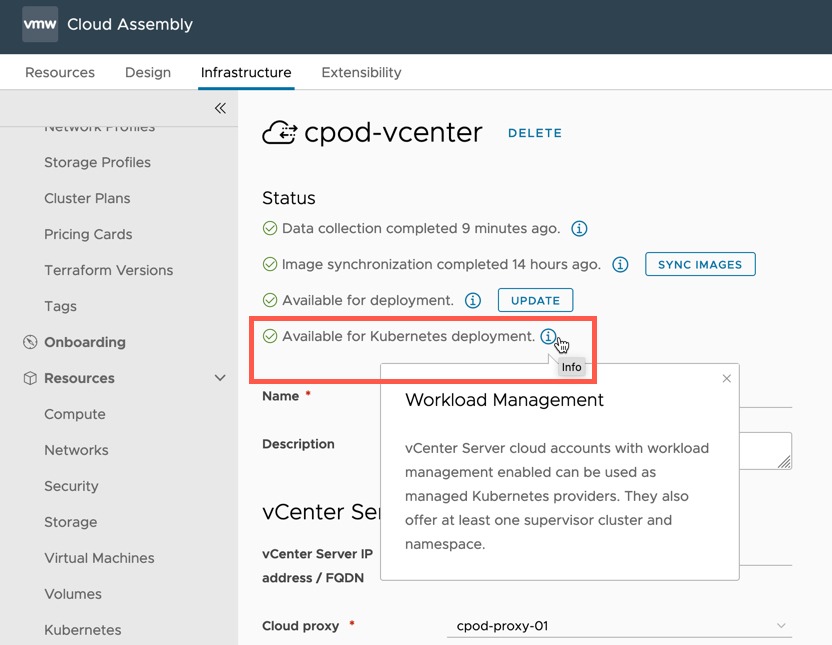
    • Ensure that once the data collection has run, the account shows “Available for Kubernetes deployment”

vRA - Cloud Account - vCenter - Available for Kubernetes deployment

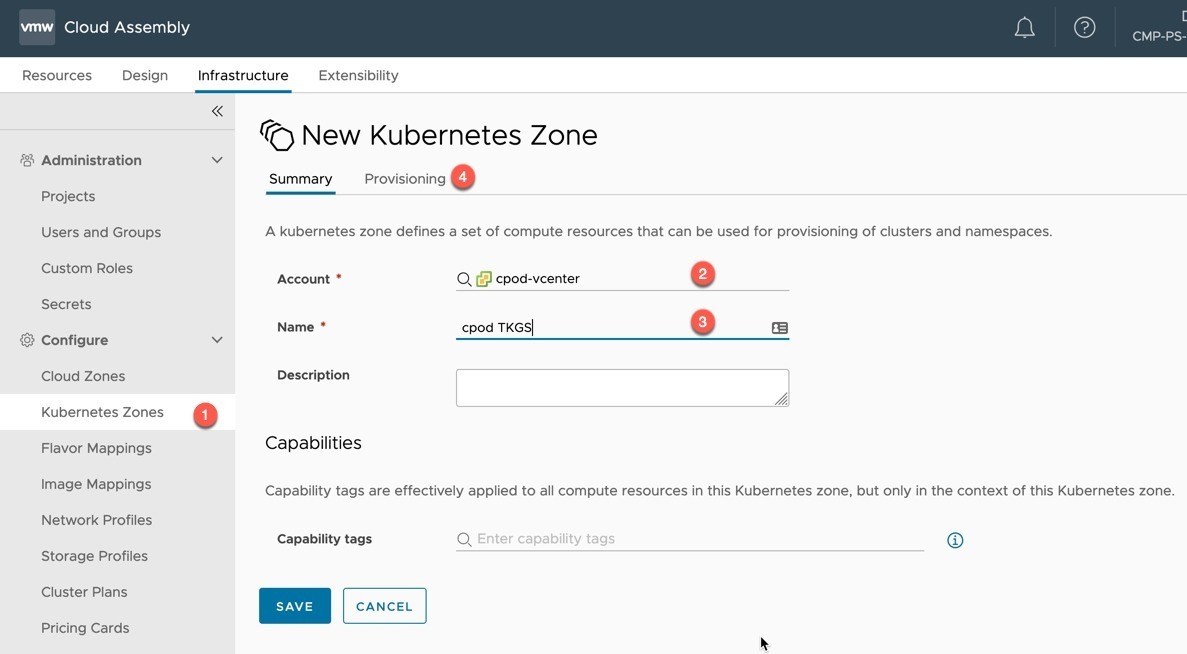
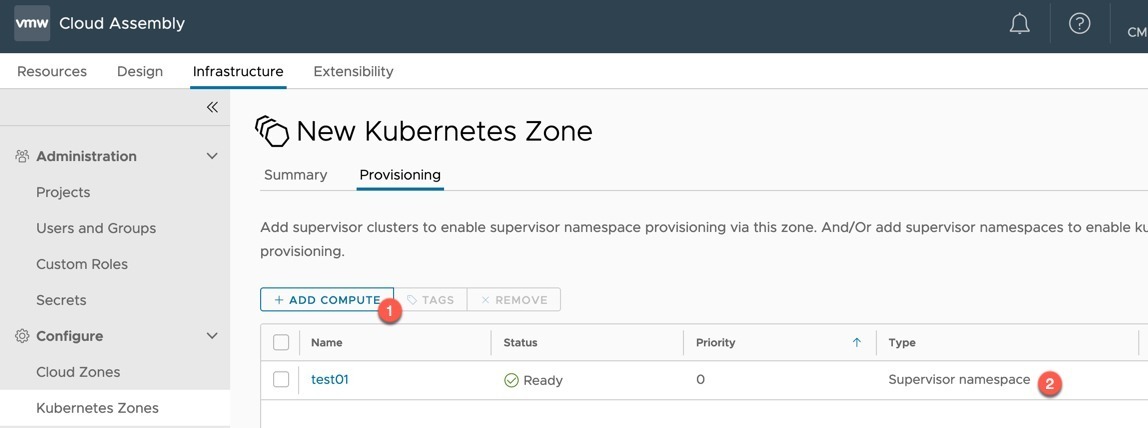
  • Create a new Kubernetes Zone
    • Select your Cloud Account linked vCenter
    • Provide a name
  • Select the Provisioning tab

vRA - New Kubernetes Zone

  • Click to add compute to the zone.
    • For the Tanzu Cluster deployment, this needs to be into existing Supervisor namespaces (as in the pre-reqs).
    • Add your existing Supervisor namespaces you are interested in using

You can add the Supervisor cluster itself, but it won’t be used in this feature walk-through. If you have multiple Supervisor namespaces, I recommend tagging them in this view. So that you can use it as a constraint tag in the Cloud Template.

vRA - New Kubernetes Zone - Provisioning

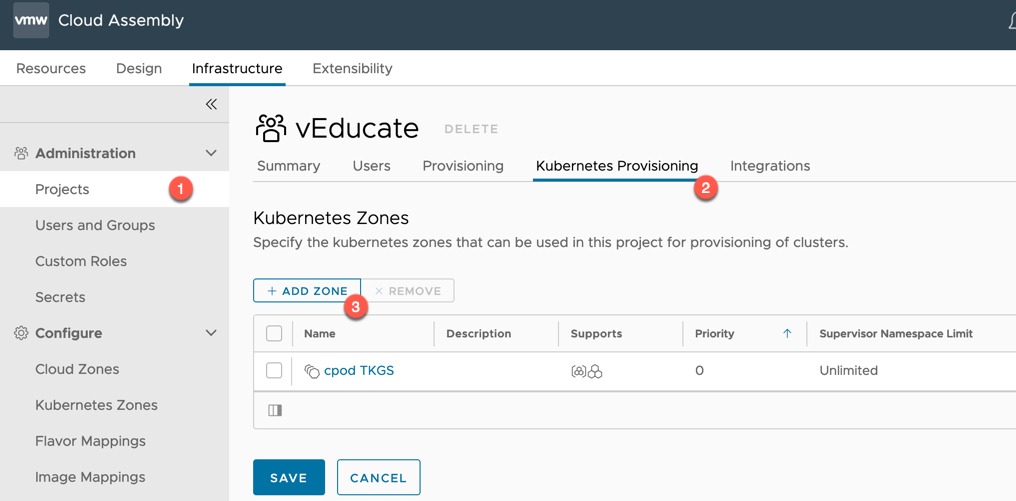
  • Click Projects, select your chosen project
  • Select the Kubernetes Provisioning tab
  • Add your Kubernetes Zone

vRA - Projects - Kubernetes Provisioning

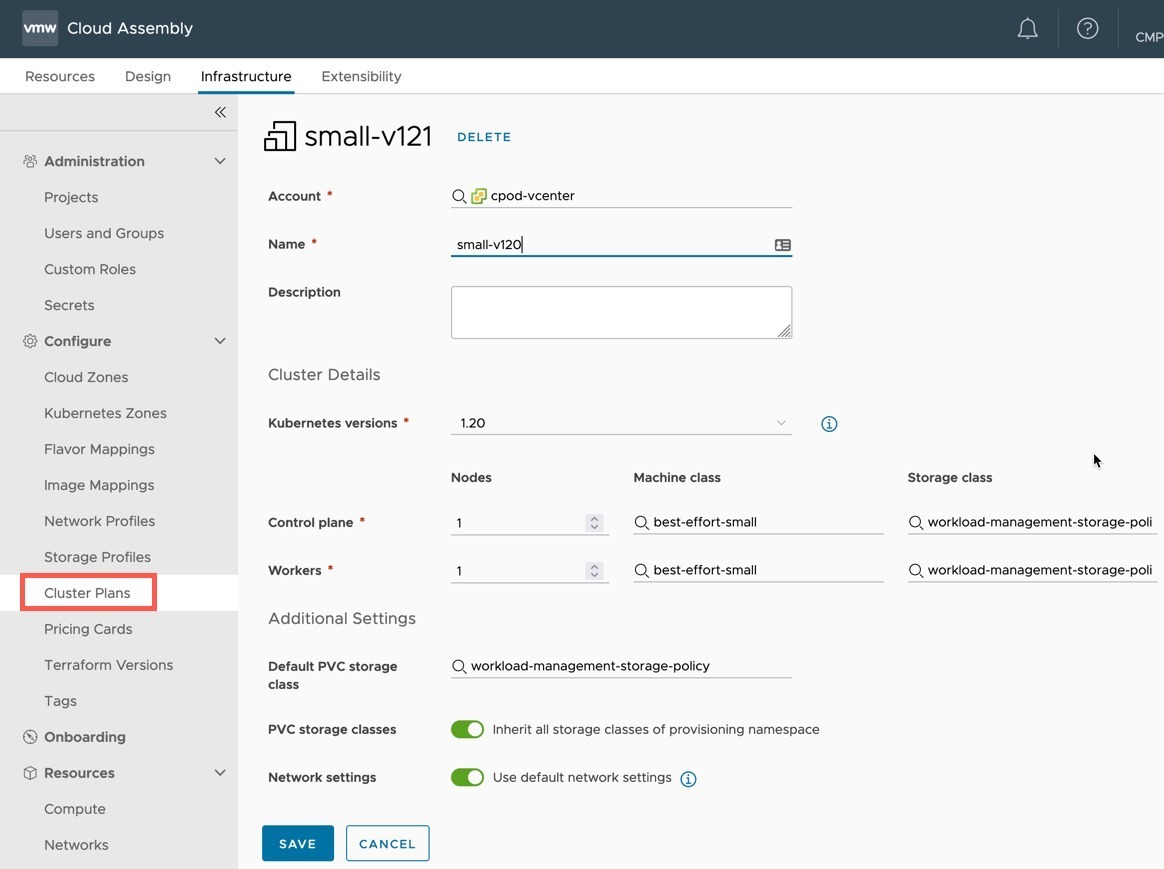
  • Click Cluster Plans under Configure heading
  • Create a new Cluster Plan with your specification
    • Select the vCenter Account it will apply to
    • Provide a name (a-z,A-Z,0-9,-)
      • The UI will allow you to input characters that are not supported on the Cloud Template for name property
    • Select your Kubernetes version to deploy
    • Number of Nodes for Control and Worker nodes
    • The Machine Class (VM Class on the Supervisor Namespace) for each Node Type
      • You will be able to select from the VM classes added at the Supervisor namespace in vCenter
    • Select the Storage Class for each Node Type
    • Select the default PVC storage class in the cluster
    • Enable/disable including all Supervisor Namespace storage classes
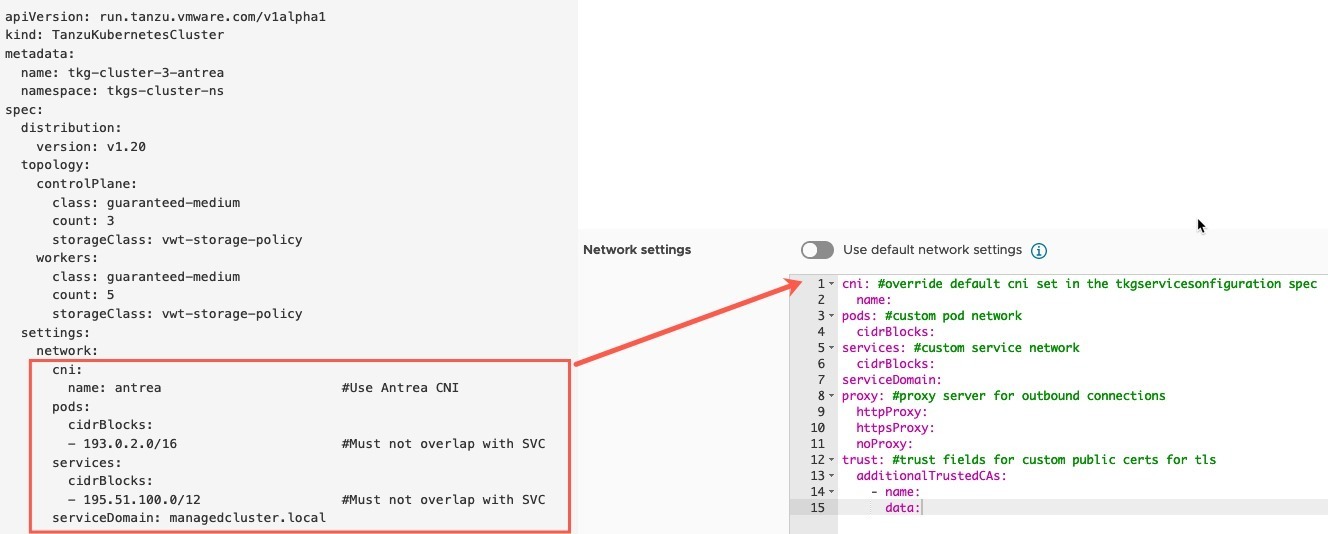
    • Choose either default networking deployment for clusters or provide your own specification.

vRA - Cluster Plans

Regarding the network settings, below in the image I have highlighted how the Tanzu Kubernetes Grid Service v1alpha1 API YAML format for a cluster creation request maps across to the settings expected by vRA.

You can find further examples here.

vRA - Cluster Plans - Network Settings

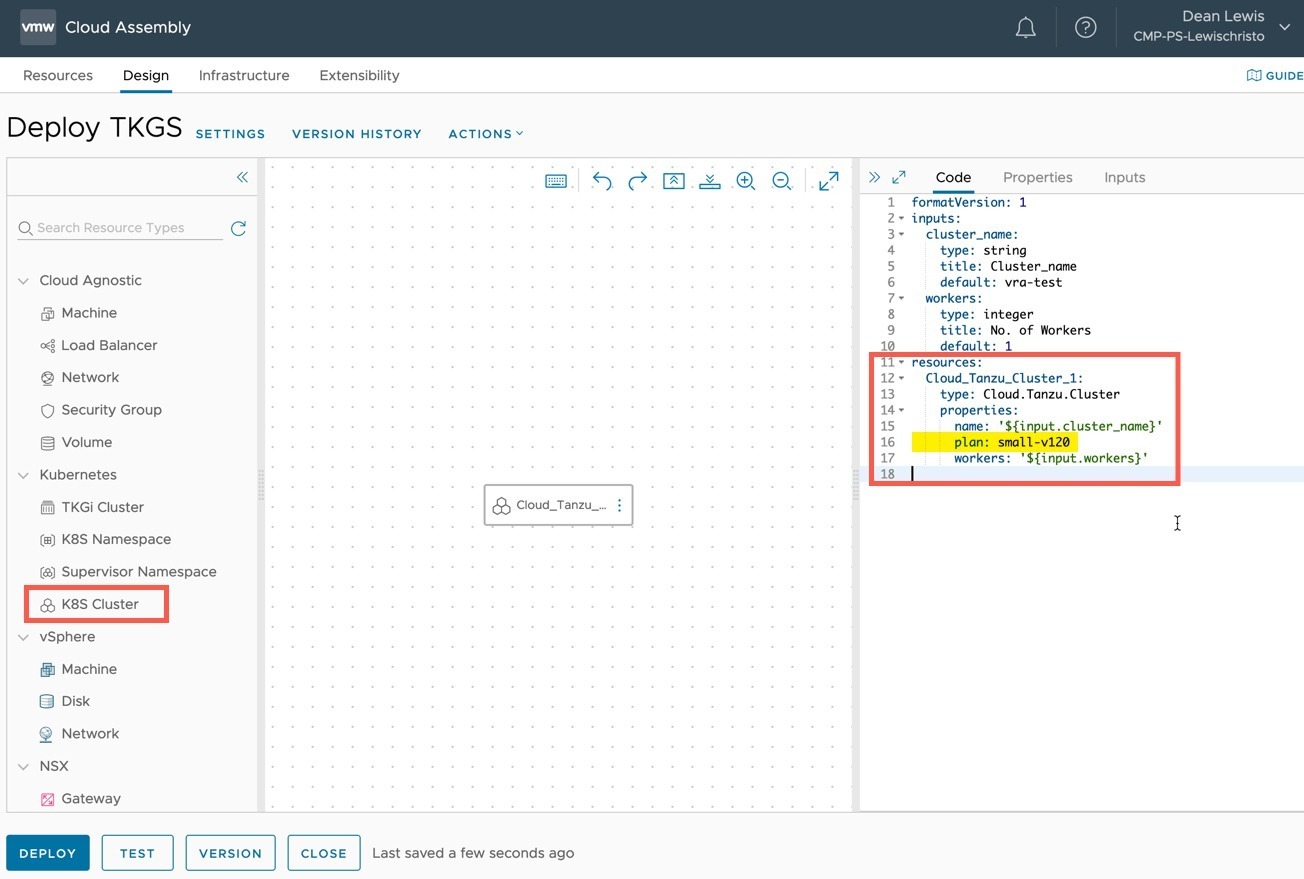
  • Create a Cloud Template
  • Place the “K8s Cluster” resource object on your canvas
  • Configure the properties as needed
    • The workers property will override the workers number in the Cluster Plan

Below is the example I used.

formatVersion: 1
inputs:
  cluster_name:
    type: string
    title: Cluster_name
    default: vra-test
  workers:
    type: integer
    title: No. of Workers
    default: 1
resources:
  Cloud_Tanzu_Cluster_1:
    type: Cloud.Tanzu.Cluster
    properties:
      name: '${input.cluster_name}'
      plan: small-v120
      workers: '${input.workers}'

Once you are happy, deploy the Cloud Template.

vRA - Cloud Template - type cloud.tanzu.cluster

Successful Deployment of a Tanzu Cluster

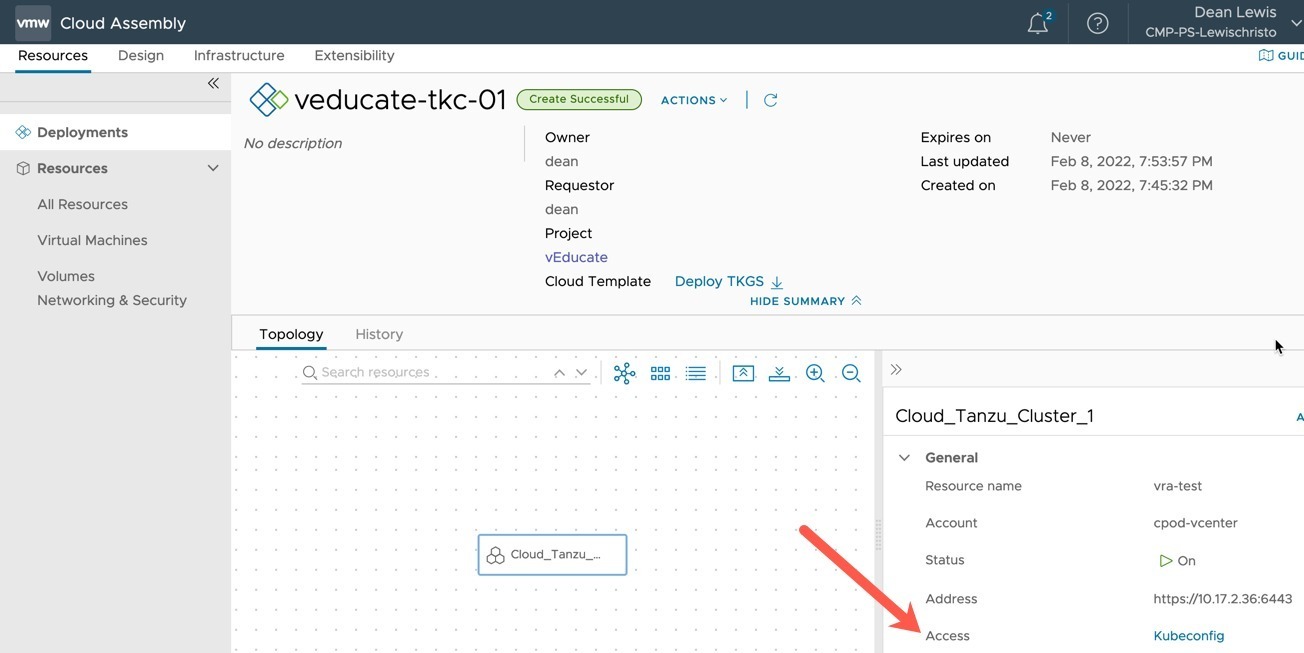
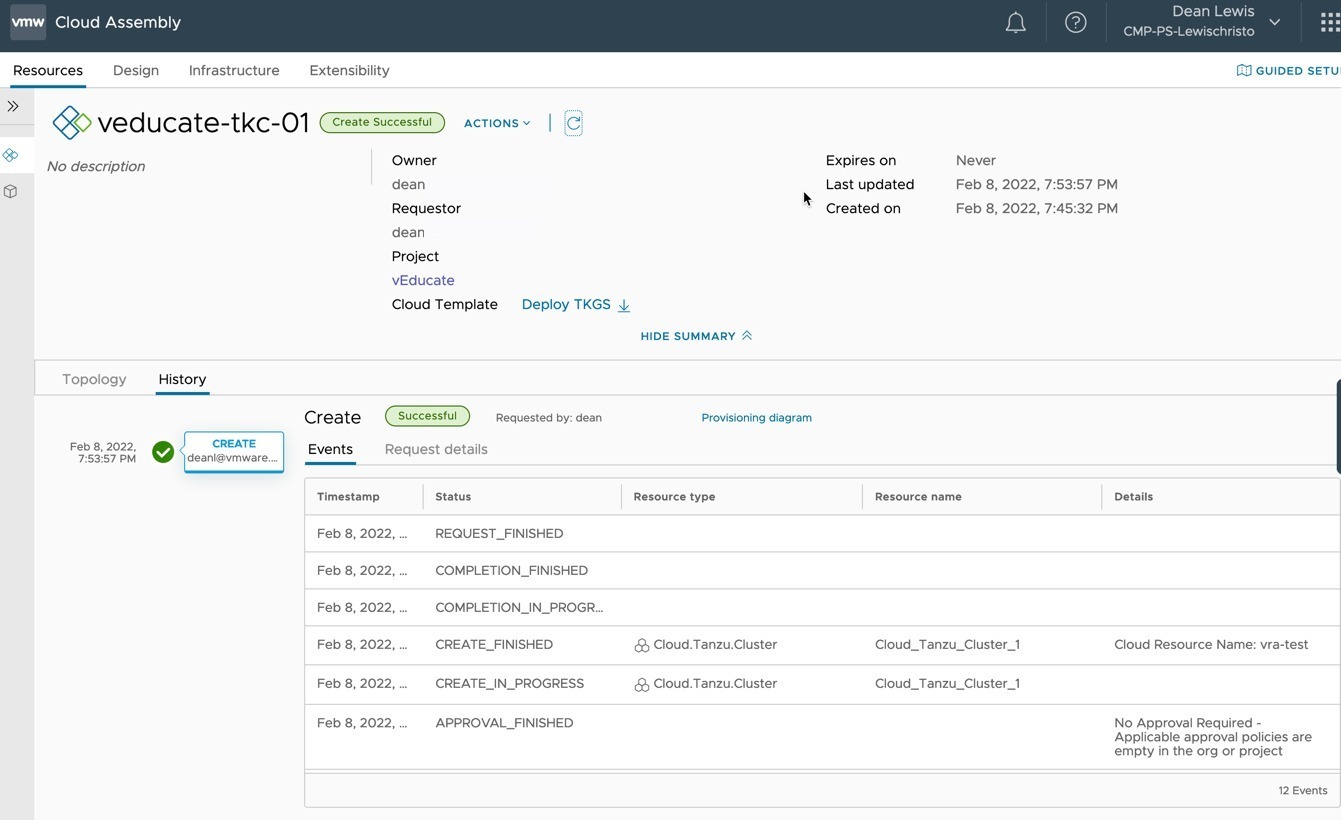
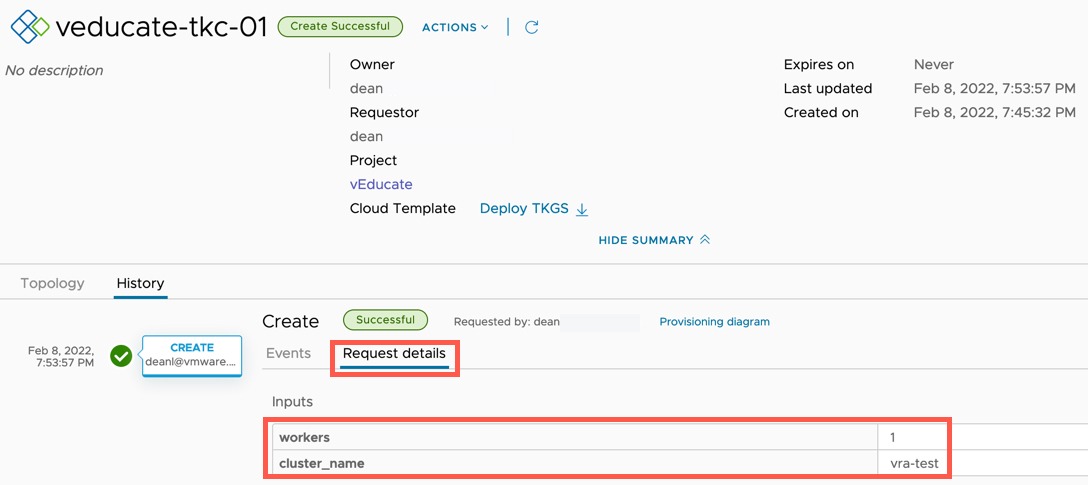
In the below screenshots, you can see the completed deployment.

  • Clicking on the Resource Object, you have the ability to download a Kubeconfig file to access the cluster.

vRA - Deployment completed - Resource Object details

  • Viewing the History Tab will show you details about the creation.

vRA - Deployment completed

  • Clicking on Request Details Tab will show you the user inputs take at the time of deployment.

vRA - Deployment completed - Request Details

If you look at the “Infrastructure” tab and the configuration under Kubernetes, you will see this cluster is onboarded into vRA. You can further use other cloud templates against this cluster to create Kubernetes namespaces within the cluster, for example.

vRA - Infrastructure - Kubernetes - Cluster

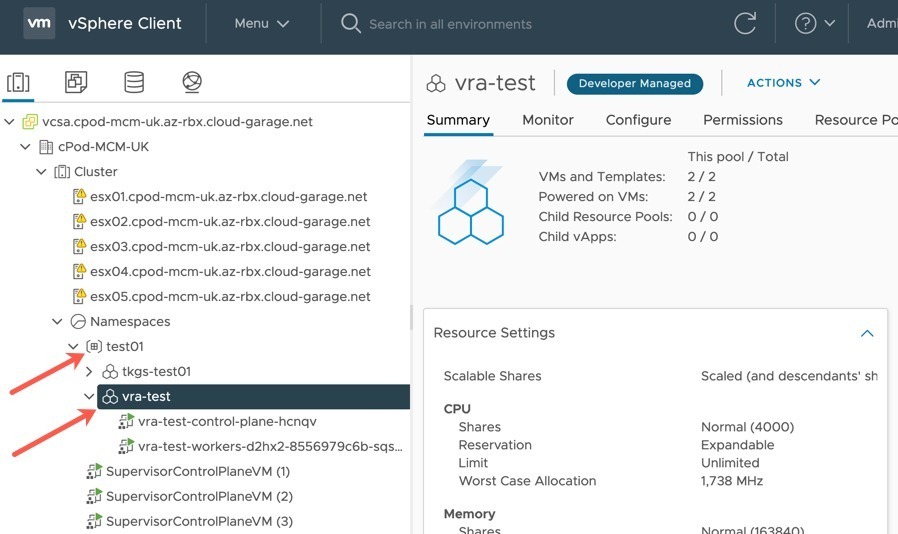
Finally, within my vCenter you can see my deployed cluster, to the Supervisor Namespace I specified in the Kubernetes Zone.

vRA - Deployed Tanzu cluster in vCenter Supervisor Namespace

Regards

Dean Lewis