kasten by veeam header

How to update Kasten to the latest version

This is probably one of the simplest blog posts I’ll publish.

To see if there is an available update for your Kasten install.

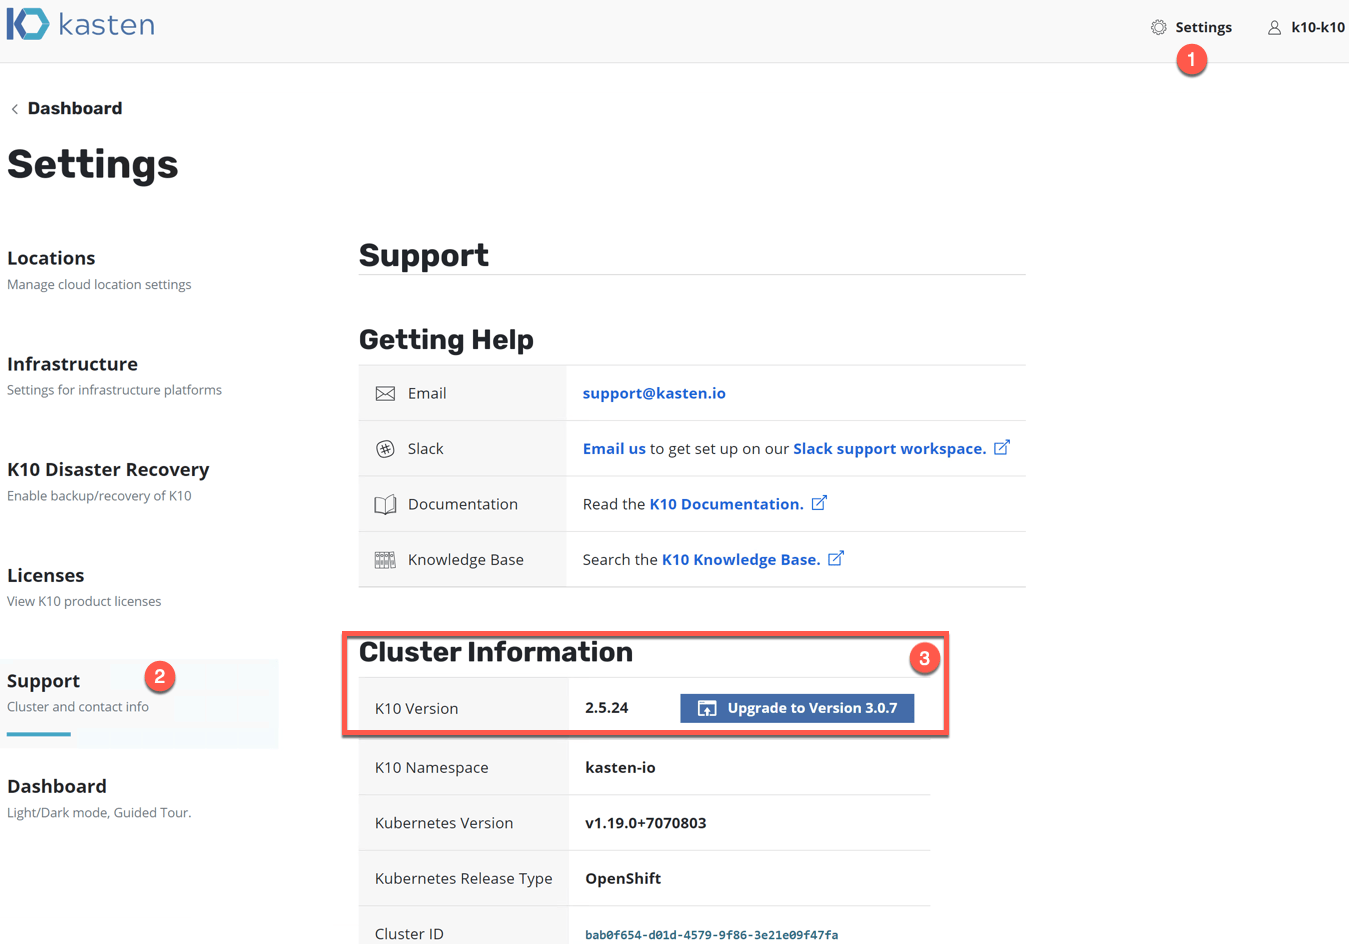
  • In the dashboard click > Settings
  • Click on Support

See if there is a notification under the Cluster Information heading.

kasten dashboard support cluster information

Clicking the “upgrade to version x.x.x” button will take you to this Kasten Docs page.

Or you can follow the same instructions with real life screenshots below.

To upgrade run the following using helm:

helm repo update && \
    helm get values k10 --output yaml --namespace=kasten-io > k10_val.yaml && \
    helm upgrade k10 kasten/k10 --namespace=kasten-io -f k10_val.yaml

helm upgrade k10 kasten k10

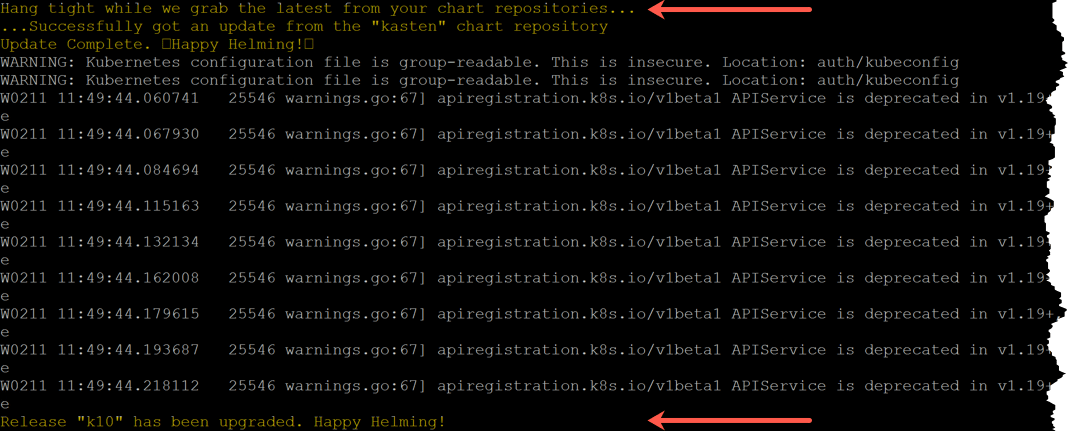
You will see messages similar to the below.

helm upgrade k10 kasten k10 - upgrade in progress - upgrade complete

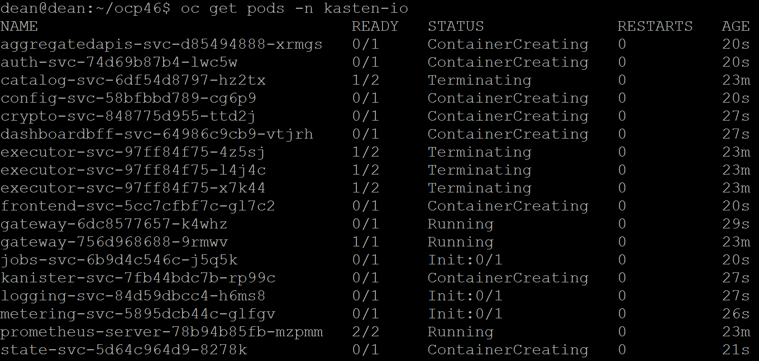
If I now look at my pods in my namespace “Kasten-IO” I can see they are being recreated as the deployment artifacts will have been updated with the new configuration including container images.

helm upgrade k10 kasten - oc get pods -n kasten-io

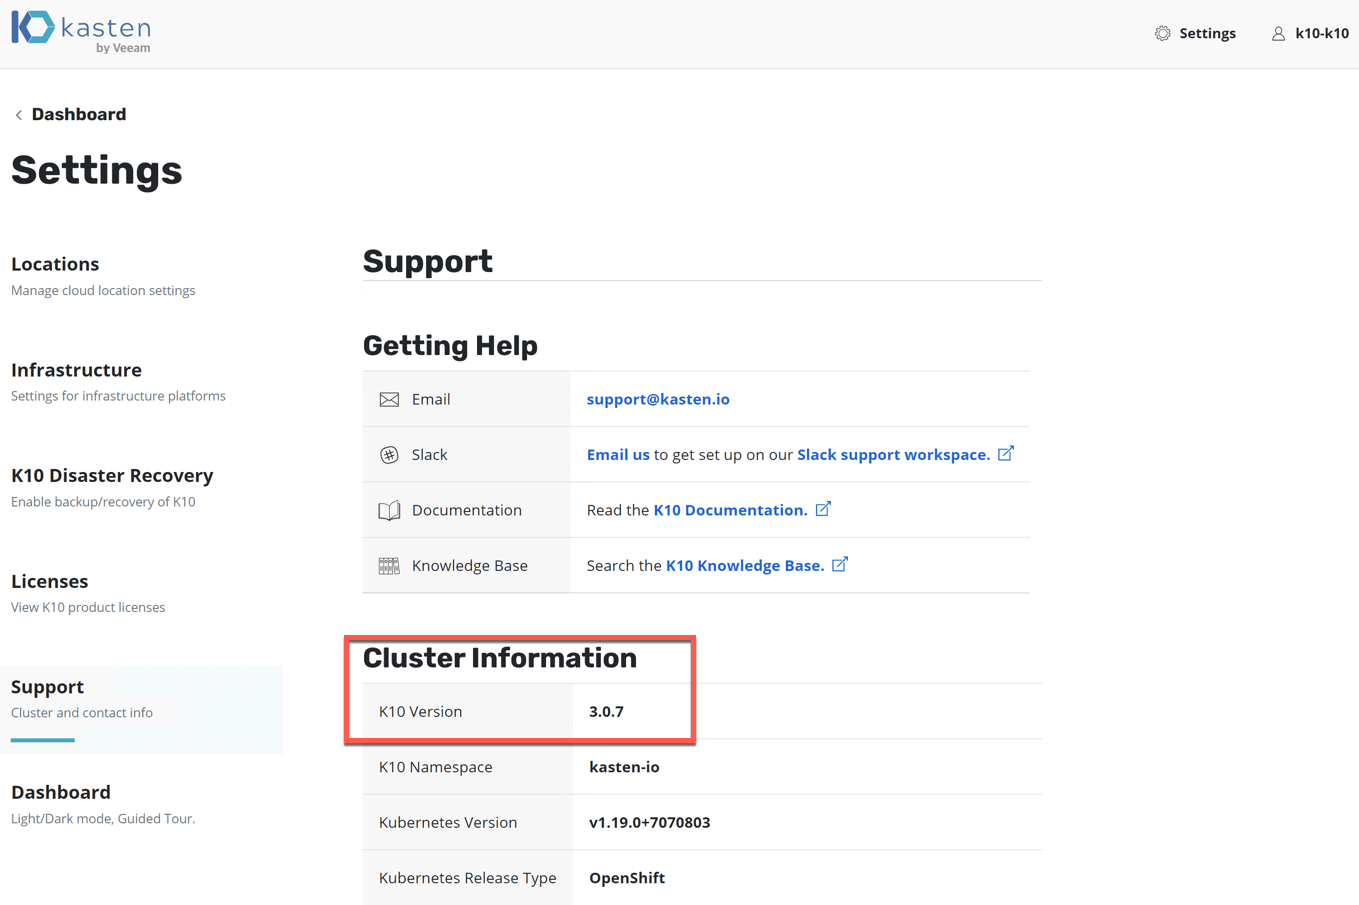
And finally looking back at my Kasten Dashboard for the cluster information, I can see I am now at the latest version.

helm upgrade k10 kasten dashboard upgrade complete

Regards


vRealize Operations Header

How to build a vROPs dashboard for tracking Total VMs deployed and Growth Trend

In this Blog post I am going to detail how I created a vROPs dashboard based on a customer’s request.

Can we track how many VMs have been created in the past week and track if the number increases or decreases in each cluster?

If you want to just get the dashboard, see directly below, if you want to learn how it was created, keep reading further.

Installing Dashboard
  1. Download the files from code.vmware.com sample page.
  2. Import the files appended with “view” under the view’s in vROPs
  3. Import the file appended with “Dashboard” under the dashboard section in vROPs.
Dashboard Breakdown
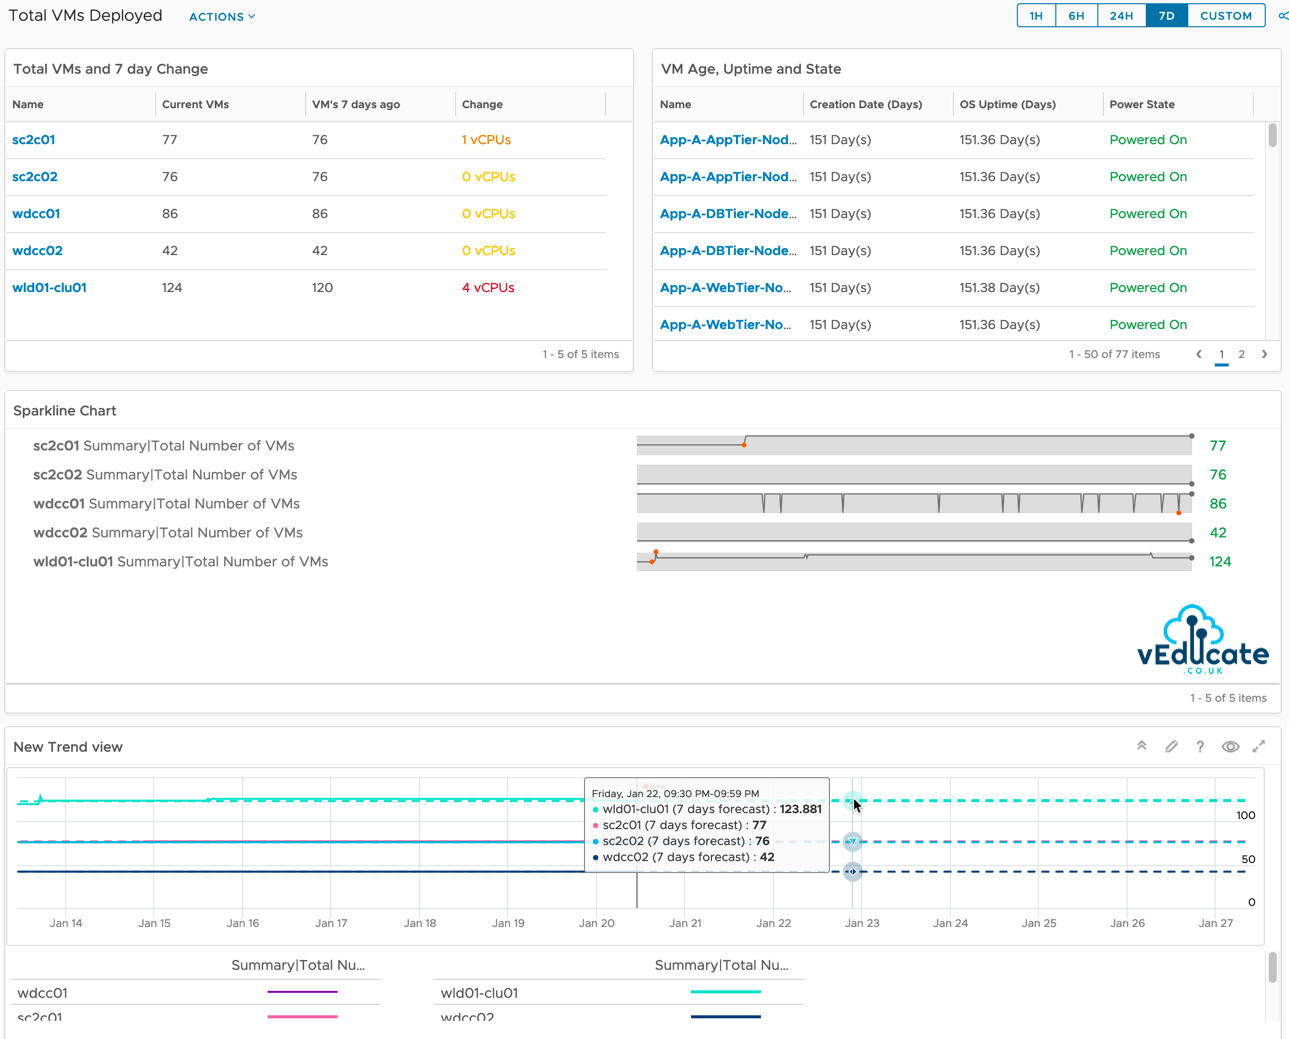
  • First Item – This is a list which I’ve created to show each cluster, the total VM metric with some expressions attached, the timescale here is fixed by the list view and not affected by the dashboard timeframe. The change is an expression of the count of VMs at the start and end of the timeframe. I’ve added in some basic colouring to alert at thresholds.
    • Why does it say vCPUs? When using expressions, it requires a Unit to be affixed. This doesn’t work if you’re counting something, so in our next release, this issue should be addressed. It’s purely a vanity thing.
  • Second Item – This shows the VMs attached to the cluster you select on the left-hand side, showing you how old that VM is, its uptime and current power state.
  • Third is a Sparkline – Showing an easy view of the changes in total VMs per cluster over a 7-day period (as defined by the dashboards time scale)
  • Forth item is a trend graph, where we are showing date of the changes in the Total VM metric based on the data we have, and the trend/forecast. This trend into the future is set within the item itself. Currently we can set this to show the forecast for the next 366 days in the future.

vROPS - Total VMs Deployed and Growth Trend

vROPs versions

To show the VM creation date, this metric is available in vROPs 8.2 and later. This dashboard/view should work with older versions of vROPs but omit the data for the missing metric.

How was the dashboard created?

First, we need to create three views. Continue reading How to build a vROPs dashboard for tracking Total VMs deployed and Growth Trend

VMware Tanzu Header

VMware Tanzu Mission Control – Using the Data Protection feature for backups and restores

In this blog post we will cover the following topics

- Data Protection Overview
- Create a AWS Data Protection Credential
- Enable Data Protection on a Cluster
- Running a backup manually or via an automatic schedule
- Restoring your data

The follow up blog posts are;

Tanzu Mission Control 
- Getting Started Tanzu Mission Control 
- Cluster Inspections 
- Workspaces and Policies  
- Data Protection 
- Deploying TKG clusters to AWS 
- Upgrading a provisioned cluster 
- Delete a provisioned cluster 
- TKG Management support and provisioning new clusters
- TMC REST API - Postman Collection
- Using custom policies to ensure Kasten protects a deployed application
TMC Data Protection Overview

Tanzu Mission Control implements data protection through the inclusion of the Project Velero,  this tool is not enabled by default. This blog post will take you through the setup.

Data is stored externally to a AWS location, with volume backups remaining as part of the cluster where you’ve connected TMC.

Currently there is no ability to backup and restore data between Kubernetes clusters managed by TMC.

Create a AWS Data Protection Credential

First we need to create a AWS data protection credential, so that TMC can configure Velero within your cluster to save the data externally to AWS.

If you are looking for supported options for protecting data to other locations, I recommend you either look at deploying Project Velero manually outside of TMC (losing access to the data protection features in the UI) or look at another enterprise service such as Kasten.io.

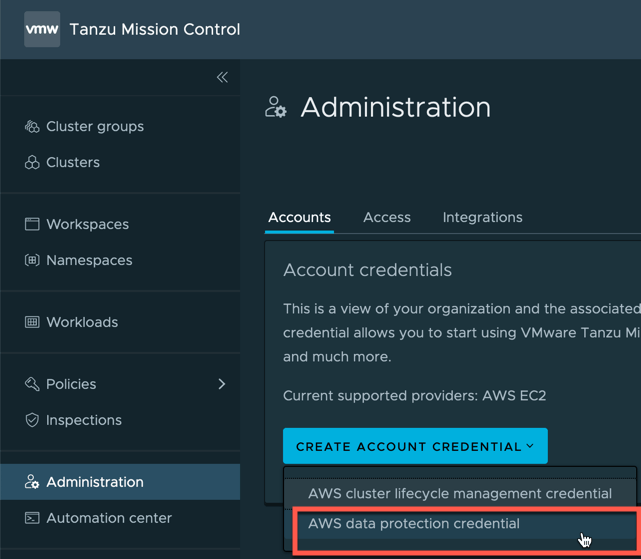
  • On the Administration screen, click Accounts, and Create Account Credential.
  • Select > AWS data protection credential

TMC Data Protection Create Account Credential AWS data protection credential

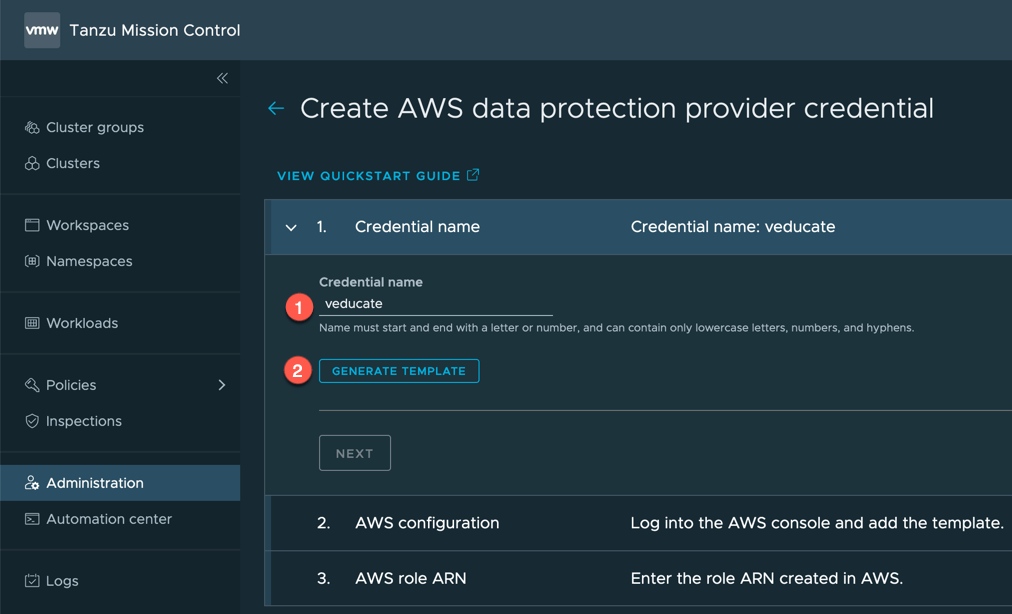
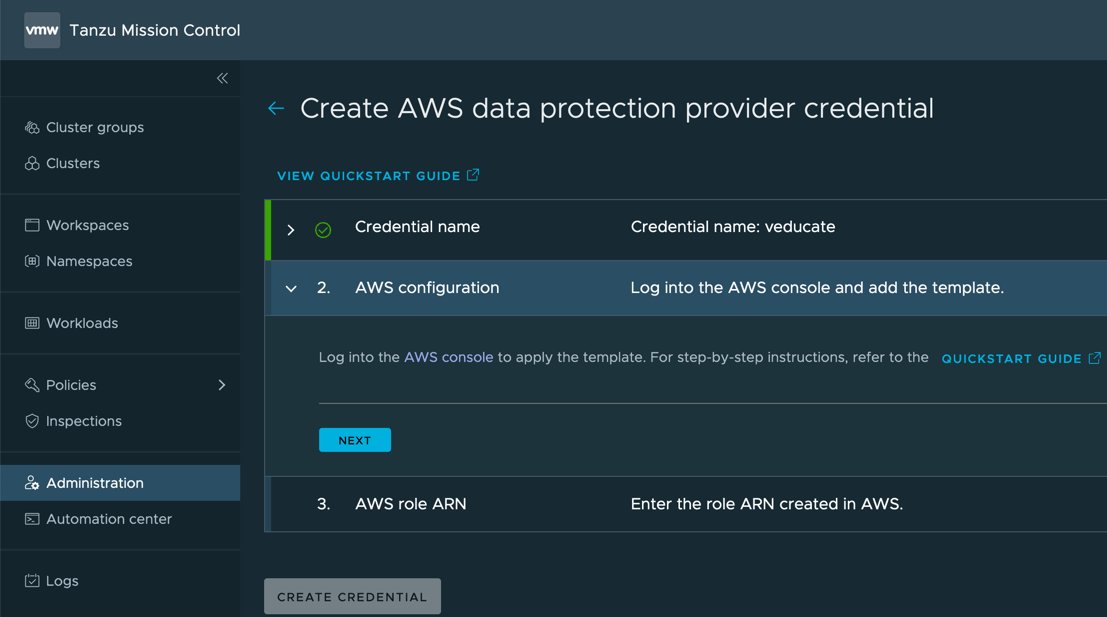
  • Set your account name for easy identification and click to generate template and save this file to your machine.

TMC Data Protection Create AWS Data protection credential Credential Name Generate template

The next steps will require configuration in the AWS console to create resources using CloudFormation so that Project Velero can export data to AWS. Here is the official VMware documentation on this configuration.

TMC Data Protection Create AWS Data protection credential log into the AWS console

  • In the AWS Console, go to the CloudFormation service

TMC Data Protection AWS Console Cloud Formation

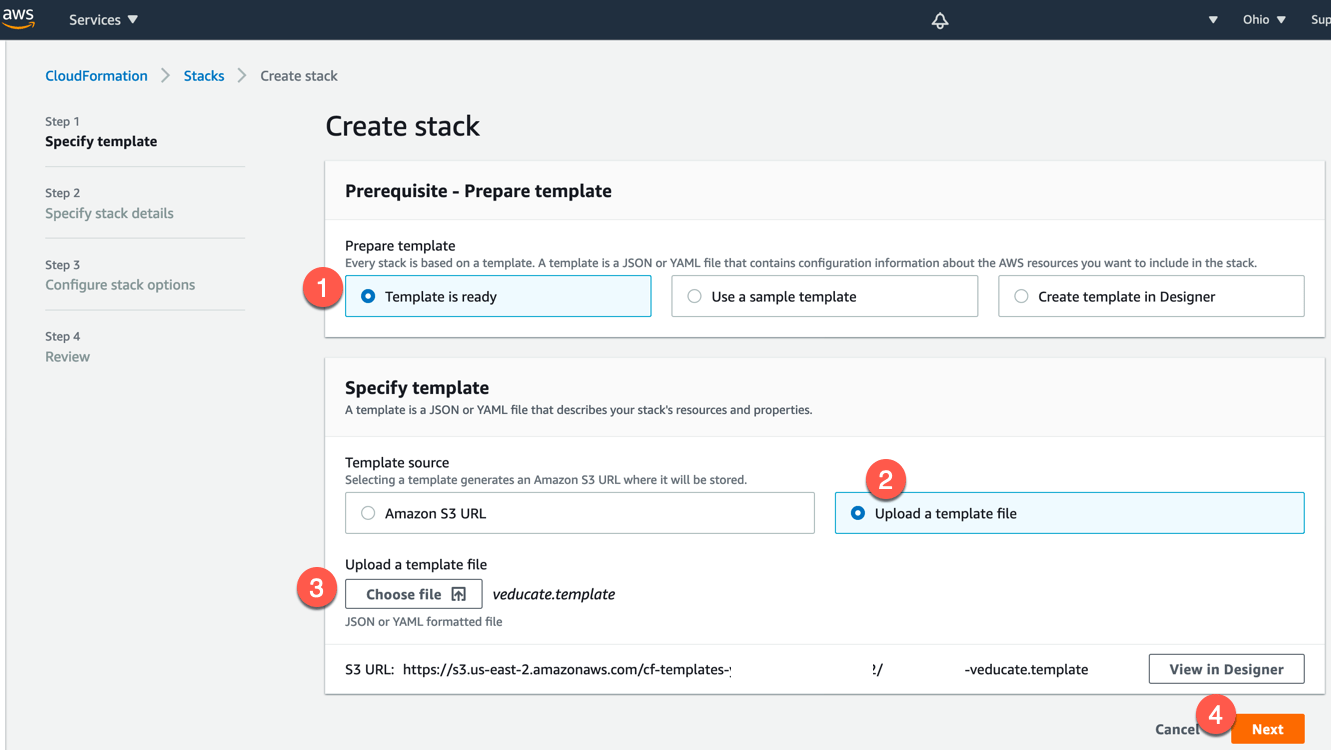
  • Click to create a new stack
  1. Click “Template is ready” as we will provide our template file from earlier.
  2. Click to upload a template file
  3. Select the file from your machine
  4. Click next

TMC Data Protection AWS Console CloudFormation Create a Stack Specify template

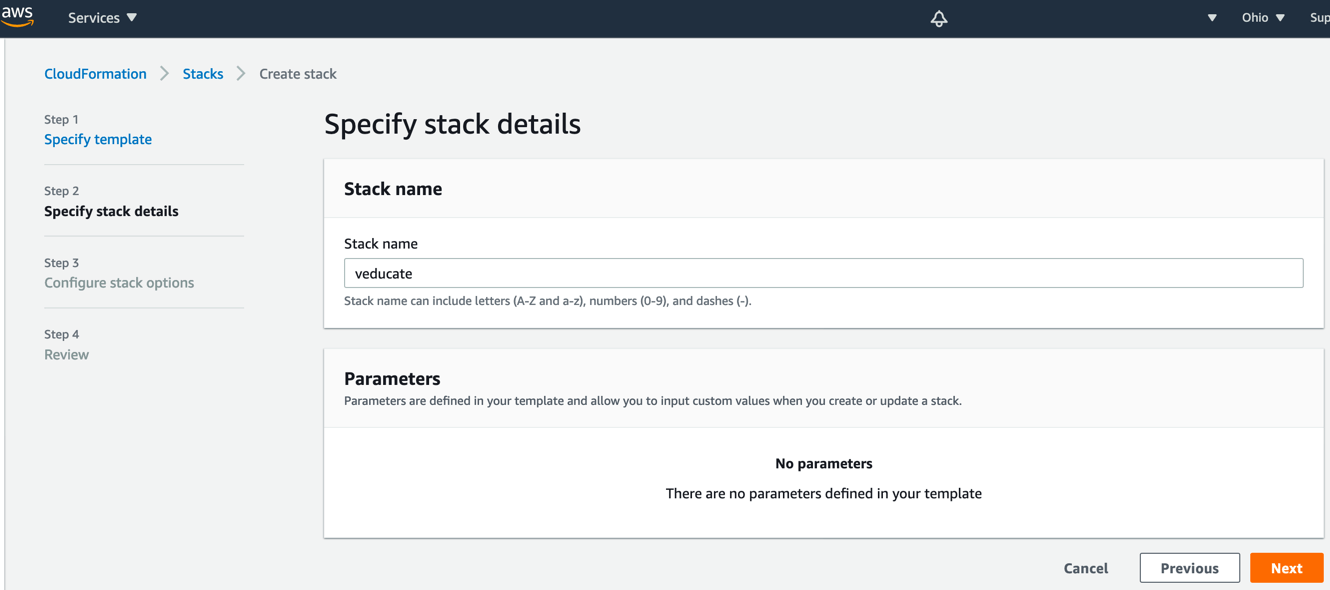
  • Provide a stack name and click next

TMC Data Protection AWS Console CloudFormation Create a Stack Specify stack details

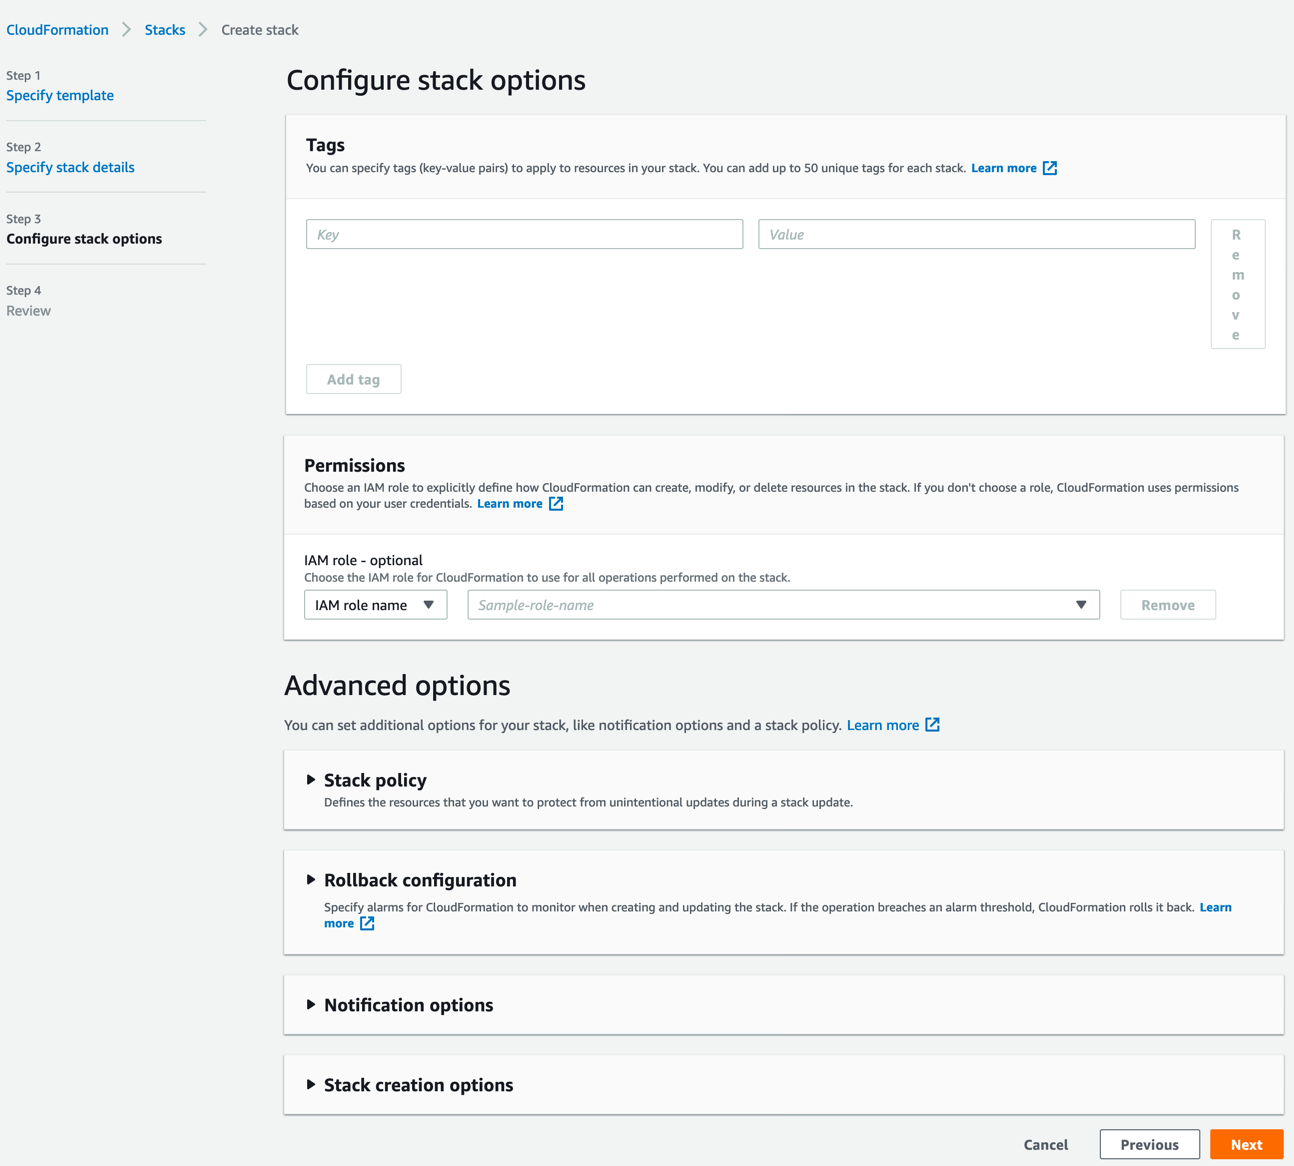
  • Ignore all the items on this page and click next
  • Review your configuration and click finish.

TMC Data Protection AWS Console CloudFormation Create a Stack Configure Stack Options

  • Once you’ve reviewed and clicked create/finish. You will be taken into the Stack itself.
  • You can click the Events tab and the refresh button to see the progress.

Continue reading VMware Tanzu Mission Control – Using the Data Protection feature for backups and restores

VMware Tanzu Mission Control Red Hat OpenShift header

Enabling Tanzu Mission Control Data Protection on Red Hat OpenShift

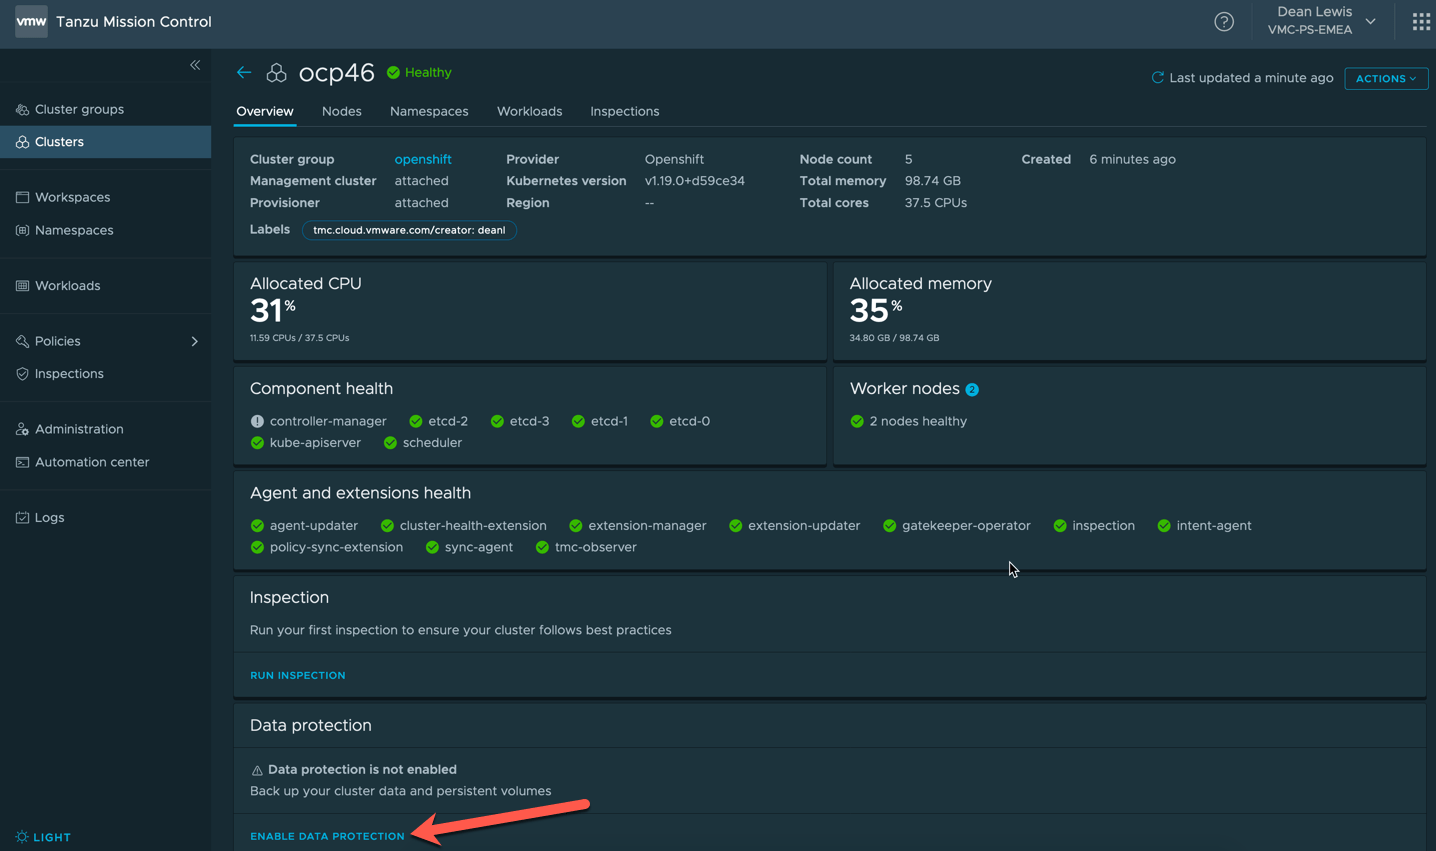
Just a quick blog on how to get the Data Protection feature of Tanzu Mission Control on Red Hat OpenShift. By default you will find that once the data protection feature is enabled, the pods for Restic component of Velero error.

  • Enable the Data Protection Feature on your Openshift cluster

TMC Cluster Overview enable data protection

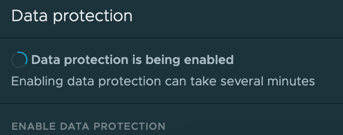
  • You will see the UI change to show it’s enabling the feature.

TMC Enabling Data Protection 2

  • You will see the Velero namespace created in your cluster.

TMC oc get projects velero vmware system tmc

However the “Data Protection is being enabled” message in the TMC UI will continue to show without user intervention. If you show the pods for the Velero namespace you will see they error.

This is because OpenShift has a higher security context out of the box for containers than a vanilla Kubernetes environment.

TMC oc get pods restic error crashloopbackoff

The steps to resolve this are the same for a native install of the Project Velero opensource install to your cluster.

  • First we need to add the velero service account to the privileged SCC.
oc adm policy add-scc-to-user privileged -z velero -n velero

TMC oc adm policy add scc to user privileged velero

  • Secondly we need to patch the DaemonSet to allow the containers for Restic run in a privileged mode.
oc patch ds/restic \
--namespace velero \
--type json \
-p '[{"op":"add","path":"/spec/template/spec/containers/0/securityContext","value": { "privileged": true}}]'

After this, if we run the command to get all pods under the Velero namespace again, we’ll see that they are replaced with the new configuration and running.

TMC oc get pods restic running

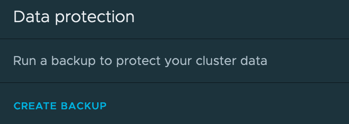
Going back to our TMC Console, we’ll see the Data Protection feature is now enabled.

TMC data protection enabled

Regards

Wordpress and google analytics

Using Google Analytics to view your visitors exact referral page and landing page

Just a quick one as this was really annoying me and I have to click around to remember how to find the info each time.

The Issue

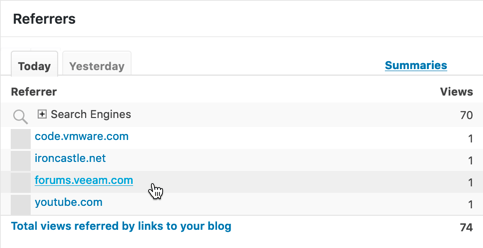
When viewing my page stats in JetPack on WordPress, I can see referrals from forums such as from Veeam, but I’ve no idea why I’m getting hits, is someone sharing my content on there?

referrals jetpack

This is the way

I’ve setup Google Analytics to give me further information on the traffic to my site. See this blog post here.

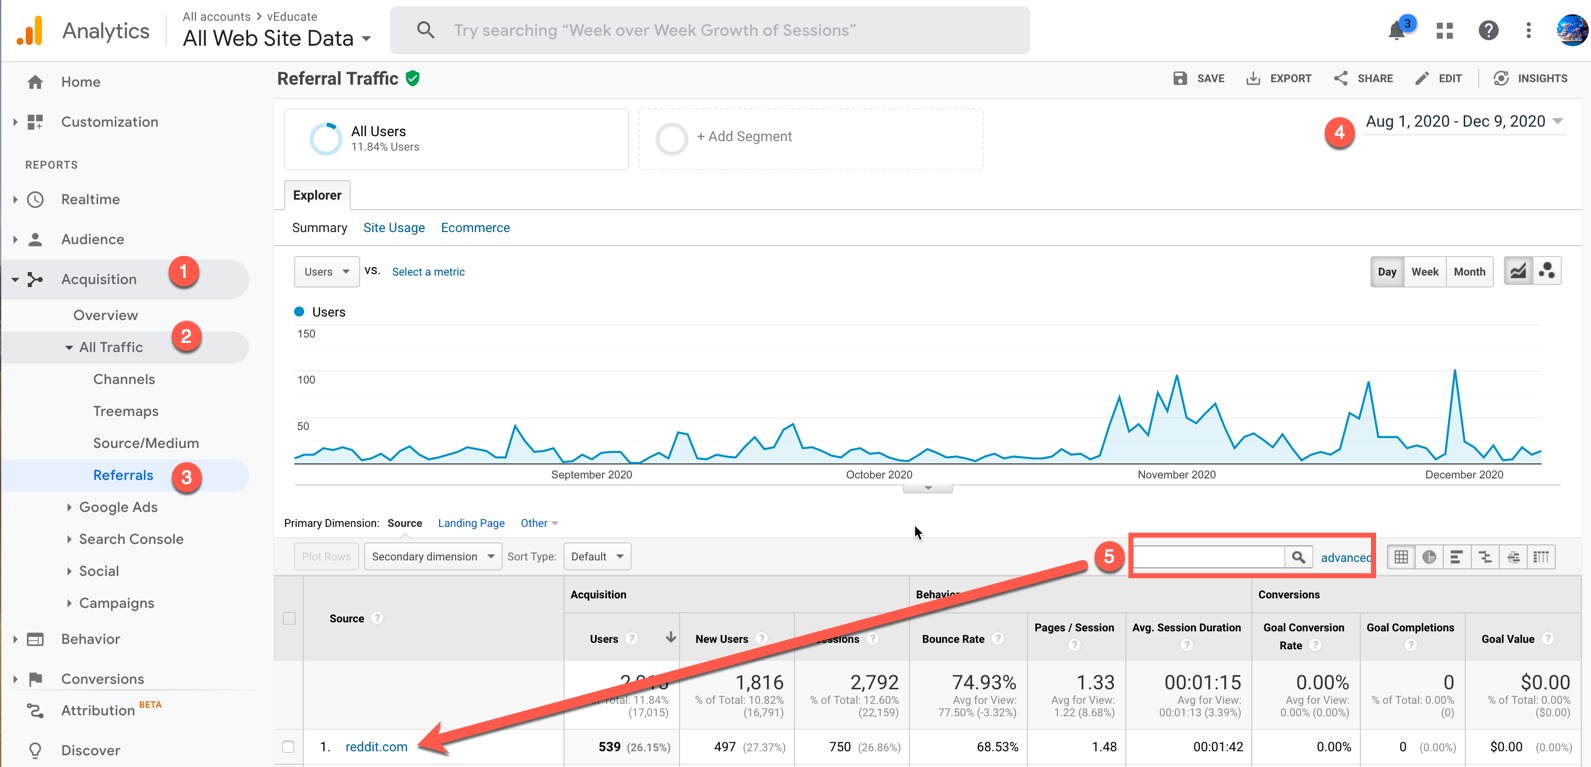
Once logged into the Google Analytics homepage and data is collecting.

  1. Go to Acquisition
  2. Expand All Traffic
  3. Click Referrals
  4. Set the time frame you’re interested in
  5. Either search for your referrer and then click on the referrer

Google Analytics referrals

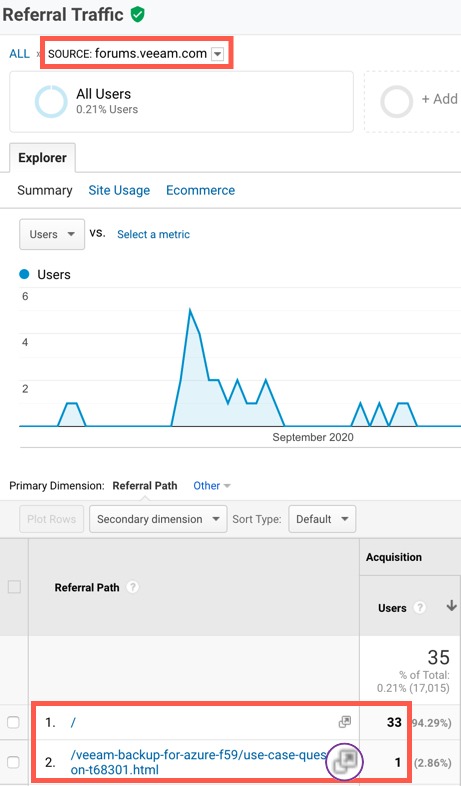
Below I’ve clicked to limit the views to the referral traffic source as “forums.veeam.com”.

You can click the highlighted source filter to change to the various referral listings. At the bottom I can see which page the users visited my website from, rather than just the high-level domain.

Clicking the little outbound link symbol will take you to the exact referral page.

Google Analytics referrals filtered

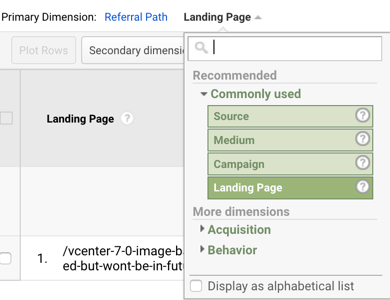
You can also change this view to show you the landing page on your website, so where did the user go to.

Under Primary dimension (above your referral paths), change the setting for Other to Landing Page.

Google Analytics - primary dimension - landing page

Hope this helps!

Regards